
Effects of Temperature and Polyvinyl Alcohol concentrations in the Synthesis of Zinc Oxide Nanoparticles
Bulcha Bekele, A. R. Chandra Reddy
Affiliation
1,3Adama Science and Technology University, School of Applied Natural Science, Department of Applied Physics, P.O.Box 1888, Adama, Ethiopia
2Dambi Dollo University, College of Natural and Computational Science, Physics Department, P.O.Box 206, Ethiopia
Corresponding Author
Abebe Belay, Adama Science and Technology University, Applied Physics Program, Adama, Ethiopia, P.O. Box no: 1888, Email: abebebelay96@gmail.com
Citation
Abebe Belay., et al. Effects of Temperature and Polyvinyl Alcohol Concentrations in the Synthesis of Zinc Oxide Nanoparticles. (2018) J Nanotechnol Material Sci 5(1): 44-50.
Copy rights
© 2018 Abebe Belay. This is an Open access article distributed under the terms of Creative Commons Attribution 4.0 International License.
Keywords
ZnO NPs; Sol-Gel method; Crystal size; Temperatures effects and different PVA concentrations
Abstract
In this research the effects of annealing temperature and polyvinyl Alcohol (PVA) concentrations on the structural and optical properties of zinc oxide nanoparticles were investigated using a simple and cost effective, sol-gel method. The materials were characterized using X-Ray Diffraction (XRD), Fourier Transform Infrared (FT-IR), UV-Vis spectroscopy, Scanning Electron Microscopy (SEM) and Fluorescence Spectroscopy. From XRD result the synthesized ZnO has pure phase hexagonal wurtzit structure. Crystalline size, diffraction intensity and lattice parameters are increase with increase in calcinations temperature. Similarly, it has been also observed that there was an increment in the sizes, diffraction intensity and lattice parameters as the PVA concentrations increased. The morphology of ZnO NPs was characterized by SEM at different annealing temperatures. The FT-IR peaks appeared in the region of 400-600 indicated the successful synthesizes of ZnO. The optical absorption of ZnO NPs measured at different annealing temperatures and PVA concentrations showed red shift as the temperature and concentrations were increased. Band-gaps energy decrease as the temperature and concentration decreases are due to the changes in the quantum confinement of NPs. The peak emission of the samples is independent of the temperature but its emission intensity depends on the temperature i.e it increased as the temperatures of the samples increased.
Introduction
Zinc oxide nanoparticles (ZnO NPs) have unique physical and chemical properties, such as high chemical stability, high electrochemical coupling coefficient, broad range of absorption radiation and high photo stability with multifunctional materials[1-2]. It has wide direct band gap energy (3.37 eV), large exciton-binding energy (60 meV) and high thermal and mechanical stability at room temperature[3]. ZnO NPs have also attributed to excellent properties such as easy synthesis, tuneable band gap, controlled shape and size, low cost production and non-toxic[4]. The presence of large number of extrinsic and intrinsic defects in the ZnO structures act as emission centers. It has also able to emit light in various colors such as, violet, blue, green yellow and red[6-7]. Because of these remarkable and peculiar properties it has wide applications in the areas of energy generator and photocatalysis[8-9], medical science, cosmetics, and antibacterial[10-11].
Several methods have been reported in the literatures which individually and collectively affect the shape, sizes and optical properties of ZnO NPs. The various factors are precursor concentrations[12-13], temperature[14-15], duration[16], surfactant concentrations[17], dopant concentration[11], solvent medium[18] pH of reaction mixture[19], and source of light during synthesis. Recently polymers were also used to prepare a number of oxide NPs where the polymer skeleton eventually limits the growth to a specific shape of the lattice[20-22]. The recent XRD analysis of ZnO studied by[23], showed thermal annealing lead to an improvement in the crystallinity and associated with increase in crystal size as well as increase in both Zn-O bond length and unit cell volume. In addition, it has been observed that the ZnO NPs synthesized from (Zn(NO3)2.6H2O) and PolyVinyl Alcohol (PVA) under different calcinations temperatures have an effect on particles sizes, crystallinity and morphology of NPs[24-26]. Increasing the temperature makes the intensity of the peaks to get sharpened and it increased with increasing temperature. Primarily the peak intensity is attributed to increase of the crystallinity and crystal size. Therefore, annealing temperature is an important parameter which influences the morphology and sizes of the particles. Similarly, the effect of different ratios of PVA on the morphology of ZnO nano-powders was studied via PVA-assisted freezing drying process[27]. Increasing the number of particles in a given volume affects the rate of reaction because cramming more particles into at fixed volume increases the concentration of reactant and these by increasing frequency of the collision leading to higher reaction rate. So, increasing concentrations also increase the particle size. In this research the effects of calcinations temperatures and concentrations of PVA on morphology, structure, sizes and optical properties of ZnO NPs were investigated by sol-gel method. The method has much interest in view of simplicity, low cost, reliability, and relatively gives homogenous, high purity and high quality nanopowders. And the techniques are also easier to tune the nanoparticle size, shape and crystallinity.
Materials and Methods
Materials: Polyvinyl Alcohol ([-CH2CHOH-]n used as chelating agent and Zinc nitrate hex-hydrate (Zn(NO3)2.6H2O) were used as the precursor chemical and both are purchased from Himedia, India : assay > 99.2%.
Synthesis methods: ZnO NPs were prepared by sol-gel method[28]. 6 gm of Polyvinyl Alcohol was dissolved in 60 ml of double distilled water and stirred for 30 min till a homogenous milk white solution obtained. Again 2 gm of zinc nitrate hexa-hydrate (Zn(NO3)2.6H2O) also dissolved in 20 ml of double distilled water and stirred by magnetic stirrer for 15 min. Zinc nitrate hexa-hydrate (Zn(NO3)2.6H2O) solution was added into chelating agent, PolyVinyl Alcohol (PVA) solution drop by drop at 70 °C under suitable magnetic stirring for 2 hrs. The mixture solution should be stirred till the gel like substances are formed. The gel sample was allowed to dry in an oven at 160°C for 12 hrs. The sample was calcinated in muffle furnace (Model No: MC2-5/5/10-12, Biobase, Chaina) at the temperature of 400 - 600 °C in open air for 8 hrs. The same procedure was followed to prepare PVA concentrations dependent (1.89, 2.27, and 3.34 M) ZnO NPs at the temperature of 400°C.
Characterization methods: The X-Ray Diffraction (XRD) pattern for ZnO nanoparticles were analyzed using XPERT-PRO X-ray diffractometer by generating Cu-Kα radiation (λ = 1.5418Å). It is used to determine the crystalline phase of the synthesized nanoparticles. An X-ray generator operates at a voltage of 40 kV and applied current of 30 mA at room temperature. Intensities were measured at room temperature for angle range of 2θ = 10° ≤ 2θ ≤ 80. All the diffraction peaks are well indexed to the hexagonal ZnO wurtzite structure (JCPDS card no. 36-1451). The average nano crystallinesize was calculated from the Debye Scherrer formula as follows[29].
 (1)
(1)
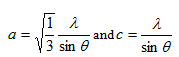
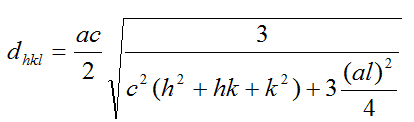
Where λ, θ, β and D are x-ray wavelength, Bragg’s diffraction angle, full width at half maximum of the peak and average grain size of the crystalline particle respectively. The lattice parameters ‘a’ and ‘c’ and the spacing distance dhkl for the wurtzite structure of ZnO can be calculated using the Equation (2) and (3)
 2)
2)
 (3)
(3)
The unit cell volume (V) of the hexagonal system was calculated by using the following formula
V = 0.866a3c (4)
The Zn-O bond length (L) is given by
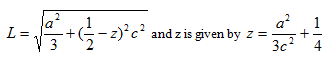 (5)
(5)
The morphology of the resulting nanoparticles was characterized using Scanning Electron Microscope (Hitachi, H-7600). The optical absorption of the samples was measured by UV-Vis-NIR spectrophotometer (Perkin Elmer, Lambda 950) in the wavelength regions of 200 - 500 nm at 2 nm resolutions. The band gap energy of ZnO NPs is calculated using Equation (6)
 (6)
(6)
The vibrational spectra of ZnO NPs were measured by FT-IR (Perkin Elmer 65) in the range of wave number from 400 - 4000 cm-1. The photoluminescence properties of ZnO NPs were measured by spectrofluorometer (Fluoromax4, Spectrofluorometer) at room temperature with Xe lamp as the excitation light source at resolution of 1 nm. The excitation and emission spectra are 264 and 380 - 500 nm respectively.
Results and Discussion
X-Ray Diffraction
The XRD patterns of ZnO NPs synthesized by the sol-gel method at different annealing temperature of 400, 500 and 600°C showed in Figure 1 All XRD diffraction peaks of ZnO powders are in a good agreement with wurzite structure (hexagonal phase, space group P63mc) with lattice parameters a = b = 3.249 A° and c = 5.206 A°as reported in (JCPDS card no. 36-1451). Nine characteristic peaks were appeared at 31.802°, 34.468°, 36.306°, 47.600°, 56.592°, 62.951°, 66.411, 67.91 69.152° correspondingto (100), (002), (101), (102), (110), (103), (200), (112) and (201) of crystal planes. The samples (101) peak is the most intense peak that shows the plane is a preferred growth plane. The diffraction peak intensity also markedly increases with annealing temperature as shown in Figure 1a-c. This may indicate that high annealing temperature provides sufficient energy to crystallites to orient in proper equilibrium sites and causes an increase in intensity[30-31]. The average crystal sizes of ZnO NPs were calculated by Debye Scherrer formula using Equation (1) based on the full width at half-maximum (FWHM) of the peaks and is shown in the Table 1. The average crystal sizes of ZnO NPs at annealed temperature of 400, 500 and 600°C are 22 nm, 24 nm and 29 nm respectively. This result shows that, the average crystal sizes of ZnO NPs increased as the annealing temperature increased which is in good agreement with the result reported previously by[23-26]. The thermal annealing lead to an improvement in the crystallinity and associated with increase in crystal size, diffraction intensity as well as increase in both the Zn-O bond length and unit cell volume as shown in table 2. On other hand, the Full-Width at Half Maxima (FWHM) of ZnO NPs decreases as the annealing temperatures increased. The effects of annealing temperature on the lattice parameter of ZnO NPs were calculated using Equation(2) and shown in table 2. The lattice parameters are temperature dependent i.e. an increase in temperature leads to expansion of lattice parameters. The lattice parameters of pure zinc oxide reported by (JCPDS card no. 36-1451) are a = 0.325 nm and c = 0.521 nm are match with value obtained for ZnO NPs synthesized in this research. In addition, the nearly constant value of c/a ratio confirms that annealing of ZnO nanostructure does not make noticeable deformation in the lattice constant. Figure 2 shows XRD patterns of ZnO NPs synthesized by changing concentration of PVA solution (1.89, 2.27 and 3.34M) at 400°C respectively. The X-ray diffraction peaks of ZnO NPs with different concentrations are 2θ = 31.99°, 34.45°, 36.32°, 47.60°, 56.86°, 62.93° and 67.86° which correspond to reflecting from (100), (002), (101), (110), (120), (103) and (112) of crystal planes respectively. The calculated average crystal sizes of ZnO NPs are 19, 22 and 24 nm for PVA concentrations of 1.89, 2.27 and 3.34 M respectively as shown in Table 3. The particle sizes, diffraction intensity and lattice parameters of ZnO NPs were increased as the PVA concentrations increased due to an increase in the number of molecules that required minimum energy[31].
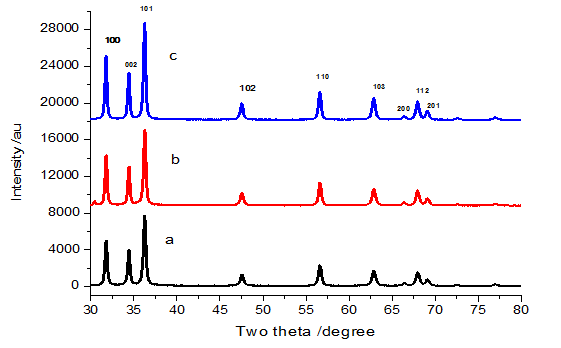
Figure 1: XRD patterns of ZnO NPs synthesized at annealing temperatures of a) 400°, b) 500° and c) 600° respectively.
Table 1: Crystal size of ZnO NPS estimated using Debye –Scherer formula at the temperature of 400°, 500° and 600°.
| Temperature/ °C | Particle size (D)/nm |
|---|---|
| 400 | 22 ± 3 |
| 500 | 24 ± 3 |
| 600 | 29 ± 6 |
Table 2: Lattice parameter, spacing distance, and unit cell volume and bond length of synthesized ZnO NPs at different annealing temperatures.
| Temperatures | hkl | lattice parameter | dhkl (nm) | V(A03) | L(A0) | ||
|---|---|---|---|---|---|---|---|
| a(nm) | c(nm) | c⁄a | |||||
| 400°C | 101 | 0.2857 | 0.4952 | 1.733 | 0.1871 | 35.00 | 1.7871 |
| 500°C | 101 | 0.2859 | 0.4955 | 1.733 | 0.1872 | 35.07 | 1.7887 |
| 600°C | 101 | 0.2860 | 0.4957 | 1.733 | 0.1873 | 35.11 | 1.7892 |
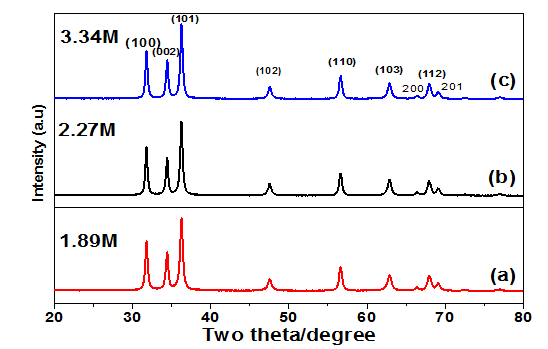
Figure 2: XRD patterns of ZnO NPs synthesized using various PVA concentrations, a) 1.89M, b) 2.27M and c) 3.34M
Table 3: average crystal size of ZnO NPS at different PVA concentrations.
| Concentration (M) | Particle size (D)/nm |
|---|---|
| 1.89 | 19 ± 6 |
| 2.27 | 22 ± 4 |
| 3.34 | 24 ± 3 |
Scanning electron microscopy: Figure 3 a-c shows the SEM images of the synthesized ZnO NPs using PVA as reducing agent at annealing temperatures of 400°C and 500°C respectively. As shown the figures morphology of the particles is uniform and hasspherical shape. Also particles size and agglomeration of ZnO NPs increased as annealing temperature increased; this indicates the formation of larger particle sizes with small surface area to volume ration of NPs[30].
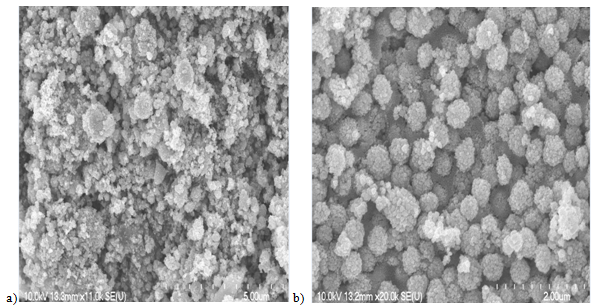
Figure 3: Scanning Electron Microscope images of ZnO NPs at a) 400°C and b) 500°C of annealing temperatures.
Fourier transform infrared spectroscopy: Figure 4 shows the FTIR spectra of ZnO NPs measured in the wavenumber regions of 400 - 4000 cm-1 at different annealing temperature. The broad and sharp band observed around 3447 and 1597 cm-1 are the characteristics of hydroxyl (OH) group[32-33]. The small band found in the regions of 1718-1745 cm-1 are belong to C=O stretching vibration of carboxylic acid attached from PVA. The peaks observed in the regions of 2915 - 2940 cm-1 are belonging to C-H stretching. The intensity of the bands is significantly reduced at annealing temperature of 600°C due to removal of functionalgroups and the formation of pure wurtzite structure.
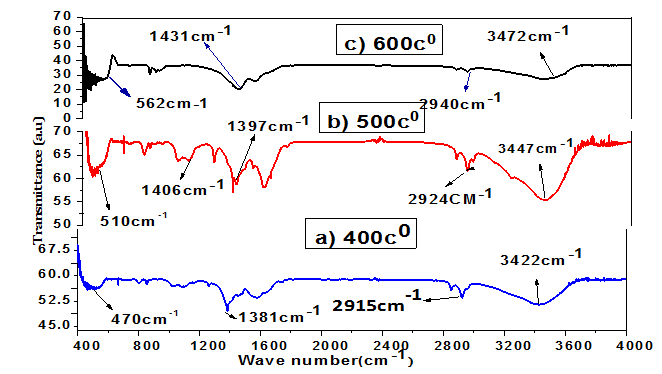
Figure 4: FT-IR spectra of synthesized ZnO NPs at different annealing temperatures.
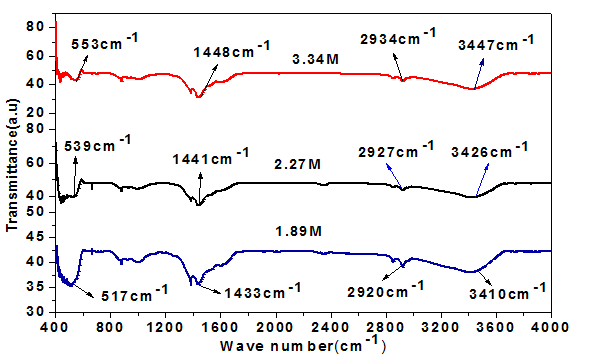
Figure 5: FT-IR spectra of synthesized ZnO NPs at 1.89, 2.27 and 3.34M PVA concentrations.
Similarly, the FT-IR spectra of measured ZnO NPs by varying the concentrations are shown in figure 5 below. From the graph, the broad band observed in the region of 3200 - 3600 cm-1 is due to the presence of hydrogen bond (O-H) vibration. Presence of O-H group represents the presence of water molecules on the surface of ZnO nanoparticles[34-35]. Similarly, the transmission peaks observed in the region of 2800 - 3200 cm1 are due to C-Hstretching frequency of alkyl groups. The strong peak position observed in the range of 445 - 556 cm-1 was attributed to characteristics of ZnO wurtzite structure[35]. In general shifting in peaks positions were observed as the temperature and concentration of PVA samples are changed.
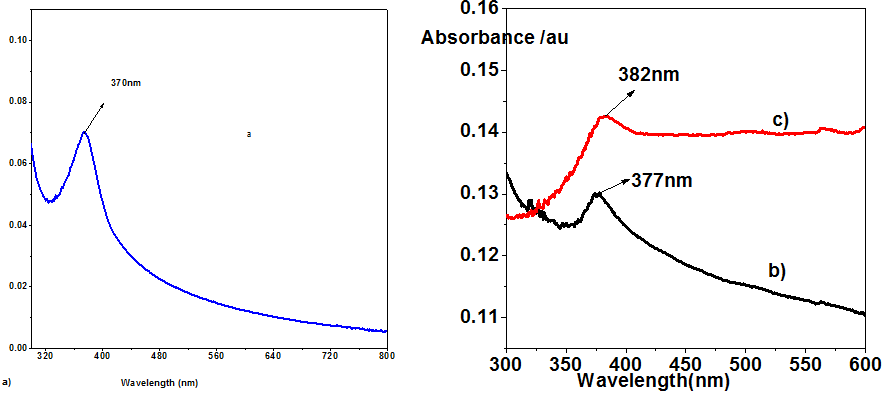
Figure 6: UV/vis Spectra of synthesized ZnO NPs at a) 400°C b) 500°C and c) 600°C.

Figure 7: UV-Vis Spectra of synthesized ZnO NPs at different PVA concentrations.
UV-visible spectroscopy: Figure 6 shows UV-Vis absorption spectra of ZnO NPs at different annealing temperatures. The absorption peak was observed at 370 nm, 377 nm and 382 nm for annealing temperatures of 400, 500 and 600°C respectively. As temperature increased peak absorbance wavelength shifted to red due to decreasing in quantum confinement of the particles. The peaks are due to electronic transition from valence band to conduction band[34]. The band gap energy of ZnO NPs calculated using Equation (6) were found to be 3.314, 3.251 and 3.176 eV for 400 500 and 600°C respectively. The band gaps energy of ZnO NPs decreased with increasing temperature due to various particle sizes. Similarly, the absorption spectra of ZnO NPs synthesized using different PVA concentrations were shown in the Figure 7. The peak absorption spectra of ZnO NPs were observed at 372, 377 and 380 nm for PVA concentrations (1.89, 2.27 and 3.34 M) respectively. The energy band gaps of ZnO NPs were decreased as the PVA concentrations increased. The red shift spectra of ZnO NPs as the PVA concentrations increase were in a good agreement with a literature reported by[34].
Emission spectral analysis
Figure 8 a-b shows the emission spectra of ZnO NPs at annealing temperatures of 400 and 500°C. Generally, the emission spectra of ZnO NPs consist of two emission bands: one in the UV-region near 370 - 400 nm and the other broad band in the visible regions 400 - 700 nm. Our samples exhibited UV emission peaks at 396 nm, broad peaks at 413 and 418 nm (violet region) and other peaks at 449, 466, 480 and 490 nm (blue region) respectively. The emission in the UV region is attributed to the recombination between the electrons in the conduction band and holes in the valance band. The violet emission at 417 nm is ascribed to an electron transition from a shallow donor level of neutral Zni to the top level of valance band[35]. The blue emission centered on 450 nm is attributed to singly ionized VZn-. A blue green emission centred at 481 nm is due to radiative transition of electron from the shallow donor level of Zni to an acceptor level of neutral VZn. The green emission which is not recorded in our sample is attributed to radiative transition from conduction band to the edge of the acceptor level of OZn caused by oxygen antisites (OZn)[35]. The peak emission of our samples is independent of the temperature but emission intensity is temperature dependent i.e. it increased as the temperatures of the samples increased.
Figure 8: Emission spectra of synthesized ZnO NPs at a) 400°C b) 500°C.
Conclusion
Zinc oxide nanoparticles were synthesized via sol-gel methods at various temperatures and PVA concentrations. The prepared ZnO NPs were characterized by different spectroscopic techniques. The XRD and SEM images of ZnO NPs indicated increment in the particle size of as annealing temperature and PVA concentration increased. The reduction in the FWHM with increasing temperature has confirmed the improved in crystallinity of the samples. The hexagonal wurtzite structure of ZnO was also confirmed from the diffraction pattern of the samples. From FTIR studies, with increasing annealing temperature, the presence of functional groups impurities was reduced as the particle size increased. The UV-Vis absorption peaks of the samples shifted towards higher wavelength (red shift) as the temperatures and PVA concentration increased. The emission spectra of ZnO NPs showed two peaks in ultra-violet and visible regions. The peak emission of the samples is independent of the temperature but its emission intensity depends on the temperature i.e it increased as the temperatures of the samples increased.
Acknowledgments
The authors would like to acknowledge Adama Science and Technology University and Ministry of Science and Technology of Ethiopia for financial support and National Institute of Technology, Physics Department, Warangal, India for allowing us to use the XRD for characterization of our samples and also Pusan National University, Department of Nanoscience and Nanotechnology, South Korea for allowing us to use SEM.
References
1. Srivasta, V., Gusain, D., Sharma, Y. Synthesis, characterization and application of ZnO nano particles. (2013) J Ceramic int 39(8): 9803-9808.
2. Talam, S., KarumuriS.R., Gunnam, N. Synthesis, Characterization, and Spectroscopic Properties of ZnO Nanoparticles. (2012) nanotech 6.
3. Chey, C.O. Synthesis of Zinc Oxide nanoparticles and transition metals doped ZnO nanostructure, their characteracterization and sensing application. (2015) Linkoping Unversity.
Pubmed|| Crossref|| Others
4. Xu, S., Wang, Z.L. One-dimensional ZnO nanostructures: Solution growth and functional properties. (2011) Nano Res 4(11):1013-1098.
Pubmed|| Crossref|| Others
5. Willander, M., Nur, O., Sadaf, J.R., et al. Luminescence from Zinc Oxide Nanostructures and Polymers and their Hybrid Devices. (2010) Materials 3(4): 2643-2667.
6. Kołodziejczak-Radzimska, A., Jesionowski, T. Zinc Oxide-From Synthesis to Application: A Review. (2014) Materials 7(4): 2833-2881.
7. Wang, Z.L.Splendid one-dimensional nanostructures of zinc oxide: A new nanomaterial family for nanotechnology. (2008) ACS Nano 2(10): 1987-1992.
8. Chaari, M. Matoussi, A. Electrical conduction and dielectric studies of ZnO pellets. (2012) Phys B 407(17): 3441-3447.
9. Umar, A., Hahn, Y.B. ZnO Nanoparticles: Growth, Properties, and Applications, in: Metal Oxide Nanostructures and Their Applications. (2012) Ame Sci Publ.
Pubmed|| Crossref|| Others
10. Podporska-Carroll, J., Myles, A., Quilty, B., et al. Antibacterial properties of F-doped ZnO visible light photocatalyst. (2017) J Hazard Mater 324: 39-47.
11. Chand, P., Gaur, A., Kumar, A., et al. Effect of NaOH molar concentration on optical and ferroelectric properties of ZnO nanostructures.(2015) Appl Surf Sci 356: 438- 446.
12. Jyoti, M., Vijay, D., Radha, S.to study the role temperature and sodium hydroxide concentration in synthesis Zinc Oxide nanoparticles. (2013) IJSRP 3(11): 1-4.
Pubmed|| Crossref|| Others
13. Narayanan, G.N., Ganesh, R.S., Karthigeyan, A.Effect of annealing temperature on structural, optical and electrical properties of hydrothermal assisted zinc oxide nanorods. (2016) Thin Solid Films 598: 39-45.
14. Kumar, S.S., Venkateswarlu, P., Rao, V.R., et al. Synthesis, Characterization and Optical Properties of Zinc Oxide Nanoparticles. (2013)Int Nano Lett 3: 30.
Pubmed|| Crossref|| Others
15. Pholnak, C., Chitnarong, S., Sumetha, S., et al. Effect of NaOH concentration on optical properties of zinc oxide nanoparticles. (2014)Mate Res 17: 405.
Pubmed|| Crossref|| Others
16. Kundu, S. A facile route for the formation of shape-selective ZnO nanoarchitectures with superior photo-catalytic activity. (2014) Colloid Surface A 446: 199-212.
17. Bagabas, A., Alshammari, A., Aboud, M. FA., et al. Room-temperature synthesis of zinc oxide nanoparticles in different media and their application in cyanide photodegradation. (2013) Nanoscale Res. Lett 8: 516.
Pubmed|| Crossref|| Others
18. Wahab, R., Ansari, S.G., Kim, Y.S., Song, M., Shin, H.S.A study on the structure/phase transformation of titanate nanotubes synthesized at various hydrothermal temperatures. (2009) Appl Surf Sci 255: 4891.
Pubmed|| Crossref|| Others
19. Zhang, Y.L., Yang, Y., Zhao, J.H., et al. Preparation of ZnO nanoparticles by a surfactant-assisted complexsol–gel method using zinc nitrate. (2009) J Sol-Gel Sci Technol 51(2): 198-203.
Pubmed|| Crossref|| Others
20. Bera, A., Basak, D.Effect of Surface Capping with Poly (vinylalcohol) on the Photocarrier Relaxation of ZnO Nanowires. (2009) ACS Appl Mat Interfaces 1(9): 2066-2070.
21. Othman, A.A., Osman, M.A., Ibrahim, E.E.M., et al. Sonochemically synthesized ZnO nanosheets and nanorods: Annealing temperature effects on the structure, and optical properties. (2017) Ceramics Int 43(1): 527-533.
22. Ashraft, R., Riaz, A., Kayani, Z.N., et al. Effects of calcinations on properties of ZnO nanoparticles. (2015) Materials Today proceeding 2(10): 5468-5472.
23. Preethi, S., Anitha, A., Arulmozhi, M. A. comparative analysis of the properties of Zinc oxide nanoparticles synthesized by hydrothermal and sol-gel methods. (2016) Indian J Sci Tech 9(4): 1-6.
24. Singh, R.G., Singh, F., Kumar, V., et al. Growth kinetic of ZnOnanocrystallites: structural, optical and photoluminescence properties tuned by thermal, annealing. (2011) Curr Appl Phys 11(3): 624-630.
25. Liu, B., You, Y., Zhang, H., et al. Synthesis of ZnOnano-powders via anovel PVA-assisted freeze-drying process. (2016) RSC AdV (111): 110349-110355.
Pubmed|| Crossref|| Others
26. Hench, L. L.; West, K. J. The Sol-Gel Process. (1990) Chemical Reviews 90(1): 33-72.
27. Kundu, T.K., Karak, N., Barik, P., et al. Optical Properties of Zno Nanoparticles Prepared by Chemical Method Using Poly (Vinyl Alcohol) (PVA) as Capping Agent. (2011) IJSCE 1: 19-24.
Pubmed|| Crossref|| Others
28. Cullity, B.D. Stock, Elementary of X-ray Diffraction. (2001) Cell Mol Biol.
Pubmed|| Crossref|| Others
29. Nehal, A. S., Maged, E. K., Ebtisam, M. I. Synthesis and characterization of ZnO NPs via precipitation methods of annealing temperature on particles size. (2015) nanosci and nanotec 5(4): 82-88.
30. Davood, R. Synthesis and microstructural properties of ZnO NPs prepared by precpitation methods. (2013) Ren Ene 50: 932-937.
31. Alireza, S., Monsen, M., Mansour, G. Pollyvinyl alcohol (polyaniline) zinc oxide nanocomposite; synthesis, characterization and bacterial properties. (2009) J luminesc 3: 78.
Pubmed|| Crossref|| Others
32. Jamdagni, P., Khatri, P.,Rana, I.S. Green synthesis of Zinc oxide nanoparticles using flower extract of Nyctanthes arbor-tristis and their antifungal activity. (2018) JKing Saud University sci 30(2):168-175.
33. Ahmed, M., Abd,E., Sarhan, A.H. Preparation and characterization of ZnO NPs by simple precipitation methods. (2016) Int J sci engtec 4(3): 65.
Pubmed|| Crossref|| Others
34. Wang,Y., Zhang, C., Bi, S., et al. Preparation of zinc oxide nanoparticles using the direct precipation methods in membrane dispersion micro-structured reactor. (2010) powder technology 202(1): 130-136.
35. Mishra, A.K., Srivastava, R.K., Prakash, S.G. ZnO nanoparticles: structural. Optical and photoconductivity characteristics. (2012) J Alloys Com 539: 1-6.


