
A Comparison of Male and Female Saliva and Plasma Osmolality in Response to Mild Dehydration
Patel, S1, Thompson, G.A2* and Runyan, D.A3
Affiliation
- 1Safety and Environmental Compliance Manager, Chicago District, Federal Aviation Administration, Aurora, IL
- 2Postgraduate Program in Prosthetic Dentistry, Marquette University School of Dentistry, Milwaukee, WI
- 3Office of Research Oversight, Veterans Health Administration, Chicago, IL
Corresponding Author
*Corresponding Author: Dr. Geoffrey A. Thompson, D.D.S., M.S, Program Director, Postgraduate Program in Prosthetic Dentistry, Marquette University School of Dentistry, 1801 West Wisconsin Avenue, Milwaukee, WI 53201-1881, Tel: (414)288-8415/ Fax: (414) 288-6516; E-mail: geoffrey.thompson@marquette.edu
Citation
Patel, S., et al. A Comparison of Male and Female Saliva and Plasma Osmolality in Response to Mild Dehydration. (2017) J Environ Health Sci 3(2): 1-7.
Copy rights
© 2017 Patel, S. This is an Open access article distributed under the terms of Creative Commons Attribution 4.0 International License.
Abstract
Purpose: Firstly, to investigate how changes in whole saliva osmolality (Sosm) compares with changes in plasma osmolality (Posm) during mild dehydration as measured by BML; secondly, to determine whether there are differences between male and female responses and finally, to assess whether Sosm and Posm return to pre-exercise levels following ad libitum re-hydration.
Materials and Methods: Thirty-nine healthy volunteers (29 males and 10 females) were dehydrated, resulting in 1.10 - 3.06% body mass loss (BML), by walking on a treadmill for 60 minutes at 40°C and 20% relative humidity. Post-exercise participants were given water ad libitum to drink and post-rehydration samples were collected 30 minutes after the onset of water consumption. Blood and unstimulated whole saliva were collected and analyzed for osmolality pre-exercise, post-exercise and post-rehydration. All data were evaluated for differences between male and female responses.
Results: Saliva osmolalities increased from pre- (73.29 ± 15.42) to post-exercise (102.10 ± 25.28) and by a greater percentage than Posm. Generally, Sosm and Posm returned to pre-exercise levels following rehydration. With dehydration, shifts in Posm and Sosm were in the same direction for males and females but females showed morevariability in the response.
Conclusion: Although neither Posm nor Sosm correlated closely with BML associated with mild dehydration, Sosm demonstrated sufficient measurable differences, especially in males, and shows potential as a dehydration screening biomarker.
Introduction
Dehydration is a potential and significant problem in many work environments. Any level of physical activity leads to the loss of body fluids in all environments and can be cumulative if not replaced, resulting in a dehydrated state[1,2]. In hot environments with an intense work load, even small amounts of dehydration, 2 - 3% body mass loss (BML), can lead to a decrease in physical work capacity and cognitive function, even though there may be no apparent physical signs or symptoms of dehydration[3,4]. Greenleaf reported the beginning of impaired exercise thermoregulation at about 1% BML[5]. Greater hydration deficits may lead to increased risk of heat illnesses, further decreases in physical work capacity and measurable decreases in mental capabilities[1,2]. Extreme dehydration poses a potential life threatening condition[1,6,7]. Frequently during physical activity, a level of dehydration exists prior to a person suffering from severe thirst, and often, insufficient replacement fluids are imbibed to counteract the loss of body fluids[8]. It would be advantageous to be able to detect mild dehydration so preventive steps could be taken to obviate subsequent negative sequelae from unresolved dehydration.
Conversely, unrestricted fluid intake to prevent dehydration has potentially adverse ramifications such as hyponatremia, which may lead to severe complications, including death[9,10]. Therefore, a non-invasive method to determine mild dehydration would allow early intervention or prevention prior to debilitating levels of fluid loss and subsequently prevent over hydration.
Currently, measurement of the hydration status involves either invasive (blood/plasma, total body water), inconvenient (urine, body mass) or complex and often unreliable (bioelectrical impedance analysis)[11-15] techniques which are unsuitable for frequent monitoring during continuous physical activity. Plasma osmolality (Posm), urine osmolality and urine specific gravity are the most frequently used biological markers for measuring hydration. Recently, Walsh introduced the concept of using saliva to determine overall hydration status[16,17].
Whole saliva is an important physiologic fluid that contains locally produced proteins as well as other molecules from the systemic circulation and flows continuously during mild dehydration, making it an easily accessed biological marker[18-21]. The complexity of salivary gland innervations; having both parasympathetic and sympathetic nervous system components; the response to hormone levels; the response of salivary glands to gustatory, emotional, physiologic and physical stimuli and the large degree of both intra and inter variability of both salivary flow rate and composition have often made the use of saliva as a biomarker either very difficult or yielded disappointing results[22]. To be a useful biomarker for hydration, Sosm must correlate with Posm which is a widely-accepted criterion hydration index[16]. In addition, Sosm must be able to identify BML’s equivalent to 2 - 3% body mass since fluid losses in this range have been associated with reduced heat dissipation, cardiovascular function, and exercise performance[16,23]. Studies using a combination of exercise and fluid restriction[24] and exercise in a hot environment[25] show reductions in saliva flow rate were mostly prevented if sufficient water or sports drinks were consumed to offset the water lost. The induced outcome of salivary flow rates and composition in response to changing hydration levels suggests that the neuroendocrine role is minor compared to the hypertonic-hypovolemic responses of the blood[26,27] and saliva[16,17].
Walsh et al. recently published two separate studies[16,17]. Both studies looked at, among other parameters, Sosm in pre-hydrated participants during mild to moderate (≤ 3% BML) dehydration. The first study shows correlation between Sosm and percent BML. Even with a small sample size of 12 males, Walsh could state “it is possible to tentatively determine a range for saliva total protein concentration and osmolality to identify a state of euhydration”[17]. For Sosm, this range was 41 - 61 mOsm/kg. This study demonstrated a statistically significant difference in Sosm between baseline and 1.1%, 2.0% and 2.9% BML. A second study by Walsh shows that saliva osmolality correlates with Uosm and Posm. This study included 15 male volunteers who exercised until a progressive BML of 3.0% was achieved. Post hoc analysis in this study showed that Posm was statistically significantly greater than pre-exercise at 2.1% BML and at 3.0% BML Posm but not at 1.1% BML. Sosm was 50 mOsmol/kg ± 11 at pre-exercise in pre-hydrated participants. This value increased progressively as dehydration was induced. Post hoc analysis revealed that Sosm was greater than pre-exercise at both the 2.1% BML and 3.0% BML but not at the 1.1% BML level. Walsh concluded from this study that a universal euhydration range may not exist and salivary parameters to measure euhydration needs to be determined on an individual basis[16].
To our knowledge, Sosm responses to dehydration have never been measured in menstruating females to determine whether they differ from males. There are conflicting reports as to what occurs with thermoregulation and hemodynamics in females when engaged in exercise in hot environments, regardless of their phase of menstrual cycle[28,29]. It has been documented however, saliva concentrations of progesterone vary between the follicular and luteal phases[19] suggesting menstrual cycle may have an effect of Sosm. To control for menstrual effects on Posm and Sosm following dehydration, all females in this study were in the follicular phase of their menstrual cycle.
The objectives of this study were to: 1) investigate how changes in Sosm compares with changes in Posm during mild dehydration as measured by BML, 2) determine whether there are differences in the response of Posm and Sosm between males and females during mild dehydration and 3) assess if Sosm and Posm return to pre-exercise levels following 30 minutes of ad libitum re-hydration.
Materials and Methods
Participants
Thirty-nine healthy Active Duty US Army and US Navy personnel, 29 males and 10 females, with a mean age 30.38 years ± 5.95 participated in the study. All volunteers were free of systemic and oral disease. Participants completed a health risk assessment questionnaire and physical examination prior to initiating the protocol. All females were menstruating but were not required to be on birth control pills to participate; 4 volunteers reported taking them. All females were required to have a negative pregnancy test and completed the study within 10 days from the onset of menses to insure they were in the follicular phase of their menstrual cycle. All participants signed an informed consent to participate prior to the study and the study was approved by the Walter Reed Army Institute of Research (WRAIR) Human Use Review Committee and National Naval Medical Center Institutional Review Board.
Baseline Measurements
All participants had their nude weight (± 50 grams) (Seca, model 767, Germany) and Sosm measured (Model 210, Fiske, Norwood, MA) for 5 consecutive days between 05:30 AM and 07:00 AM and prior to any physical activity. Upon arrival for the exercise portion of the study at 06:30 AM, a sixth baseline measurement of Sosm and nude weight was obtained.
Experimental procedure
Participants were instructed to follow their normal routine and not to engage in any physical exercise prior to their arrival for the study. Study participants were considered to be euhydrated if their weight was within one SD of their baseline mean body weight.
Once participants were medically cleared to participate in the study and dressed in shorts, T-shirts (with sports bra for females) and running shoes, they were given a light carbohydrate meal consisting of 8 oz. of orange juice and a bagel. Prior to the collection of samples and weighing at each of 3 time points, the participants sat undisturbed upright for 30 minutes to allow for thermal and postural equilibration. Pre-exercise blood and saliva samples and nude weights were collected. The participants entered an environment chamber maintained at 40°C and 20% relative humidity to conduct the exercise regime. To ensure safety, all participants were monitored every 5 minutes for core temperature using a telemetry temperature pill (Mini Mitter, Bend, Oregon), heart rate using an automatic heart rate monitor (Polar S210, Kempele, Finland) and blood pressure (SunTech Medical, Tango Plus, Morrisville, NC). The participants were placed on a treadmill (True S.O.F.T., model ZTX 850P, True Fitness Technology, O’Fallon, MO) and walked at 3.5 mph at a 6-degree incline for 60 minutes.
Following completion of exercise, all participants sat for 30 minutes in a temperate environment prior to collection of blood and saliva samples and nude weights. The post-rehydration samples were collected following an additional 30 minutes of sitting while drinking water ad libitum.
Sample collection and analysis
For collection of unstimulated whole saliva, the participants were seated, head slightly down, asked to swallow to completely clear their mouths and subsequently asked not to swallow or move their tongue or lips during the collection period. Saliva was allowed to accumulate in their mouth for 2 minutes, and asked to spit the accumulated saliva into a 15 ml polypropylene test tube. Blood was collected through a heparin lock catheter. The initial 1 - 2 ml of drawn blood was discarded. Body mass (± 50 grams) was measured on a digital platform scale.
Blood samples were centrifuged at 1500 x g for 10 minutes to separate the plasma. Osmolalities of plasma and saliva were determined via freezing point depression with an osmometer immediately following collection and preparation. Three replicates were accomplished for each sample.
Statistical analysis
All dependent measures were assessed for normality using Kolmogorov-Smirnov, and Shapiro-Wilk procedures[30,31] and indicated that the baseline measures did not significantly depart from normality. However, there appeared to be some departures from normality for some non-baseline measures. Since the parametric tests used in subsequent analyses are robust to moderate violations, for comparison purposes we have used parametric procedures with all the dependent measures in this study.
Mean gender and time differences were assessed using a two-way repeated measures ANOVA with gender and 3 time points (pre-exercise, post-exercise, and rehydration) with Greenhouse- Geisser and the Huynh-Feldt sphericity corrections[32]. Significant F-ratios were followed with 1-tailed repeated-measures t-tests at the alpha 0.05 level with Bonferroni correction. Means are reported with standard deviations (SD). Effect size (ES) was calculated per Cohen[33] for repeated-measures data. The effect size was calculated using the pooled standard deviations[33]. That is, the pooled standard deviation is the square root of the average of the squared standard deviations. Cohen separated ES into 3 categories: 0.2 - small, 0.5 -medium and 0.8 - large. These categories are based on the amount of overlap between the distributions of response variable measurements. The more the overlap between the two treatment group distributions the more difficult it is to discern differences.
Bivariate linear regressions were calculated for changes in Posm and Sosm (Post-exercise – Pre-exercise) relative to BML (dependent variable) with the coefficient of determination (r²) reported.
Results
Baselines
All 39 participants were within one SD of their mean baseline body weight at the beginning of exercise. Female baseline weights averaged 63.77 kg ± 7.81 with a range of 44.13 - 78.63 kg. Male baseline weights averaged 86.40 kg ± 12.65 with a range of 58.33 - 115.21 kg. The female and male baseline weights were statistically different for gender (p < 0.001). Baseline Sosm for females averaged 72.28 mOsmol/kg ± 13.39 with a range of 52.00 - 94.28 mOsmol/kg and for males 81.71 mOsmol/kg ± 17.20 with a range of 60.27 - 115.00 mOsmol/kg. These were statistically significantly different for gender (p < 0.002). Combining all participants, the average Sosm was 79.25 mOsmol/kg ± 20.54.
Euhydration determination
Pre-exercise Posm in females averaged 289.63 mOsmol/kg ± 3.93; males averaged 292.97 mOsmol/kg ± 3.35 and combined averaged 292.12 mOsmol/kg ± 3.75. Using the euhydrated value for Posm as 288 mOsmol/kg ± 4 (26), 19 out of 29 male participants and 1 out of 10 female participants were hypohydrated at the start of exercise. Pre-exercise Sosm in females averaged 66.00 mOsmol/kg ± 17.55; males averaged 75.81 mOsmol/kg ± 14.08 and combined averaged 73.29 mOsmol/kg ± 15.42. Using pre-exercise Posm to stratify euhydrated and hypohydrated males (Posm > 292 mOsmol/kg), there was no statistically significant differences found in %BML (p = 0.212), delta Posm (p = 0.867) and delta Sosm (p = 0.672). Thus, all male participants were grouped together for analyses. The average Sosm for euhydrated males was 72.87 mOsmol/kg ± 12.85 and for hypohydrated males it was 77.35 mOsmol/kg ± 14.79.
Post-exercise BML
Following exercise all participants exhibited BML. Females lost an average of 1.71% ± 0.22 with a range of 1.33 - 1.99% and males 1.60% ± 0.40 with a range of 1.10 - 3.06%. When combined, all participants had a mean BML of 1.63% ± 0.26.
Post-exercise Posm
Posm increased for all females and 23 out of 29 males. Posm increased by 1.4% in females, 0.6% in males and 0.81% for all participants. The r² = 0.01 (or r = 0.1) was not significant and would require well over 100 subjects to become significant. There was a gender by time interaction (p = 0.047), but no overall gender main effect (p = 0.918). There was an overall time main effect with significant differences at all three time points (p < 0.000). Males showed statistically significant differences among all three time points (p < 0.004). Females showed a significant difference between pre- and post-exercise (p = 0.006) and between post-exercise and rehydration (p = 0.001), but not between pre-exercise and rehydration (p = 0.130).
Post-exercise Sosm
Sosm increased in all 39 participants by an average of 56.8% in females, 34.1 % in males and 39.3% in all participants. The r² = 0.16 (or r = 0.4) is statistically significant for n = 39 (p = 0.032, 2-tailed test). There was a gender by time interaction (p = 0.032), but no overall gender main effect (p = 0.259). There was an overall time main effect with significant differences at all three time points (p < 0.000). Both males and females showed statistically significant differences between pre-exercise, post-exercise and rehydration.
Post-rehydration weight changes
Following rehydration, all participants exhibited a gain in weight. Females gained an average of 1.42% ± 0.28 and males 1.20% ± 0.50. When combined, all participants had a mean weight gain of 1.24% ± 0.47.
Post-rehydration Posm and Sosm
Following rehydration 9 of 10 females and 28 of 29 males Posm decreased when compared to post-exercise by an average of 0.60% and 1.40% mOsmol/kg respectively. Posm decreased following rehydration when compared to pre-exercise in 8 of 10 females and 28 of 29 males by an average of 1.00% and 2.00% mOsmol/kg respectively. Following rehydration all female and male Sosm decreased from post-exercise by an average of 44.45% and 40.27% mOsmol/kg respectively. When comparing rehydration to pre-exercise, 7 of 10 females and 27 of 29 males had lowered Sosm by an average of 12.00% and 19.8% mOsmol/kg respectively.
Comparisons
BML vs. Sosm and Posm: Coefficients of determination among BML and change in Posm and change in Sosm accounted for 0% and 7% of the percent BML, respectively, for all subjects combined; neither reached statistical significance. Male Sosm (r² = 0.16; p < 0.05) was a better predictor than Posm (r² = 0.01; p > 0.05). Females were the opposite, Posm (r² = 0.08) was a better predictor than Sosm (r² = 0.00); however, for females neither relationship was statistically significant and likely due to the small sample size.
Sosm vs. Posm: The correlation between change in Sosm and change in Posm (pre-exercise to post-exercise) for all participants was significant (p = 0.005) with change in Sosm accounting for 17% of the change in Posm (Figure 1). This correlation in males was significant (p = 0.003), with the change in Sosm accounting for 29% of the variation in change in Posm (Figure 2), however in females the correlation was not significant (p = 0.461) (Figure 3). The female subgroup had fewer significant correlations, as would be expected from a smaller sample size.
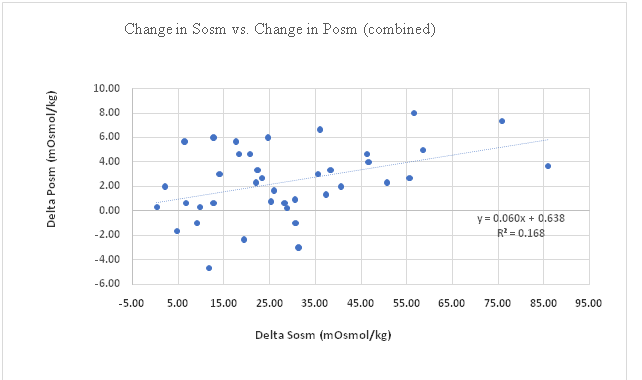
Figure 1: Change in Sosm vs. Change in Posu (combined).
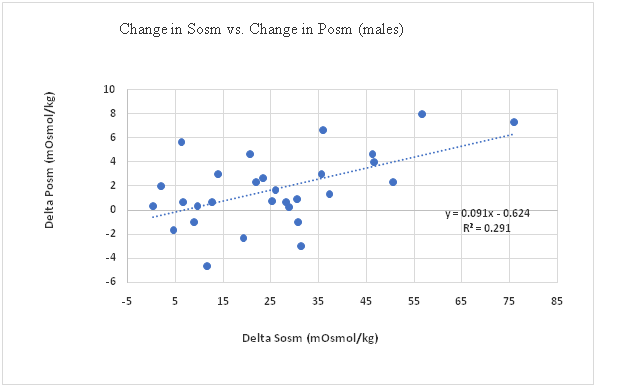
Figure 2: Change in Sosm vs. Change in Posm (males).
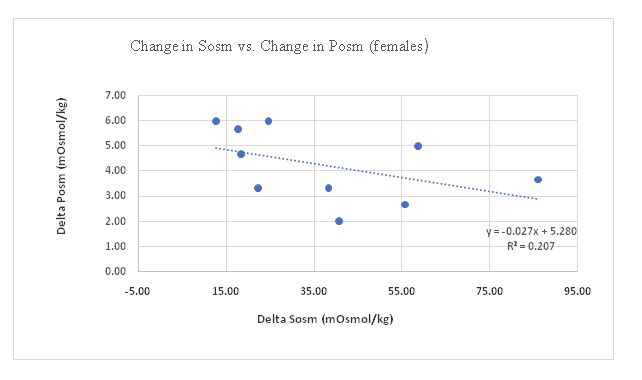
Figure 3: Change in Sosm vs. Change in Posm (Females).
Discussion
This study found that using mean body weight to establish euhydration in free living participants, especially males, was not predictable and corresponds with a previous study[34]. Although all participants were within one SD of their mean body weight calculated during the previous 5 days, 51% of the participants had pre-exercise Posm values indicating they were hypohydrated. Males were more frequently hypohydrated than females, 65% and 10% respectively. Considering that participants were Soldiers and Sailors with a high degree of physical activity, it is not surprising to find many participants were hypohydrated. The causes for the discrepancy between males and females who were hypohydrated at pre-exercise was beyond the scope of this study and so it was not investigated.
A primary objective of this study was to determine how changes in Sosm compared with changes in Posm during mild dehydration. There was a statistically significant difference between pre-exercise and post-exercise Posm and Sosm values. Sosm increased in 100% of participants during dehydration whereas Posm decreased in 6 out of 39 participants. The relative increase in Sosm (39.3%) was higher than Posm (0.8%), however, Sosm was accompanied by larger variability.
While the ES depends on many factors, its use as a comparative index is critical in relating research results to other studies. Thomas et al[35] provide a useful perspective, pointing out that a convention for interpreting ES as “small” (0.20), “medium” (0.50), and “large” (0.80) has been proposed by Cohen[33]. In another study by Thomas et al., it was shown that many studies in exercise literature (27% in their sample) had low power with an average ES of 0.24 and little chance of reliably detecting differences[36]. In physiology, ES ranges from 0.34 to 0.91[35]. By comparison, all ES’s in the current study were considerably higher, ranging from 1.02 to 2.41 (Tables 1-3). The ES for change in Sosm (males), representing a BML of 1.6% was 2.61 (Table 2) and is consistent with ES’s extrapolated from Walsh et al. (3.43 and 2.23)[16,17].
Table 1: Means, % Change and effect sizes(ES), (combined).
| Comparison | Mean ± SD | %Change | ES (Cohen’s d) |
|---|---|---|---|
| PostExPosm | 294.49 ± 4.49 | 0.81 | 1.26 |
| PostExSosm | 102.10 ± 25.28 | 39.31 | 2.41 |
| PostRehPosm | 287.08 ± 5.19 | -1.72 | 2.29 |
| PostRehSosm | 60.35 ± 13.05 | -17.66 | 1.42 |
| PostEXBML | 1.31 ± 0.32 | -1.63 |
Comparisons are to the pre-exercise or baseline values.
Table 2: Means, % Change and effect size (ES), (males).
| Comparison | Mean ± SD | %Change | ES (Cohen’s d) |
|---|---|---|---|
| PostExPosm | 294.17 ± 4.15 | 0.60 | 1.04 |
| PostExSosm | 97.05 ± 21.60 | 34.20 | 2.61 |
| PostRehPosm | 286.42 ± 4.81 | -2.00 | 3.08 |
| PostRehSosm | 57.97 ± 11.7 | -19.8 | 1.48 |
| PostEXBML | 1.37 ± 0.31 | -1.60 |
Comparisons are to the pre-exercise or baseline values.
Table 3: Means, % Change and effect size (ES), (females).
| Comparison | Mean ± SD | %Change | ES (Cohen’s d) |
|---|---|---|---|
| PostExPosm | 294.73 ± 5.32 | 1.40 | 2.25 |
| PostExSosm | 114.33 ± 31.83 | 58.40 | 2.73 |
| PostRehPosm | 287.87 ± 5.47 | -1.00 | 1.16 |
| PostRehSosm | 63.51 ± 11.98 | -12.00 | 2.30 |
| PostEXBML | 1.08 ± 0.28 | -1.71 |
Comparisons are to the pre-exercise or baseline values.
The ES for change in Posm, 1.26 for all participants, 1.04 for males, and 2.25 for females were also large. The ES for females, 2.25, means there is only about a 15% overlap between the pre-exercise and post-exercise distributions.
The ES for change in Sosm; 2.41 for all participants, 2.61 for males, and 2.73 for females are large. The ES of 2.41 for all participants means there is less than 13% overlap for the pre-exercise and post-exercise Sosm distributions. The large ES demonstrated by Sosm suggests it may be a useful biomarker to screen for dehydration once a euhydration range is established. Ely et al[37] showed that salivary osmolality and plasma osmolality were consistent with changes in body mass or total body weight during a hypohydration exercise. However, following hypohydration and an oral rinse with water, Sosm was easily confounded and appeared to return to a euhydrated level. Fifteen minutes following the oral rinse, Sosm returned to an elevated level indicating a true state. Despite returning to a true state after a short interval, it was concluded that Sosm is of limited value for determining hydration status when fluids are consumed regularly. Although a mouth rinse was not used in this study, current results correspond with Ely et al. It was found that for the Sosm relationship, the r² = 0.16 (or r = 0.4) is statistically significant for n = 39 (p = 0.032 2-tailed test). However, for the Posm relationship, the r² = 0.01 (or r = 0.1) was not. This lends credence to the conclusion that Sosm is a potential and valid predictor of dehydration among males.
A limitation in the current study is that BML was limited resulting in a restriction of the range for optimized correlation assessments. Sequent research should extend the range of dehydration to adequately replicate the findings of Walsh et al[16,17] for males and extend them to females.
The second objective of this study was to determine whether there are differences in the response of Posm and Sosm between males and females during mild dehydration. During the follicular phase of the menstrual cycle (the first 10 days following the onset of menses), there were noticeable differences. Using body weight measurements to establish euhydration; values for Sosm and Posm showed females were consistently better hydrated than males during baseline and pre-exercise measurements. Females exhibited greater increases in both Sosm and Posm following exercise indicating they became more dehydrated following the same exercise regime as males.
When the change in Posm was compared to the change in Sosm, the relationship is more pronounced in males than in females (Figures 1- 3). Generally, as Posm increases during dehydration, Sosm increases as well (Figure 1). In participants in which Posm decreased during dehydration, Sosm continued to trend upward. Blood has the capacity to tap extracellular sources of body water during the initial stages of dehydration in order to maintain its osmolality. One of these sources is the salivary glands, and during times of hypertonic-hypovolemia, shifts in sodium gradients in the salivary glands results in concentration of saliva and an increase in osmolality. This capacity varied between individuals. This study did not answer why there was a negative slope in females (Figure 3).
Overall, females were better hydrated prior to exercise but became more dehydrated as demonstrated by BML, Posm and Sosm measures. This suggests that monitoring hydration status, during the early stage of dehydration, may be more important in females than males.
The final objective was to determine whether Sosm responded to water intake as well as Posm. All participants exhibited a lower Posm and Sosm following rehydration when compared to post-exercise. Only 2 females and 2 males had Posm that remained above 292 mOsmol/kg. Both Sosm and Posm reflected a reversal of dehydration within 30 minutes of water consumption.
Conclusion
In conclusion, at the levels of dehydration achieved in this study, neither Posm nor Sosm demonstrated a large correlation to BML. Sosm correlated better than Posm but had greater variability. The ES of Sosm indicates further research using saliva as a hydration biomarker is warranted.
Disclaimer
The opinions or assertions contained herein are the private views of the authors, and are not to be construed as official, or as reflecting true views of the Department of the Army or the Department of Defense.
References
- 1. Nunneley, S., Reardon, M. Prevention of Heat Illness. In Medical Aspects of Harsh Environments. Edited by KB Pandoff, RE Burr. (2002) Walter Reed Army Medical Center Borden Institute 1(6): 209-230.
Pubmed || Crossref || Others - 2. Shirreffs, S., Armstrong, L., Cheuvront, S. Fluid and electrolyte needs for preparation and recovery from training and competition. (2004) J Sports Sci 22(1): 57-63.
Pubmed || Crossref || Others - 3. Armstrong, L., Herrera Soto, J., Hacker, Jr. F., et al. Urinary indices during dehydration, exercise, and rehydration. (1998) Int J Sport Nutr 8(4): 345-355.
Pubmed || Crossref || Others - 4. Shirreffs, S.M., Maughan, R.J. Rehydration and recovery of fluid balance after exercise. (2000) Exerc Sport Sci Rev 28(1): 27-32.
Pubmed || Crossref || Others - 5. Greenleaf, J.E. Problem: thirst, drinking behavior, and involuntary dehydration. (1992) Med Sci Sports Exerc 24(6): 645-656.
Pubmed || Crossref || Others - 6. Armstrong, L., Maresh, C., Gabaree, C., et al. Thermal and circulatory responses during exercise: effects of hypohydration, dehydration, and water intake. (1997) J Appl Physiol 82(6): 2028-2035.
Pubmed || Crossref || Others - 7. Montain, S., Sawka, M., Latzka, W., et al. Thermal and cardiovascular strain from hypohydration: influence of exercise intensity. (1998) Int J Sports Med 19(2): 87-91.
Pubmed || Crossref || Others - 8. Maresh, C., Gabaree-Boulant, C., Armstrong, L., et al. Effect of hydration status on thirst, drinking, and related hormonal responses during low intensity exercise in the heat. (2004) J Appl Physiol 97(1): 39-44.
Pubmed || Crossref || Others - 9. Gardner, J.W. Death by water intoxication. (2002) Mil Med 167(5): 432-434.
Pubmed || Crossref || Others - 10. Garigan, T. Death from hyponatremia as a result of acute water intoxification in an Army basic trainee. (1999) Mil Med 164(3): 234-238.
Pubmed || Crossref || Others - 11. Armstrong, L., Maresh, C., Castellani, J., et al. Urinary indices of hydration status. (1994) Int J Sport Nutr 4(3): 265-279.
Pubmed || Crossref || Others - 12. Francesconi, R., Hubbard, R., Szlyk, P., et al. Urinary and hematologic indexes of hypohydration. (1987) J Appl Physiol 62(3): 1271-1276.
Pubmed || Crossref || Others - 13. Grant, M., Kubo, W. Assessing a patient’s hydration status. (1975) Am J Nurs 75(8): 1306-1311.
Pubmed || Crossref || Others - 14. Kavouras, S. Assessing hydration status. (2002) Curr Opin Clin Nutr Metab Care 5(5): 519-524.
Pubmed || Crossref || Others - 15. Kovacs, E., Senden, J., Brouns, F. Urine color, osmolality and specific electrical conductance are not accurate measures of hydration status during postexercise rehydration. (1999) J Sports Med Phys Fitness 39(1): 47-53.
Pubmed || Crossref || Others - 16. Walsh, N., Laing, S., Oliver, S., et al. Saliva parameters as potential indices of hydration status during acute dehydration. (2004) Med Sci Sports Exerc 36(9): 1535-1542.
Pubmed || Crossref || Others - 17. Walsh, N., Montague, J., Callow, N., et al. Saliva flow rate, total protein concentration and osmolality as potential markers of whole body hydration status during progressive acute dehydration in humans. (2004) Arch Oral Biol 49(2): 149-154.
Pubmed || Crossref || Others - 18. Burgen, A., Emmelin, N. Physiology of the Salivary Glands, edited by H Barcroft, H Davson, and W Paton. (1961) Baltimore, Maryland, The Williams and Wilkins Company.
Pubmed || Crossref || Others - 19. Hofman, L.F. Human saliva as a diagnostic specimen. (2001) J Nutr 131(5):1621S-1625S.
Pubmed || Crossref || Others - 20. Jenkins, G. The Physiology and Biochemistry of the Mouth. (1979) J Dent 7(3): 258–259.
Pubmed || Crossref || Others - 21. Schneyer, L., Young, J., Schneyer, C. Salivary secretion of electrolytes. (1972) Physiol Rev 52(3): 720-777.
Pubmed || Crossref || Others - 22. Mandel, I.D. Salivary diagnosis: promises, promises. (1993) Ann N Y Acad Sci 694: 1-10.
Pubmed || Crossref || Others - 23. Shirreffs, S. Markers of hydration status. (2000) J Sports Med Phys Fitness 40(1): 80-84.
Pubmed || Crossref || Others - 24. Bishop, N., Blannin, A., Armstrong, E., et al. Carbohydrate and fluid intake affect the saliva flow rate and IgA response to cycling. (2000) Med Sci Sports Exec 32(12): 2046-2051.
Pubmed || Crossref || Others - 25. Horswill, C., Stofan, J., Horn, M., et al. Effect of exercise and fluid consumption on salivary flow and pH. (2006) Int J Sports Med 27(6): 500-504.
Pubmed || Crossref || Others - 26. Popowski, L., Opplinger, R., Lambert, G., et al. Blood and urinary measures of hydration status during progressive acute dehydration. (2001) Med Sci Sports Exerc 33(5): 747-753.
Pubmed || Crossref || Others - 27. Sawka, M.N., Young, A., Francesconi, R., et al. Thermoregulatory and blood responses during exercise at graded hypohydration levels. (1985) J Appl Physiol 59(5): 1394-1401.
Pubmed || Crossref || Others - 28. Kenney, W.L. A review of comparative responses of men and women to heat stress. (1985) Environ Res 37(1): 1-11.
Pubmed || Crossref || Others - 29. Stephenson, L., Kolka, M. Effects of gender, circadian period and sleep loss on thermal responses during exercise. In: Human Performance Physiology and Environmental Medicine at Terrestrial Extremes, edited by K Pandolf, M Sawka, and R Gonzalez. (2001) Traverse City, MI: Cooper Publishing Group: 267-304.
Pubmed || Crossref || Others - 30. Ostle, B., Malone, L. Statistics in Research: Basic Concepts and Techniques for Research Workers. (1988) Ames, Iowa, Iowa State University Press.
Pubmed || Crossref || Others - 31. SPSS. SPSS [Computer Software]. (2006) Chicago: SPSS Inc. SPSS.
Pubmed || Crossref || Others - 32. Weinfurt, K. Repeated measures analyses: ANOVA, MANOVA, and HLM. In: Reading and Understanding More Multivariate Statistics, edited by Grimm L, and Yarnold P. (2000) Washington D.C.: American Psychological Association 329-330.
Pubmed || Crossref || Others - 33. Cohen, J. Statistical Power Analysis for the Behavioral Sciences. (1988) Hillsdale, New Jersey Lawrence Erlbaum Associates.
Pubmed || Crossref || Others - 34. Cheuvront, S., Carter, R., Montain, S., et al. Daily body mass variability and stability in active men undergoing exercise-heat stress. (2004) Int J Sport Nutr Exerc Metab 14(5): 532-540.
Pubmed || Crossref || Others - 35. Thomas, J., Lochbaum, M., Landers, D., et al. Planning significant and meaningful research in exercise science; estimating sample size. (1997) Res Q Exerc Sport 68(1): 33-43.
Pubmed || Crossref || Others - 36. Thomas, J., Salazar, W. What is missing in p is less than .05? Effect size. (1991) Res Q Exerc Sport 62(3) 344-348.
Pubmed || Crossref || Others - 37. Ely, B.R., Cheuvront, S.N., Kenefick, R.W., et al. Limitations of salivary osmolality as a marker of hydration status. (2011) Med Sci Sports Exerc 43(6): 1080-1084.
Pubmed || Crossref || Others


