
Acromio-Axillo-Suprasternal Notch Index: A New Screening Test to Predict Difficult Laryngoscopy in General Population
Mohammadreza Safavi1, Azim Honarmand1*, Anahita Hirmanpour1, Qazal sheikhani1, Habib Jalali1
Affiliation
- 1Department of Anesthesiology and Critical Care Research Center, Isfahan University of Medical Sciences, Isfahan, Iran
Corresponding Author
Azim Honarmand, Professor, Department of Anesthesiology and Critical Care Research Center, Isfahan University of Medical Sciences, Isfahan, Iran, Tel:0989133136286; E-mail: honarmand@med.mui.ac.ir
Citation
Honarmand, A., et al. Acromio-Axillo-Suprasternal Notch Index: A New Screening Test to Predict Difficult Laryngoscopy in General Population. (2016) J Anesth Surg 3(2): 142-147.
Copy rights
© 2016 Honarmand, A. This is an Open access article distributed under the terms of Creative Commons Attribution 4.0 International License
Keywords
AASI; NC; TMD; DVL; Laryngoscopy; RHTMD
Abstract
Background: Airway management expertness is essential in every medical specialty. Inability to manage Difficult Visualization of Larynx (DVL) can be life threatening. This trail was performed to assess the ability of a new index - Acromio-axillo-suprasternal notch index- to predict difficult laryngoscopy in normal population in comparison with the other common predictors.
Materials and Methods: 728 consecutive patients with ASA class I & II candidate for general anesthesia with endotracheal intubation were enrolled to this study. The four usual tests MMT, ULBT, RHTMD, NC/TMD were assessed before induction of anesthesia. The new AASI test is calculated as follow: 1) Using a ruler a line is drawn vertically from the top of the acromion process to the superior border of the axilla at the pectoralis major muscle named as line A. 2) A second line is drawn perpendicular to line A from the suprasternal notch (line B); and 3)That portion of line A that lies above where line B bisects line A is line C. AASI is calculated from the length of line C divided by line A(AASI = C/A). By a skilled anesthesiologist who blinded to the assessment, the laryngoscopy was done and based on Cormack-Lehane classification, garding of laryngoscopy was recorded. Sensitivity, specificity, positive predictive value and AUC or ROC for each airway predictor in isolation and comparison with each other was established.
Results: The sensitivity of AASI was 66.67% with AUC = 0.790(P = 0.000). But MMT as an old predictive test with NC/TMD and RHTMD with AUC or ROC curve 0.626, 0.531, 0.537 respectively, are not good predictors in this study (P > 0.05). But ULBT with sensitivity 52.38% can be a good predictor (P = 0.003). There are stepwise increases in the incidence of Cormack-Lehane grade III and IV as AASI was greater than 0.6.
Conclusion: We considered the value of preoperative assessment of AASI ≥ 0.6 to be a good and reliable predictor for difficult visualization of larynx
Introduction
Endotracheal intubation is an essential part of general anesthesia[1]. Pre-operative prediction of difficult laryngoscopy has the main role in airway management as 85% of all inabilities to maintain airway result in permanent cerebral damage and up to 30% result in death[2,3]. Difficult laryngeal view is defined as poor vision for glottis during laryngoscopy[4]. Incidence of difficult endotracheal intubation is about 1.5 - 20 %[5,6]. Prediction of difficult endotracheal intubation is still a challenge for anesthesiologists. Identifying and prediction of situations and patients prone to airway problem is a key for suitable care and have been focus in too many publications[5-8].
Recently Kamranmanesh and colleagues[9] have been represented a new method as Acromio - Axillo- Suprasternal notch Index (AASI) with higher predictive value than Mallampati Test and can be recruited for prediction of difficult visualization of larynx with sensitivity of 78.9% and specificity of 89.4% (Figure 1).
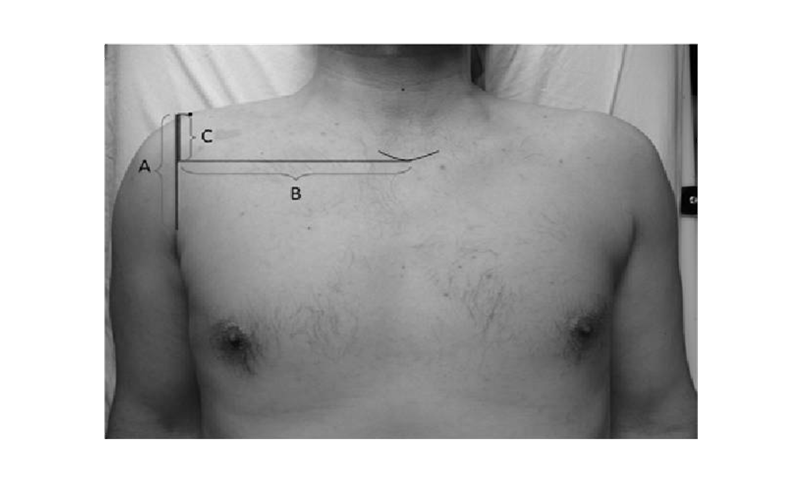
Figure 1: The method of measurement of acromio-axillo-suprasternal notch index (AASI). AASI was defined as ratio of line C to the line A. A = The line was drawn from acromion to the upper axillary fold parallel to the longitudinal axis of body; B = The line was drawn perpendicular to the line A as passing from the lower part of suprasternal notch; C = The part of line A which located above the intersection line A with line B.
Moreover, there are different tests to predict Difficult Laryngoscopic View (DVL). Thyromental Distance (TMD) is now under question to be either sensitive or specific enough to recruit as a single predictor and is independent predictor of DVL[10].
Khan et al[11] showed the Upper Lip Bite Test (ULBT) with negative predictive value of 98.3%, is a reliable test for prediction of DVL. Modified Mallampati Classification by opening of mouth revised by Samsoon and Young, was neither sensitive nor specific enough as a single predictor[12].
The Ratio of Height to Thyromental Distance (RHTMD) in Schmitt et al study had more reliable predictive value than TMD[13-15].
Kim et al[16,17] demonstrated the Ratio of Neck Circumference to Thyromental Distance (NC/TMD) was a superior indicator for difficult visualization in larynx in obese patients and Hirmanpour et al substantiated it in parturient patients too.
To lessen the risk of difficult laryngoscopy and intubation, every anesthesiologist should have the influence to use good predictive methods of DVL.
Therefore, we designed this prospective, blind study of predictive value of AASI opposed to six other methods and developed the predictors in assessment of the airway for difficult laryngoscopy and intubation.
Materials and Methods
After approval from our local Ethics Committee, all patients were written Inform Consent. A total number of 728 patients, American Society of Anesthesiology (ASA)[18] physical status I & II scheduled for surgery under general anesthesia with endotracheal intubation were enrolled to this prospective observational study at Kashani University Hospital of Isfahan. Patients with airway malformation, pathology on the cervical and facial region, restriction in motility of neck or mandible and requiring awake intubation were not enrolled to the study. A questionnaire filled for each patient before anesthesia which contains age, weight, height, BMI. A skilled anesthesiologist with at least five-year experience in anesthesia, who was blinded to the predictors measured and recorded, carried out laryngoscopy and evaluated the difficulty in laryngeal view.
The dimensional six predictive test measurements were accomplished on all patients:
1- AASI: a) A line was drawn vertically from the top of the acromion process to the superior border of the axilla at the pectoralis major muscle named as line A.
b) The second line was drawn perpendicular to line A from the suprasternal notch named as line B.
c) Line C was defined as the portion of line A that was laid above where line B bisects line A. AASI was calculated as the ratio of c to A (C/A)[9] (Figure 1).
2- RHTMD: Thyromental distance was measured from the bony point of the mentum while the head was fully extended with close mouth. Then the ratio of height to TMD was calculated[13,14]
3- NC/TMD: The neck was measured at the level of cricoid cartilage and thyromental distance was measured from the bony point of the mentum while the head was fully extended with close mouth. The ratio was calculated.[16,17]
4- ULBT: ULBT was introduced as follows: Class I: The lower incisors can bite the upper lip above the vermilion line; Class II: Lower incisors could bite the upper lip below the vermilion line; Class III: Lower incisors could not bite the upper lip.[11]
5- MMT: Modified Mallampati classification as described by Samsoon and Young. Classes are differentiated on the basis of the structures visualized: class I:soft palate, fauces, uvula, tonsillar pillars; class II: soft palate, fauces, uvula; class III: soft palate, base of the uvula; class IV: soft palate not visible.[12,13]
After each patient’s arrival to the operating theatre, all were monitored routinely for electrocardiography, non invasive blood pressure and pulse-oximetry. After preoxygenation for 5 minutes with 100% oxygen, general anesthesia was induced by fentanyl 2μg/kg, sodium thiopental (5 mg/kg) and atracurium (0.6 mg/kg). After 90 seconds and bag and mask ventilation with oxygen, a 5-year experienced anesthesiologist blinded to the study was intubated the patients in sniffing position. A size three Macintosh blade of laryngoscope was used for the first attempt in each patient.
The laryngoscopic view graded with Cormack-Lehane (CL) grading system which contains four grade as described: I: Vocal cords visible, II: Only posterior commissure or arytenoids visible, III: Only epiglottis visible, IV: None of the foregoing visible[19].
Difficult visualization of the larynx (DVL) was defined as CL III or IV views on direct laryngoscopy and easy visualization of the larynx (EVL) was defined as CL I or II view on direct laryngoscopy.[20]
Patient data were presented as mean ± SD and value of the airway predictors were compared using t-tests for continuous variables and U-test for MMT or ULBT. Sensitivity, specificity, and Positive predictive value PPV were obtained and compared list of these measures is provided in the “Appendix” together with a short description and instructions on how to perform the calculations. The AUC was used as the main end-point of the study to decide whether the score was clinically useful. An ROC plot was obtained by calculating the sensitivity (true-positive fraction) and specificity (true-negative fraction) of every observed data value (cut-off value), and plotting sensitivity against 1-specificity (false-positive fraction). A value of 0.5 under the ROC curve indicated that the variable performs no better than chance and a value of 1.0 indicates perfect discrimination. A larger area under the ROC curve represents more reliability and good discrimination of the scoring system. Differences between the AUC values of all predictive tests were calculated, and a P value of 0.05 was defined as statistically significant amongst predictors[21]
Differences between the AUC values of six predictor tests were analyzed using MedCalc statistical software 9.3.6.0. The data were analyzed using SPSS version 20 (SPSS, Chicago, IL).
Results
A total number of 728 patients [205(28.2%) female and 523(71.8%) male] were enrolled to this study. None of them were excluded. Five cases had grade IV CL who were intubated with video laryngoscopy. Table 1 revealed the demographic data of participants including age, height, weight and BMI. There are no statistically differences between these parameters. The distribution of ASA, ULBT, MMT and grading of CL are presented in Table 2.
Table 1: Patients characteristics
| Variables | EVL (n = 584) | DVL (n = 132) | P value |
|---|---|---|---|
| Age (years) | 35.6 ± 16.2 | 38.8 ± 14.5 | 0.373 |
| Weight (kg) | 71.7 ± 12.8 | 74.48 ± 19.3 | 0.340 |
| Height (cm) | 168.6 ± 11.4 | 167.9 ± 9 | 0.772 |
| BMI (kg/m²) | 25.2 ± 5.3 | 26.3 ± 6.5 | 0.334 |
EVL: Easy visualization of larynx, DVL: Difficult visualization of larynx, BMI: Body mass index, Data are presented as mean ± SD.
Table 2:
| Variable | Number (%) |
|---|---|
| ASA | |
| I | 608(83.5) |
| II | 120(16.5) |
| Sex | |
| Male | 523(71.8) |
| FeMale | 205(28.2) |
| Mallampati Class | |
| I | 621 (85.3) |
| II | 99 (13.6) |
| III | 5 (0.7) |
| IV | 3(0.4) |
| ULBT | |
| I | 618 (84.9) |
| II | 105 (14.4) |
| III | 5 (0.7) |
| Laryngoscopic view | |
| I | 613 (84.2) |
| II | 94 (12.9) |
| III | 16 (2.2) |
| IV | 5(0.7) |
ASA: American Society of Anesthesiology; ULBT: Upper Lip Bite Test
Table 3 demonstrated the statistical difference between EVL and DVL for each predictor.
Table 3: The statistical difference between DVL and EVL groups for each predictor
| Variables | DVL (n = 132) | EVL (n = 584) | P value |
|---|---|---|---|
| AASI | 0.5 ± 0.06 | 0.6 ± 0.7 | 0.000 |
| TMD | 8.8 ± 4 | 8.7 ± 1.1 | 0.737 |
| RHTMD | 20 ± 6.4 | 19.5 ± 2.7 | 0.969 |
| NC (cm) | 38.3 ± 3.5 | 39.4 ± 4.8 | 0.081 |
| NC/TMD | 4.5 ± 1.5 | 4.6 ± 0.8 | 0.654 |
Data is presented as mean ± SD. DVL: Difficult visualization of laryngoscopy; EVL: Easy visualization of laryngoscopy; AASI: Acromio-axillo-suprasternal notch index; TMD: Thyromental distance ratio; RHTMD: Ratio of height to thyromental; NC: Neck circumference; NC/TMD: Neck circumference to thyromental distance
AASI has the highest ROC with significant difference to other prediction tests. (Table 4) and also has the highest sensitivity among the other test for prediction of difficult laryngeal view and ULBT with sensitivity of 52.38 was a reliable predictor in this population(P < 0.05) and RHTMD has the least sensitivity.
Table 1: Predictive value for MMT, ULBT, RHTMD, NC/TMD, NC and AASI to predict the incidence of DVL according to the Cormack- Lehane Classification
| Test | Sensitivity | 95%CI | Specifisity | 95% CI | +LR | -LR | PPV (%) | NPV (%) | AUC of ROC curve |
P value |
|---|---|---|---|---|---|---|---|---|---|---|
| MMT | 47.62 | 25.7 - 70.2 | 79.49 | 76.3 - 82.4 | 2.32 | 0.66 | 6.5 | 98 | 0.626 | 0.056 |
| UBLT | 52.38 | 29.8 - 74.3 | 85.98 | 83.2 - 88.5 | 3.74 | 0.55 | 10 | 98.4 | 0.096 | 0.003 |
| RHTMD | 38.10 | 18.2 - 61.5 | 77.34 | 74.1 - 80.4 | 1.68 | 0.80 | 4.8 | 97.7 | 0.537 | 0.549 |
| NC/TMD | 42.86 | 21.9 - 66 | 74.93 | 71.6 - 76.1 | 1.71 | 0.76 | 4.8 | 97.8 | 0.531 | 0.630 |
| NC | 23.81 | 8.3 - 47.2 | 95.33 | 93.5 - 96.8 | 5.10 | 0.80 | 13.2 | 97.7 | 0.563 | 0.338 |
| AASI | 66.67 | 43 - 85.4 | 98.44 | 97.2 - 99.2 | 42.85 | 0.34 | 56 | 99 | 0.790 | 0.001 |
MMT: Modified Mallampati Test, ULBT: Upper lip bite test, RHTMD: Ratio of height to thyromental distance, NC/TMD: Ratio of neck circumferences to thyromental distance, HMDe: hyomental distance in head fully extended with closed mouth, HMDn: hyomental distance in neutral position, HMDR: hyomental distance ratio, AASI: Acromio-axillo-suprasternal notch index, CI: Confidence Interval, AUC: Area under curve, ROC: Receiver- operating characteristic curve.
Discussion
Difficult laryngoscopy and intubation, if not properly handled, is a major factor to be related to the mortality and morbidity related to the anesthesia with irreparable sequels.
Our study showed that the incidence of DVL in about 2.9% which comparable with previous studies[17,23-25]. Merah et al[10] and Honarmand et al[26] represented the incidence of DVL 10% and 8.6% respectively. This difference can be due to differences in anthropometric features, head position, degree of muscle relaxation, cricoids pressure application.
MMT in an ancient and the most widely used method as a prediction test for difficult laryngoscopy, but Londstrom et al[12] showed MMT is inadequate as a single predictor test and in this study we demonstrated the MMT cannot be a predictable predictor. ULBT, in this study, was as a good bedside test in predicting DVL, nevertheless of few cases with ULBT grade III (0.7% in our study)[11].
The accuracy of NC and NC/TMD for prediction of DVL documented by Gonzalez et al, Kim et al and Hirmanpour et al[16,17,23]. In the present study it was found that NC and NC/TMD had not significant power to predict difficult laryngoscopy. The presumptive explanation is the patients with DVL are not too obese (BMI = 26.3 ± 6.5), so in this study group NC and the dependent predictors are not helpful to prospect the DVL.
The RHTMD[13,14,26] in this trail was not a good predictor for DVL. In this population there was not significant differences in height and TMD separately, so it’s obvious that the RHTMD nevertheless was presented as a predictor for difficult intubation, cannot be useful here.
Our study showed that the AASI was more accurate predictor of difficult laryngoscopy in comparison with the other tests. In Kamranmanesh et al[9] study, AASI had the higher predictive value in comparison with MMT in with cut off point of less than 0.5. In the present study, we found that AASI with cut off point ≤ 0.6 could be the most powerful and reliable predictive test for prediction of difficult laryngoscopy.
Also our study represent that the AASI had the highest specificity, positive likelihood ratio, PPV and NPV in comparison with the other predictive tests. The AASI on its own is not dependent to patient position and it shows the intra-thoracic indexes. Advantages of AASI are the use of an inexpensive and easy applicable instrument for this measurement.
Nevertheless, our results are not applicable to all population such as obstetrics, infants and morbid obese patients.
Conclusion
Thus we considered the value of preoperative assessment of AASI ≥ 0.6 to be a good and reliable predictor for difficult visualization of larynx.
Abbreviations: AASI: Axillo-Suprasternal Notch Index; DVL: Difficult Visualization of Larynx; NC: Neck circumference; NC/ TMD: Ratio of Neck Circumferences to Thyromental distance; RHTMD: The Ratio of Height to Thyromental Distance; ULBT:Upper Lip Bite Test; MMT: Modified Mallampati Test; DVL: Difficult Laryngoscopic View
APPENDIX
Statistical Terms and Definitions
• True positive: A difficult laryngoscopy that had been predicted to be difficult (A)
• False positive: An easy laryngoscopy that had been predicted to be difficult (B)
• True negative: An easy laryngoscopy that had been predicted to be easy (D)
• False negative: A difficult laryngoscopy that had been predicted to be easy (C)
• Sensitivity: The percentage of correctly predicted difficult laryngoscopies as a proportion of all laryngoscopies that were truly difficult (A/(A + C))
• Specificity: The percentage of correctly predicted easy laryngoscopies as a proportion of all laryngoscopies that were truly easy (D/(B + D)
• Positive predictive value: The percentage of correctly predicted difficult laryngoscopies as a proportion of all predicted difficult laryngoscopies (A/(A + B))
• Negative predictive value: The percentage of correctly predicted easy laryngoscopies as a proportion of all predicted easy laryngoscopies (D/(C + D))
• Accuracy: The percentage of correctly predicted easy or difficult laryngoscopies as a proportion of all laryngoscopies (A + D)/(A+ B + C + D)
• Likelihood ratio of a positive test result (LR+): The number of times more likely that a patient with positive test result will have a difficult airway; it is calculated by sensitivity divided by 1-specificity.’
• AUC of an ROC-curve (area under a receiver operating characteristic curve): The probability of the correct classification using the test in a sample pair of two patients (one with an easy airway, one with a difficult airway). In this specialized case the AUC = (sensitivity* (1-specificity)/2) + (sensitivity* specificity) + ((1-sensitivity)* specificity/2)
References
- 1. Lapinsky, S.E. Endotracheal intubation in the ICU. (2015) Crit Care 19: 258.
- 2. Cook, T.M., MacDougall-Davis, S.R. Complication and failure of airway management. (2012) BJA 109 (Suppl 1): i68-i85.
- 3. Nalon, J.P., Kelly, F.E. Airway challenge in critical care. (2011) Anesthesia 66: 81-92.
- 4. Oates., J.D., Macleod, A.D., Oates, P.D., et al. Comparison of two methods for predicting difficult intubation. (1991) Br J Anaesth 66(3): 305-309.
- 5. Rocke, D.A., Murray, W.B., Rout, C.C., et al. Relative risk analysis of factors associated with difficult intubation in obstetric anesthesia. (1992) Anesthesiology 77(1): 67-73.
- 6. Chou, H.C., Wu, T.L. Thyromental distance shouldn't we redefine its role in the prediction of difficult laryngoscopy? (1998) Acta Anaesthesiol Scand 42(1): 136-137.
- 7. Turkan, S., Ates, Y., Cuhruk, H., et al. Should we reevaluate the variables for predicting the airway in anesthesiology? (2002) Anesth Analg 94(5): 1340-1344.
- 8. Bilgin, H., Ozyurt, G., Screening tests for predicting difficult intubation. A clinical assessment in Turkish patients. (1998) Anaesth Intensive Care 26(4): 382-386.
- 9. Kamranmanesh, M.R., Jafari, A.R., Gharaei, B., et al. Comparing the new Acromio – axillo – suprasternal notch index with modified Mallampati test in the prediction of difficult laryngeal Exposure. (2012) JIAIC 34(79): 7-14.
- 10. Merah, N.A., Worg, D.T., Ffoulkes-Crabbe, D.J., et al. Modified Mallampati test, thyromental distance and inter-incisor gap are the best predictors of difficult laryngoscopy in West Africans. (2005) Can J anaesth 52(3): 291-296.
- 11. Khan, Z.H., Mohammadi, M., Rasouli M.R., et al. The diagnostic value of the upper lip bite test combined with sternomental distance, thyromental distance, and interincisor distance for prediction of easy laryngoscopy and intubation: a prospective study. (2009) Anesth Analg 109(3): 822-824.
- 12. Londstrom, L.H., Vester-Anderson, M., Moller A.M., et al. Poor prognostic value of the modified Mallampati score: a meta-analysis involving 177 088 patients. (2011) Br J Anaesth 107(5): 659-667.
- 13. Schmitt, H.J., Kirmse, M., Radespiel-Troger, M. Ratio of patient’s height to thyromental distance improves prediction of difficult laryngoscopy. (2002) Aneasth Intensive Care 30(6): 763-765.
- 14. Honarmand, A., Safavi, M., Ansari, N. A comparison between hyomental distance ratio, ratio of height to thyromental, modified mallampati classification test and upper lip bite test in predicting difficult larygoscopy of patients undergoing general anesthesia. (2015) Adv Biomed Res 3: 166.
- 15. Rose, D.K., Cohen, M.M. The airway: problems and predictions in 18,500 patients. (1994) Can J Anaesth 41(5 Pt 1): 372-383.
- 16. Kim, W.H., Ahn, H.J., Lee, C.J., et al. Neck circumference to thyromental distance ratio: A new predictor of difficult intubation in obese patients. (2011) Br J Anaesth 106(5): 743-748.
- 17. Gonzales, H., Minville, V., Delnoue,k., et al. The importance of increase neck circumference to intubation difficulties in obese patients. (2008) Anesth Analg 106(4): 1132-1136.
- 18. Practice guidelines for obstetric anesthesia: an updated report by the American Society of Anesthesiologists Task Force on Obstetric Anesthesia. (2007) Anesthesiology 106(4): 843-863.
- 19. Krage, R., vanRijn, C., vanGroeningen, D., et al. Cormack-Lehane classification revisited. (2010) Br J Anaesth 105(2): 220-227.
- 20. Huh, J., Shin, H.Y., Kim, S.H., et al. Diagnostic predictor of difficult laryngoscopy: the hyomental distance ratio. (2009) Anesth Analg 108(2): 544-548.
- 21. Schniederjans, M.J. Mathematical partitioning of the receiver operating curve: A diagnostic tool for medical decision making. (1985) Socio-econ Plann Sci 19(2): 125-135.
- 22. Hanley, J.A., McNeil, B.J. The meaning and use of the area under a receiver operating characteristic (ROC) curve. (1982) Radiology 143(1): 29-36.
- 23. Hirmanpour, A., Safavi, M.R., Honarmand, A., et al. The predictive value of the ratio of neck circumference to thyromental distance in comparison with four predictive tests for difficult laryngoscopy in obstetric patients scheduled for cesarean delivery. (2014) Adv biomed Res 3: 200.
- 24. Frerk, C.M. Predicting difficult intubation. (1991) Anaesthesia 46(12):1005-1008.
- 25. Merah, N.A., Foullkess-Crabbe, D.J., Kushimo, O.T., et al. Predictors of Difficult Laryngoscopy in Population of Nigerian Obstetric patients.(2004) West Afr J Med 23(1): 38-41.
- 26. Safavi, M., Honarmand, A., Zera, N. A comparison of the ratio of patient’s height to thyromental distance with the modified Mallampati and the upper lip bite test in predicting difficult laryngoscopy. (2011) Saudi J Anaesth 5(3): 258-263.


