
Angiogenesis Related Remodeling and Reprogramming in Melanomas
Affiliation
Pigment Cell Center, New Delhi, India
Corresponding Author
Bhanu Iyengar. Pigment Cell Center, New Delhi, India. E-mail: bhanu_i@yahoo.com
Citation
Iyengar, B. Angiogenesis related Remodeling and Reprogramming in Melanomas. (2015) Invest Dermatol Venerol Res 1(1): 7- 16.
Copy rights
© 2015 Iyengar, B. This is an Open access article distributed under the terms of Creative Commons Attribution 4.0 International License.
Keywords
Neural crest cells; Neural markers; Biogenic amines; Angiogenesis; Tumor vascular complexes.
Abstract
Melanomas show a wide variation in pigmentation. The present study evaluates the role of angiogenesis in reprogramming/remodeling of the tumor through tumor vascular interactions.
Introduction
Melanocytes are derived from the multipotent neural crest cells[NC] during embryogenesis of the neural tube[1]. The NC cells arise from the neural fold which lies at the confluence of the neuroepithelium and the general epidermis. These cells differentiate into neuronal, epidermal as well as pigment cells. The melanocytes actively produce catecholamines as well as indoleamines[2–4]. Melanomas are highly malignant tumors arising from the melanocytes in the basal layer of the epidermis, uveal tract of the eyes, inner ear, mucous membrane, genital organs, anus and leptomeninges.
Human cutaneous melanomas show molecular plasticity and often express genes characteristic of neural cell lineages[5]. In vertical growth phase[VGP] melanomas there is a definite pattern of neural differentiation in relation to angiogenesis on viewing the tumor vascular interaction as a three dimensional system[6].
Human cancers which persist in situ for months in a prevascular phase, require efficient vascularisation, for further growth and metastasis. Angiogenesis and remodeling are required for the development of the tumor microcirculation[7]. Neoangiogenesis results from the proliferation, sprouting, and migration of endothelial cells within normal tissues adjacent to the tumor. Studies have shown that varying types of vascularisation are evident in melanomas[8]. Angiogenesis is predominant in pigmented melanomas, neovascular channels arising from pre-existing stromal vessels at the invasive margins. In the aggressive amelanotic melanomas, embryonic vasculogenesis predominates[9].
Melanomas show a wide variation in pigmentation, some tumors showing heavy pigmentation, while some are amelanotic and others show nodules varying from deeply pigmented to amelanotic. The present study evaluates whether this variation is due to a clonal difference or due to a reprogramming of the component tumor cells and the possible role of angiogenesis and tumor vascular interactions.
Material and Methods
Nodular melanomas in the vertical growth phase [VGP] were received from the Cancer Surgery Unit of Safdarjung Hospital, New Delhi, fixed in cold [4°C] 10% formol glutaraldehyde. The formaldehyde-glutardehyde cold fixation retains the morphology, gives crisp staining and efficient immunohistochemical staining both in frozen as well as paraffin sections. The same blocks can be subjected to electron microscopy as well. 10 nodules were sampled from each of 27 tumors, to make a total of 270 blocks, in the ratio of pigmented to poorly pigmented areas in each tumor. As the specimens were received and sampled the blocks were arranged in a grid, according to the pigment level which varied between 7% - 95% [Figure 2]. 20 to 40, 5μm thick serial frozen and paraffin sections of each block were maintained under refrigeration at 4°C for the following:
Histochemistry: HE, PAS, combined reticulin+gold impregnation for aurophilia[10]. Gold chloride sublimate specifically and exclusively stains astrocytes [confirmed by GFAP and nestin positivity] which stain intensely black. Reticulin is seen as a network of fine fibrils and the vascular basement membrane; Enzyme histochemistry: dopa oxidase, tyrosinase and monoamino oxidase methods;
Immunohistochemistry: using the Avidin/ Biotin system[11-13]. The amelanotic melanocyte has been identified by the specific melanocyte markers HMB-45 and S-100 protein. The expression of neural markers, nestin [Nes], glial fibrillary acidic protein [GFAP], neural fibrillary protein [NFP] and synaptophysin [Syn]; pituitary hormones, adrenocorticotropic hormone [ACTH], prolactin [PRL], human growth hormone [HGH]; indoleamines [serotonin, melatonin]; catecholamines [DA, NA, dopa and pigment] and matrix proteins [LN5, integrin] were examined. As negative control all slides included a serial section stained with no mAb. The same mAb were used simultaneously against known positive sections from human skin as positive controls.
[Immuno Chemicals: GFAP: BioGenex Lab: Polyclonal; NFP: BioGenex Labs: Monoclonal; Synaptophysin: BioGenex Labs; Monoclonal; Serotonin: BioGenex Labs: Monoclonal; Melatonin: BioGenex Labs: Monoclonal; Adrenocorticotropic Hormone [ACTH]: Dako Pat kits: Polyclonal; Prolactin [PRL]: Dako Pat kits: Polyclonal; Human Growth Hormone [HGH]: Dako Pat kits: Polyclonal; LN5 [Laminin 5]: Kappa Zymed: Monoclonal; Integrin α5β1: Dako Pat kits: Monoclonal].
Morphology and Morphometry
Morphology and morphometry were assessed on HE sections. Morphometric analysis of cell and nuclear size and nuclear density was done using a Semi-automated Zeiss Morphomat, Scion Image of NIH and a Reichert Cyto spectrophotometer to compare the size and the nuclear parameters of tumor cells with normal epidermal melanocytes. The nuclear content was assessed as follows: Area of nucleus x optical density x 5 (tissue thickness) = DNA [Q]
Electron microscopy: routine and after en bloc stain for dopa. The above methods were applied to:
a. General tumor areas and
b. Tumor Vascular Complexes [TVCs].
c. General Tumour Areas [Figure 2]
167 blocks, 84 pigmented and 83 poorly pigmented and amelanotic nodules have been included.
In Group I, 4 cases are pigmented and 4 amelanotic to include 40 pigmented and 40 amelanotic nodules/ blocks.
In Group II 19 cases are mixed showing both pigmented and amelanotic general nodules composed of 87 blocks, 44 melanotic and 43 amelanotic.
All counts were double blind observations made by two unrelated observers and the author. Counts and measurements were repeated three times at 6 monthly intervals to remove any bias.
Quantitation by Morphometric Analysis
Morphometric measurements of cell size and the nuclear parameters were done in 200 cells on random pigmented and amelanotic nodules in each tumor. Measurements are represented as scatter diagrams for comparison. 100 melanocytes from overlying normal epidermis serve as control [Figure 1, Table1]. Morphometric counts were done blinded to the category of the tissue block (pigmented or amelanotic or mixed). Mitotic Activity and morphology was assessed in pigmented amelanotic areas and TVCs [Figure 4]. Mitotic counts were done and compared in these areas on sections stained with PCNA and Ki67 both specific for mitotic cells.
Immunohistochemistry [Figure 5]
Positive cell counts, of each marker were entered into the grid. Positive cells per 1000 cells were counted in random 10 HPF per block for each marker in serial sections. The positive counts are presented as scatter diagrams, comparing pigmented and amelanotic areas in: Group I. [Table 2] Pigmented vs Amelanotic tumors; 4 pigmented and 4 amelanotic tumors including 80 blocks [40P/40A]; and 19 mixed tumors which include 87 blocks [44P/43A] [Group II] [Table 3]. Expression of various markers in these two groups has been compared.
Tumor Vasculature
Incorporated Vessels [INC] are seen in 84 general pigmented nodules away from the tumor stroma interphase. [Figure 6].
Angiogenesis from Normal Stromal Vessels at the Advancing Margin of Tumor
103 blocks from mixed tumors, 51 blocks from pigmented and 52 from poorly pigmented nodules [Figure 2] at the interphase between the tumor and surrounding preexisting stroma, have been included for the study. A large number of angiogenic vessels are seen within 2hpf of the tumor margin with a maximum of 20 vessels per HPF associated with TVCs. [Figure 6]. Vascular channels are counted at the tumor margins in each of the 103 blocks to a depth of two high power fields [HPF] and at a depth of 5 to 6 HPF within the tumor in 10 HPF [1030 HPF marginal and 1030 HPF within tumor]. Vessel counts were done on sections stained with nestin, PAS and reticulin stain.
Tumor-Vascular-Complexes [TVCs]
Endothelial tubes from normal stromal vessels interact with tumor cells to form tumor-vascular-complexes [TVCs]. The TVCs from both pigmented and amelanotic nodules are counted in 5 random HPF in each block along the tumor margin at the tumor-stromal interphase [out of a possible maximum of 100 vessels]. A total of 1030 TVCs formed around vessels in cross section were included in the study [Figure 3].
Immunohistochemistry [Figure 3c]
Neural marker positivity has been examined in the layers of the perimantle zone [PMZ] of tumor-vascular complexes [TVC] formed during angiogenesis and compared in pigmented and amelanotic nodules as well as in the TVCs [Table.4]. Positivity recorded and compared are from 5 random TVCs each, from 3 pigmented [P1, P2, P3] and 2 amelanotic [A1, A2] nodules in the same tumor [Figure 3a]
Morphometry [Figure 7]
The measurements are taken from each layer in 5 random TVCs in pigmented and amelanotic nodules in all tumors. Measurements recorded and compared here are from 5 random TVCs each, from 3 pigmented [P1, P2, P3] and 2 amelanotic [A1, A2] nodules in the same tumor marked with arrow in [Figure 6a, Figure 7, Table 5].
Progression and Fate of TVCs [Figure 8]
Stacks of serial and contiguous HE, mAb, reticulin stained and gold impregnation sections, are used to make 3D reconstructs of angiogenic vessels arising from pre-existing normal stromal vascular channels showing interaction with the advancing tumor. These channels are traced beyond the marginal 2hpf to follow the growth of the TVCs and to study vascular interactions within and around the growing tumor. Presence of pigment, a positive DOPA reaction, and HMB-45 positivity are criteria for diagnosis. In the absence of pigment a positive dopa reaction, HMB45 positivity and the presence of premelanosomes on electron microscopy [EM] is diagnostic of amelanotic melanomas. These criteria form the basis of diagnosing each tumor included in this study.
Statistical Analysis: Anova Analysis: Kruskal-Wallis One Way Analysis of Variance; and Tukey Test: All Pairwise Multiple Comparison Procedures. All procedures were performed with the informed consent of patients, in full compliance with the Helsinki Declaration.
Results
Morphologic Patterns
General tumor
Pigmented areas show marked anisocytosis and anisonucleosis [Figure 1a]. Pleomorphism is prominent with cells varying in shape from spindloid to rhabdoid to tadpole shaped. Variable mixtures of both spindle and epithelial cells are seen. Cells with other morphology are observed comprising of round cells and balloon cells. Mononucleate and multinucleate giant cells with 10-12 nuclei are seen in some areas. Giant cells with peripherally placed multiple nuclei are also observed as are mononucleate giant cells with open chromatin.
The epithelioid cells are large cells with polygonal outlines, eosinophilic cytoplasm with round to oval vesicular nuclei arranged in a nested pattern. The fascicles and nests are separated by thin or dense connective tissue. The nuclear appearance too varies with some nuclei being dense and hyperchromatic with an indistinct nucleolus. Occasional tumors show areas with small round cells with scanty cytoplasm and dense nuclei are arranged in a rosettoid pattern mimicking primitive neuroectodermal tumors.
Amelanotic areas show a diffuse pattern of continuous sheets of fairly uniform cells [Figure 1b]. Balloon cells are identified by their abundant, clear cytoplasm, relatively little nuclear atypia and scanty pigment; and are seen with epithelial cells[10-13]. The nucleus is large and vesicular with chromatin scattered in irregular clumps. This type of nucleus is mostly associated with a large and prominent nucleolus.
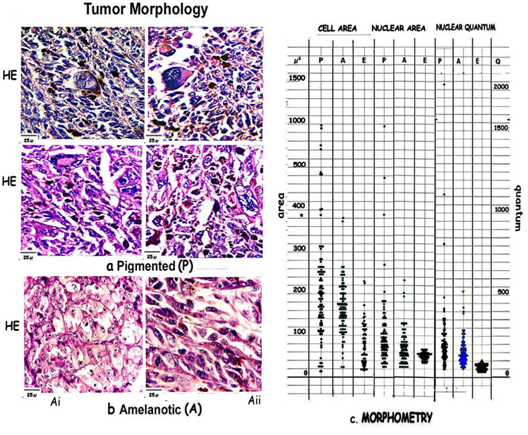
Figure 1: Composite figure showing morphological features of [a] Pigmented areas [P] with marked pleomorphism, [b] Amelanotic areas [Ai, Aii] with uniform cells. [c] Scatter diagram compares cell and nuclear areas and nuclear density in pigmented [P] amelanotic cells [A] and epidermal melanocytes [E].
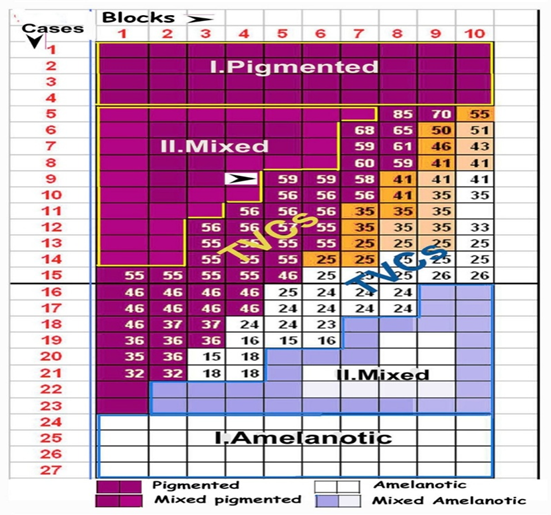
Figure 2: Grid showing blocks arranged in order of pigment levels in the cases studied. General pigmented areas are marked brown  , 40 blocks in pigmented tumors and 44 in mixed tumors. Poorly pigmented amelanotic areas are white
  , 40 blocks in amelanotic tumors and 43 in mixed tumors. 103 blocks from the tumor-stroma interphase, 51 from pigmented and 52 from poorly pigmented nodules have been marked with the number of TVCs in each.
Mixed tumors are formed of multiple variegated nodules some showing heavy pigmentation, others graded peripheral pigmentation and some amelanotic as arranged in the grid[Figure 2, 3].
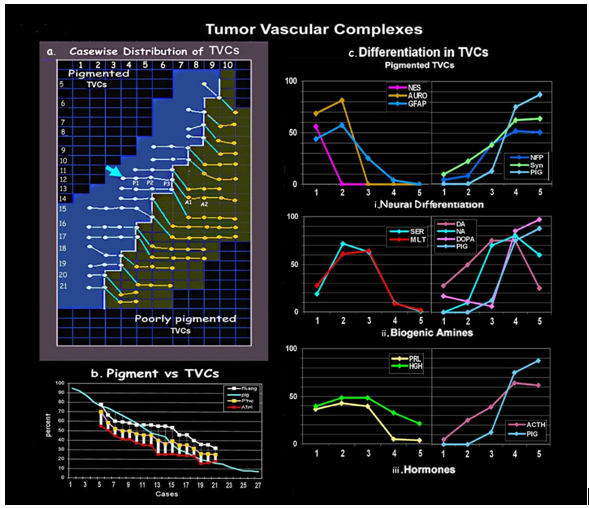
Figure 3: [a] Grid shows the case wise distribution of TVCs in pigmented and poorly pigmented nodules of mixed tumors. Arrow indicates the case where morphometric measurements and patterns of differentiation in 5 groups of TVCs, P1, P2, P3, from pigmented and A1 and A2 from amelanotic nodules, have been compared with pigmented, amelanotic, and epidermal parameters. [b] Graph depicting the association of pigment levels with total angiogenesis and TVC formation in melanotic and poorly pigmented nodules. [c] Comparative graphs show organized differentiation [i.neural, ii. biogenic amines and iii. hormone] in the mantle zone of pigmented TVCs.
Morphometry
Morphometry highlights the variations in pigmented and amelanotic tumors. The cell and nuclear areas, and the DNA quantum have been compared with epidermal melanocytes [Figure 1, Table 1]
Table 1: Cell and nuclear areas and the range in P and A are compared with normal epidermal melanocytic values. P shows marked pleomorphism of cells with a wide range of values being 1419.1μ², while A is uniform 354.8μ² and shows near epidermal values 207μ². Nuclei show a similar trend P showing the greatest range of 967.7μ², A 167.7μ² and E 40.3μ².
| cell area | nucleus | |||||
|---|---|---|---|---|---|---|
| min | max | range | min | max | range | |
| epidermal | 18μ² | 225μ² | 207μ² | 7.1μ² | 47.4μ² | 40.3 μ² |
| pigmented | 12.9μ² | 1431.9μ² | 1419.1μ² | 25.6μ² | 993.3μ² | 967.7μ² |
| amelanotic | 25.8μ² | 380.6μ² | 354.8μ² | 25.8μ² | 193.5μ² | 167.7μ² |
General Tumor[Table.1]
Pigmented Areas
The pigmented areas show marked variation in cell and nuclear size, and nuclear content. Cell areas vary from a minimum of 12.9μ² to a maximum of 1431.9μ²: [range: 1419.1μ²]. Nuclear areas vary from 25.6 to 993.3μ² [range: 967.7μ²] and nuclear DNA from 0.0551 - 2.3046 [range 2.2495].
Amelanotic Areas
In contrast the values in the amelanotic tumors are closer to the normal epidermal values with near normal variation in cell and nuclear size and DNA content. Cells vary from a minimum of 25.8μ² to 380.6μ², a range of 354.8μ², Nuclear areas vary from 25.8μ² to 193.5μ², a range of 167.7μ² and nuclear DNA varies from 0.0504 - 0.5209: range 0.4705.
Epidermal Melanocytes
Cell areas vary from 18μ² - 225μ² with a range of 207μ², nuclear areas vary from 7.1μ² – 47.4μ² the range being 40.3μ² and nuclear DNA ranges from 0.0344-0.1026 [0.0682] in epidermal melanocytes.
Mitotic Activity [Figure 4]
All counts were done on serial PCNA and Ki67 stained sections.
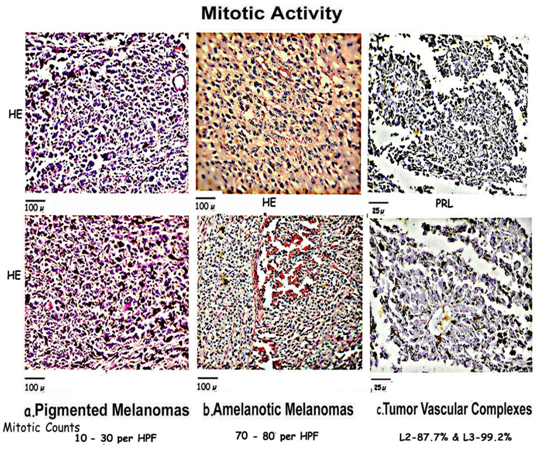
Figure 4: Composite figure compares mitosis in [a] Pigmented areas which show marked pleomorphism and abnormal mitosis; [b] Amelanotic areas having synchronized near normal mitosis with surrounding uniform cells; and [c] TVCs which show normal bipolar mitosis in the 2nd and 3rd layers of the mantle zone.
Pigmented Areas [Figure 4a]
Mitotic figures are prominent in most areas throughout the pigmented tumors more so nearer the margins varying from 10 to 30 per hpf or more. A prominent number of highly abnormal tripolar or multipolar and aneuploid nuclei, with very occasional bipolar mitotic figures can be seen.
Amelanotic Areas [Figure 4b]
Amelanotic tumors show a very large number of near normal mitotic figures 70 to 80 per hpf with intervening areas showing very few indicating waves of synchronization of mitosis with rapid proliferation. These melanomas, composed of uniform cells, show few abnormal mitotic figures.
Mitosis in TVCs [Figure 4c]
Mitosis is mainly concentrated in the layers L2 and L3 903 TVCs out of 1030 [87.7%] showed mitotic figures in L2. 1022 TVCs out of 1030 [99.2%] showed mitotic figures in L3 compared to 21% TVCs [216/1030] had very occasional mitosis L4, with 1383 out of 13824 cells [10%] in L4. L1 and L5 do not show significant numbers of mitotic figures. The mitotic figures in the TVCs are predominantly bipolar and normal in appearance.
Patterns of Differentiation [Figure 5, Table 2, 3]
The expression of neural markers, pituitary hormones; indoleamines; catecholamines and matrix proteins by melanocytes in association with pigmentation and morphological variation has been examined in this section.
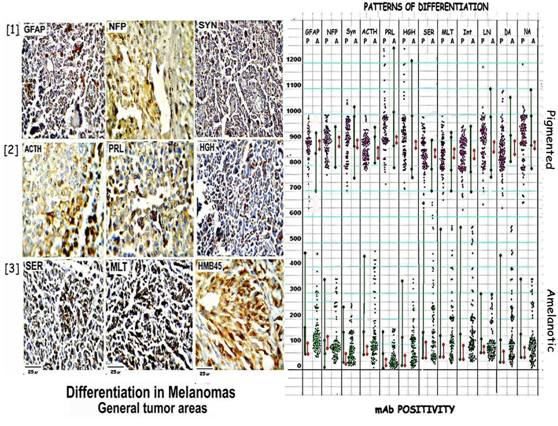
Figure 5: Shows differentiation in general tumor areas as seen by the positivity for GFAP, NFP, & Synaptophysin in[1]; ACTH, PRL & HGH in[2]; Serotonin, Melatonin & HMB45 in[3]. The attached scatter diagram shows high positivity of all markers in pigmented areas and very low positivity in amelanotic areas.
Table 2: shows the ranges of GFAP, NFP, & Synaptophysin; ACTH, PRL & HGH; Serotonin, Melatonin, DA, NA and the matrix proteins, LN5 & integrin positivity in pigmented and amelanotic areas in fully pigmented versus amelanotic tumors. The ratios show the high differentiation in the pigmented as compared to amelanotic areas which form polar groups.
| I. Polar | Pigmented | Amelanotic | ||||
|---|---|---|---|---|---|---|
| mAb | min | max | min | max | mAb | ratio |
| GFAP | 860 | 890 | 60 | 81 | GFAP | 12.4:1 |
| NFP | 870 | 910 | 58 | 78 | NFP | 13.5:1 |
| Synp | 870 | 890 | 31 | 61 | Synp | 19.2:1 |
| ACTH | 829 | 868 | 59 | 89 | ACTH | 11.8:1 |
| PRL | 891 | 909 | 10 | 29 | PRL | 44.8:1 |
| HGH | 869 | 888 | 19 | 56 | HGH | 22.7:1 |
| SER | 831 | 850 | 41 | 110 | SER | 9.6:1 |
| MLT | 829 | 849 | 40 | 99 | MLT | 10.8:1 |
| LN5 | 860 | 880 | 59 | 79 | LN5 | 13:01 |
| inte | 827 | 849 | 40 | 100 | inte | 10.8:1 |
| DA | 841 | 899 | 23 | 60 | DA | 19.8:1 |
| NA | 860 | 890 | 56 | 74 | NA | 14.5:1 |
| mAb +ve cell counts | ||||||
Positive Cell Counts [Figure 5, Table 2, 3]
All pigmented areas were positive for the neural markers, the three neurohormones, catecholamines, indoleamines as well as the matrix proteins. Positive cell counts showed a range of 698-1299 positive cells per block in 84 blocks from pigmented nodules as shown in the scatter diagram and values in [Table 3]. Positivity for all the markers is low or absent in amelanotic areas. Positive cells counted in 83 blocks from amelanotic nodules showed a range of 0-649 cells per block. Thus the total range of immune positivity is 70% to 100% in pigmented areas and 0% to 65% in amelanotic areas.
Differentiation in pigmented and amelanotic nodules were assessed and compared in purely pigmented and amelanotic tumors and mixed tumors.
In the Polar Group [Figure 5 Table 2 Polar] Pigmented nodules show a total range of 827-909/1000 positive cells [82.7%- 90.9% positivity]. Integrin/SER show minimum: 836/838 cells/1000 while PRL shows a maximum positivity of 899.6 cells/1000, the overall positivity being 87%.
In comparison amelanotic nodules show a range of 10- 110/1000 cells a positivity of 1% - 11%. Minimum positivity is seen with PRL: 201 positive cells/10hpf and maximum with SER: 872 positive cells/10hpf the reverse of pigmented nodules; the overall positivity is 605 /10hpf [61%]
In comparison in the Mixed Group [Figure 5 Table 3] Pigmented nodules show a total range of 698-1299/1000 or 69.8%-100% positivity. SER show minimum: 838 cells/10hpf while PRL shows a maximum positivity of 1018 cells/10hpf, the overall positivity being 904 cells/10hpf or 90% cells showing positivity in 10hpf. Amelanotic nodules show a total range of 0-649 positive cells in 10hpf) a percentage positivity of 0%-65%. The minimum positivity is seen with PRL: 77 positive cells/10hpf and maximum with SER: 323 positive cells/10hpf the reverse of P; the overall +ve: 237 positive cells/10 hpf [24%].
Table 3: shows the ranges of positive cell counts of neural markers; pituitary hormones; biogenic amines & matrix proteins in pigmented and amelanotic areas in mixed tumors. The ratios show the high differentiation in the pigmented versus amelanotic areas as seen in polar groups.
| II. Mixed | Pigmented | Amelanotic | ||||
|---|---|---|---|---|---|---|
| mAb | min | max | min | max | mAb | ratio |
| GFAP | 698 | 899 | 101 | 453 | GFAP | 3.4:1 |
| NFP | 790 | 950 | 90 | 354 | NFP | 3.1:1 |
| Synp | 900 | 1025 | 61 | 253 | Synp | 6.03:1 |
| ACTH | 851 | 938 | 140 | 443 | ACTH | 2.8:1 |
| PRL | 920 | 1299 | 0 | 151 | PRL | 13.2:1 |
| HGH | 886 | 1206 | 39 | 343 | HGH | 6.12:1 |
| SER | 783 | 894 | 91 | 649 | SER | 2.6:1 |
| MLT | 775 | 898 | 103 | 553 | MLT | 2.9:1 |
| LN5 | 833 | 1100 | 101 | 298 | LN5 | 4.7:1 |
| inte | 777 | 948 | 102 | 552 | inte | 2.7:1 |
| DA | 850 | 1066 | 23 | 443 | DA | 3.1:1 |
| NA | 840 | 1091 | 89 | 354 | NA | 2.9:1 |
| mAb +ve cell counts | ||||||
Ratios [Figure 5 Table 3]
The overall P: A ratio in Group I is 14.3:1 [max: PRL: 44.8:1; min: SER: 9.6:1;] where as the ratio is 3.8:1 [max: PRL: 13.2:1; min: SER: 2.6:1;] in Group II. Thus in both groups pigment nodules show higher positivity, Group I showing a much larger difference.
Thus the pigmented and amelanotic areas form polar groups with extreme divergence in morphology, morphometric parameters and differentiation.
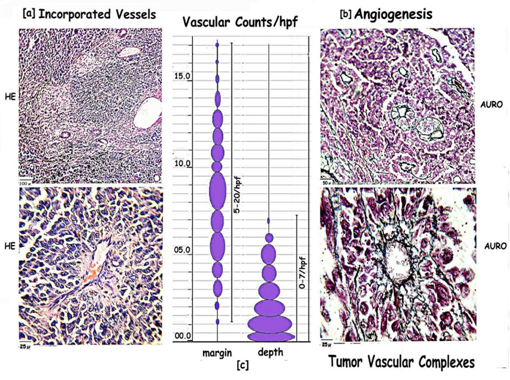
Figure 6: Composite picture of tumor vasculature within general areas and at invading margins, showing: [a] Incorporated vessels [INC] within fibrous stroma of the tumor show branching and sprouting. The surrounding tumor cells are pleomorphic, with prominent pigment and abnormal mitosis. There is no interaction as seen at the advancing edge of the tumor. [b] Angiogenic vessels elicited by the tumor interact with the tumor cells to form TVCs which show organized differentiation within the mantle zone. [c] Scatter diagram highlighting the highvascular counts in the marginal 2hpf as compared with areas in the depth the maximum being 20/hpf.
Tumor Vasculature [Figure 6]
Incorporated Vessels [INC] [Figure 6a]
General pigmented areas show incorporated vessels. Blood vessels incorporated within the fibrous tissue of the tumor show sprouting and branching. Angiogenic vessels seen at the marginal interphase is not apparent. The surrounding tumor cells remain chaotic with no definite organization as seen with the marginal tumor vascular interaction.
Angiogenesis from normal stromal vessels at the advancing margin of tumor:
Vascular counts [Figure 6c]
The margins show a maximum of 20 bv/hpf and a minimum of 5 bv/HPF while areas of main tumor growth show a maximum of 6 bv/HPF and a minimum of 0 bv/HPF are observed. Thus angiogenesis is significantly higher at the margins as compared to that within the tumor [5hpf].
Tumor Vascular Interaction
The adjacent pre-existing blood vessels within the stroma extend endothelial tubes which cannelise and enter the tumor margins. The tumor cells interact with the angiogenic vessels to a depth of 2hpf to form a tumor-vascular-complex [TVC] with a perivascular mantle zone [PMZ] of 5 to 6 cell layers labeled L1-L5. [Figure 6b][6]
Distribution of TVCs [Figure 2, 3a]
The TVCs from both pigmented and amelanotic nodules are counted in 5 random hpf along the tumor margin in contact with the surrounding stroma as given in the grid. Serial sections are treated as given in Methods.
Pigment vs Angiogenesis
Grid shows the number of TVCs in pigmented [P] vs amelanotic [A] nodules at the tumor/stroma interphase the [Figure 3a] showing the percentage in each case for comparison. Each hpf at the marginal zone has a potential for 20 TVCs, and 100 in 5hpf expressed as a percentage[14].
There are a total number of 4182 TVCs in the 103 blocks, 2646 [63.3%] in the pigmented and 1536 [36.7%] in amelanotic nodules. The 51 pigmented nodules show 85 to 32 TVCs while the 52 amelanotic contain 55 to 15 TVCs. On comparison pigmented nodules show higher number of TVCs in total, as well as within each tumor, there being a graded decrease in relation to the level of pigment in each nodule [Figure 3b].
Differentiation in TVCs [Figure 3c, Table 4]
Nes positivity is seen in cells abutting on the lumen till the formation of 1 to 2 layers [56.25%], thereafter to be replaced by Auro [L1: 68.75%; L2: 81.25%] and GFAP positivity [L1: 43.75%; L2: 57.25%]. Nes/Aurophilic, and GFAP positive processes extend outward from this layer, to form a supporting frame-work for the extending layers of tumor cells.
Table 4: Differentiation in TVCs: A comparative table showing percentage positivity of neural, biogenic amines, pigment and hormones in pigmented and poorly pigmented TVCs, P showing 5 times the overall percentage positivity seen in A. Peak positivity in each has been highlighted. GFAP, Nes & Auro are positive in L1/L2, Indoleamines, HGH & PRL in L2/L3 and catecholamines pigment and ACTH in the outer layers.
| Pigmented | Poorly Pigmented | ||||||||||
|---|---|---|---|---|---|---|---|---|---|---|---|
| P | 1 | 2 | 3 | 4 | 5 | 1 | 2 | 3 | 4 | 5 | |
| N | NES | 56.25 | 0 | 0 | 0 | 0 | 9.5 | 0 | 0 | 0 | 0 |
| AURO | 68.75 | 81.25 | 0 | 0 | 0 | 5.5 | 2.8 | 0 | 0 | 0 | |
| GFAP | 43.75 | 57.3 | 25.5 | 3.8 | 0 | 1.4 | 10.5 | 3 | 0 | 0 | |
| NFP | 3.8 | 7.9 | 38.9 | 51.7 | 50.6 | 1.7 | 8.1 | 18.5 | 6.8 | 3 | |
| Synapt | 9.7 | 21.9 | 38 | 62.3 | 63.5 | 2 | 5.6 | 11.6 | 17.8 | 20 | |
| H | PRL | 36.3 | 42.5 | 39.8 | 5 | 3.8 | 3 | 5 | 1 | 0 | 0 |
| HGH | 39.8 | 48.6 | 48.7 | 32.8 | 21.4 | 22.5 | 5 | 2.5 | 0 | 0 | |
| ACTH | 5 | 25 | 39.1 | 64.2 | 61.6 | 0 | 0 | 2.4 | 0 | 0 | |
| B | SER | 19.1 | 71.8 | 62.8 | 9.4 | 0.9 | 4 | 10.7 | 0 | 0 | 0 |
| MLT | 27.5 | 60.9 | 64.1 | 8.6 | 1.6 | 1.2 | 3.6 | 0 | 0 | 0 | |
| DOPA | 17 | 11.4 | 6 | 84.9 | 96.9 | 0 | 0 | 0 | 21.5 | 1.5 | |
| DA | 27.5 | 50 | 75 | 75 | 25 | 2.7 | 15 | 24.3 | 24 | 14 | |
| NA | 0 | 10 | 70 | 80 | 60 | 0 | 5.6 | 26 | 28 | 21 | |
| PIG | 0 | 0 | 12.5 | 75 | 87.5 | 0 | 0 | 0 | 0.4 | 0.9 | |
N: Neural Differentiation ; H: Hormones ; B: Biogenic Amines
ANOVA: Pairwise comparisons in TVCs layers:
• Neuro: GFAP/Nes are significantly higher than NFP/Syn in L1&L2 and significantly lower in L4&5 (p < 0.001).
• Biogenic Amines: Indoleamines (SER/MLT) are significantly higher than catecholamines (DA/NA) in L1&L2; (p < 0.001), while being significantly lower than catecholamines, DO & pigment L3, L4&L5 (p < 0.001). DO positivity is highest in L4 (p < 0.001). Pigment positivity peaked in L5 (p < o0001).
• Hormones: PRLJHGH are significantly higher than ACTH in L2&L3 (p < 0.001) while significantly lower than ACTH in L4&L5.
Indoleamines are positive in L2/L3 associated with mitosis. Both serotonin [L2:71.8%; L3:62.8%] and melatonin [L2:60.9%; L3:64.1%] are positive in these layers. All three pituitary hormones are expressed by the proliferating melanoma cells. HGH [L2:48.6%; L3:48.7%] and PRL [L2:42.5%; L3:39.8%] are expressed in the inner three layers.
Catecholamines DA [L3:75%; L4:75%]/NA [L3:70%; L4: 81.25%] and the related enzyme DO are positive in the layers L3/L4 & L5. Pigment [L4:75%; L5: 80%] and ACTH [L4: 64.2%; L5: 61.6%] are expressed in the 4th and 5th layers, where mitotic figures are scant, associated with NFP [L4: 51.7%; L5: 50.6%] and Syn [L4: 62.3%; L5: 63.5%] positivity.
Thus there is a regimented neurogenesis in the TVCs, initiated by endothelial tubes interacting with tumor cells beginning with glial differentiation followed by indoleamines and HGH/PRL in the middle layers and further by catecholamines and ACTH in the outer layers. Differentiation is proportionate to the level of pigmentation.
All markers are higher in pigmented TVCs as compared to those from poorly pigmented areas as illustrated in [Table 4], pigment positivity being 60 times higher MLT/HGH positivity, 20 times; ACTH positivity 11 times; PRL positivity is 8 times; NFP/SER positivity is 7 times; DO positivity is 6.5 times; GFAP positive being 6 times; Syn positivity is 4 times greater.
On Anova Analysis GFAP is significantly higher than NFP/Syn in L1&2 [(P = 0.030). F: 13.885] and significantly lower in L4&5 [(P = 0.004). F: 59.878 in L4&5]. Tukey test: All Pairwise Multiple Comparison Procedures: Comparison: P P < 0.050: GF vs. NFP:0.031 Yes; Syn vs. GF:0.004 Yes
Morphometry [Figure 7 Table 5]
Since mitosis appears near normal in poorly pigmented areas and in TVCs, morphometry was done to compare the morphometric parameters of pigmented, poorly pigmented from general areas and the mantle zone of TVCs with normal epidermal melanocytes. 5 random TVCs were taken from three pigmented [P1, P2 & P3] and 2 poorly pigmented areas [A1 & A2] from the same case for comparison [Table 5].
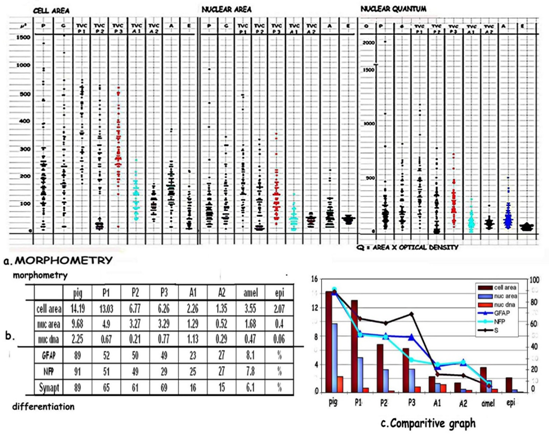
Figure 7: [a] Scatter diagram comparing morphometric parameters in P, A and TVCs from pigment and poorly pigmented nodules. There is a graded reduction in cell, nuclear size and DNA from the pigmented nodules, to pigmented TVCs, P1, P2, P3, amelanotic TVCs, A1, A2 and amelanotic nodules. [b] Table comparing morphometric parameters and differentiation from pigmented to amelanotic areas. [c] Comparative graph highlights the gradual loss of morphometric parameters and stepwise differentiation from melanotic to amelanotic areas indicating reprogramming of component cells. Poorly pigmented TVCs and amelanotic areas show near normal values which match those of epidermal melanocytes
Table 5: shows a gradation in morphometric values in TVCs, cell areas ranging from 1302.9μ² in P1, to 135.4μ² in A2, nuclear areas from 490.2μ² in P1 to 51.6μ² in A2, pigmented TVCs having parameters closer to pigmented areas while amelanotic TVCs are closer to amelanotic: cell areas and Epidermal values (40.3μ²).
| Cell area | Nucleus | |||||
|---|---|---|---|---|---|---|
| TVC | min | max | range | min | max | range |
| P1 | 180.6μ² | 1483.5μ² | 1302.9μ² | 25.8μ² | 516μ² | 490.2μ² |
| P2 | 12.9μ² | 690.2μ² | 677.3μ² | 12.9μ² | 341.8μ² | 326.9μ² |
| P3 | 25.8μ² | 651.5μ² | 625.7μ² | 32.3μ² | 361.2μ² | 328.9μ² |
| A1 | 51.6μ² | 277.4μ² | 225.8μ² | 12.9μ² | 141.9μ² | 129μ² |
| A2 | 45.2μ² | 180.6μ² | 135.4μ² | 25.8μ² | 77.4μ² | 51.6μ² |
| Epidermal | 18μ² | 225μ² | 207μ² | 7.1μ² | 47.4μ² | 40.3μ² |
| Tumor Vascular Complex | ||||||
Cell areas of TVCs show a range of 1302.9μ² in P1, 677.3μ² in P2, 625.7μ² in P3. In comparison, cell areas range from 225.8μ² in A1 to 135.4μ² in A2. Nuclear areas vary from 490.2μ² in P1, 326.9μ² in P2; and 328.9μ² in P3. The amelanotic TVCs A1 and A2 show a range of 129μ² and 51.6μ². DNA content [Q] varies from 0.6686 in P1; 0.2134 in P2 while 0.7706 in P3. Q ranges from 1.1307 in A1 and 0.2944 in A2. The greatest variation in cell size, nuclear size and content is in P1 and the pigmented TVCs with a gradual reduction to the lowest in the amelanotic A2.
Epidermal melanocytes: cell areas range: 207μ²; Nuclear areas range: 40.3μ²; Nuclear DNA range: 0.0682.
The cell and nuclear sizes and range show a gradual reduction from pigmented to amelanotic TVCs as can be seen in [Figure 7a] in the scatter diagram and [Table 5], the parameters being near normal in those from poorly pigmented areas. The component cells of the mantle zone of TVCs are more uniform matching normal epidermal melanocytes, those from pigmented nodules showing a greater scatter due the presence of glial cells. This is associated with a similar reduction in differentiation as depicted in the comparative graph 7c.
Progression and Fate of TVCs [Figure 8]
The progression and fate of the TVCs was studied in depth in view of the gradation seen in the differentiation and morphometric parameters from pigmented to amelanotic nodules. Serial sections are used to follow the progression and growth of TVCs beyond 2 hpf from the stromal margins. Stacks of serial sections are used for 3D constructs and are drawn out as a collage [Figure 8] to follow the growth and fate of the TVCs and to study vascular interactions within and around the growing tumor.
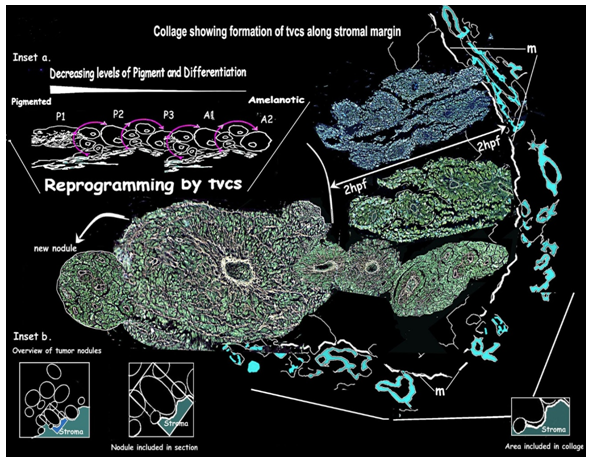
Figure 8: 3D rendering of a collage tracing extension of angiogenic vessels and the progression of TVCs beyond the marginal 2hpf: [m] shows the marginal zone between the advancing tumor and the pre-existing stroma. The upper part shows several vessels with growing TVCs from a section stained with mAb PRL. The lower part is from gold impregnated serial sections tracing the vessel and TVC beyond 2hpf. As it enlarges a second wave of angiogenesis with TVC formation occurs as the margin is contacted once again.
Insets: [a] Summary diagram of cyclical angiogenesis and TVC formation, depicting the process of reprogramming of highly pigmented cell groups to uniform near normal amelanotic cells. [b] Diagramatic overviews of the tumor area sampled.
Reprogramming and Remodeling [Figure 8 Table 5]
Angiogenesis and TVCs are directly proportionate to the level of pigmentation [Figure 6b]. Contact of pigmented tumor margins with normal stroma elicits angiogenesis from the adjoining pre-existing normal stromal vessels. As the angiogenic vessel grows beyond 2 hpf the mantle layers continue to increase to form enlarging nodules with pigmented peripheral layers, the overall pigment being less than the general tumor. When these contact the stromal margin angiogenesis and TVC formation is elicited in proportion to the pigment level. There is a reduction in pigment at each cycle. This cycle repeats itself until differentiated pigmented cells are depleted. With the absence of angiogenesis in the poorly pigmented TVCs the organized growth of the layers is lost and sheets of characteristic amelanotic cells are formed.
Discussion
The above study highlights the role of angiogenesis in remodeling and reprogramming in melanomas. Nodules of varying sizes and pigmentation are seen side by side in mixed tumors. The general melanotic and amelanotic areas are in sharp contrast forming polar groups [Figure 1, 5]. The pigmented areas show prominent pleomorphism, marked variation in cellular and nuclear size, high levels of chaotic differentiation, and prominent abnormal mitosis. In contrast, amelanotic areas show uniformity in cell morphology, cell and nuclear size tend to be near normal epidermal parameters, differentiation being low with near normal synchronized mitosis [Figure 4].
The remodeling of preexisting vessels surrounding the growing tumor active sprouting and branching of these vessels helps meet the metabolic demands of tumor cells[15]. Angiogenesis begins by focal reduction of vascular intercellular interactions in preexisting ones and increased interactions between vascular cells and the extracellular matrix [ECM]. The tumor cells at the advancing edge produce LN5 and integrin [α5β1] both of which are involved in the dissolution of the local ECM to allow the cells to move forth further[9]. Continuous stimulation of vessel outgrowth expands the vascular compartment of the growing tumor.
Melanomas show incorporated vessels[INC], vasculogenic mimicry[VM], and angiogenesis[9]. Angiogenesis is seen at the tumor-normal stroma interphase and is proportionate to the pigme


