
Antidiabetic, Antioxidant and Antibacterial Activities of the Functional Molecules Isolated from the Seed and Peel of Jackfruit (Artocarpus heterophyllus)
Aliza Bhuiyan, Somaiya Sharmin, Joynab Akhter Jolly
Affiliation
Department of Pharmacy, East West University, Dhaka, Bangladesh
Corresponding Author
Repon Kumer Saha, PhD Assistant Professor, Department of Pharmacy, East West University, Dhaka, Bangladesh, Tel: +88-02-9882308; Fax: +88-02-8812336; E-mail: reponsaha@yahoo.com
Citation
Saha, R.K., et al. Antidiabetic, Antioxidant and Antibacterial Activities of the Functional Molecules Isolated from the Seed and Peel of Jackfruit (Artocarpus heterophyllus). (2016) J Pharm Pharmaceutics 3(1): 1-8.
Copy rights
© 2016 Saha, R.K. This is an Open access article distributed under the terms of Creative Commons Attribution 4.0 International License.
Keywords
Jackfruit; Antidiabeteic; Antioxidant; Antibacterial
Abstract
Jackfruit (Artocarpus heterophyllus) belongs to the family Moraceae and is widely grown in Southeast Asia including Bangladesh, India and Thailand. Two functional compounds were isolated from the seeds and peels of Artocarpus heterophyllus using different types of chromatographic methods such as Thin Layer Chromatography (TLC), Vacuum Liquid Chromatography (VLC), Column Chromatography and the isolated molecule is analyzed by UV-Visible Spectroscopy, Infrared Spectroscopy (IR) and Nuclear Magnetic Resonance (NMR) spectroscopy. Antibacterial, antidiabetic and antioxidant activities of the molecules were evaluated in vitro using biochemical methods. These compounds showed antibacterial, antidiabetic and antioxidant activities. Therefore, both the seeds and peels of jackfruit contain functional molecules having biological activities in vitro.
Introduction
Jackfruit (Artocarpus heterophyllus) is the national fruit of Bangladesh. It is a native to southwestern of India, Philippines, Sri Lanka and east of Malaysia. Artocarpus species are rich in phenolic compounds including flavonoids, stilbenoids, arylbenzofurons and Jacalin, a lectin[1]. The seed is large, oblong and has a slimy membranous testa and a brown tegmen. A. heterophyllus is widely distributed in tropical region and has been used as traditional folk medicine against inflammation, malarial fever, antioxidant, anti-bacterial, anti-fungal, anti-diabetic and so on. In addition, the function of Artocarpus heterophyllus in human health such as pulp and seed for tonic; root for diarrhea, fever; wood for muscular contraction; leaves for activating milk in women and animal, anti-syphilis, vermifuge; leaf ash for ulcers and wound. Artocarpus heterophyllus has several medicinally important phytochemical constituents such as several flavones colorings, morin, dihydromorin, cynomacurin, artocarpin, isoartocarpin, cyloartocarpin, glycosides, lipids, protein and cellulose. The jackfruit also contains free sugar (sucrose), fatty acids, ellagic acid, and amino acids like arginine, cystine, histidine, lycine, leucine, methionine, theonine. It also contains several minerals such as Na, K, Ca, P, Fe, Zn and Mn which are healthy and beneficial for health.
The aim of this research was to carry out the characterization of the functional molecules present in the methanolic extract of seed of the Artocarpus heterophyllus and investigate their biological activities.
Materials and Methods
Plant collection & identification
The seeds of the jackfruit along with the testa were collected from Kowran Bazar, Dhaka, Bangladesh during June, 2014 and identified by the taxonomist of the Bangladesh National Herbarium, Mirpur and Dhaka as Artocarpus heterophyllus Lam. A voucher specimen of the plant has been deposited (Accession No.: 38308) in the herbarium for further reference.
Drying of plant sample: After the collection of sample it needs to be dried to make the sample extract. In general the plant material should be dried at temperature below 30°C to avoid the decomposition of thermo labile compounds. So sun drying can be very effective but drawback is sometimes water molecules are absorbed by the sample and hence fungus growth can affect the phytochemical study. The seeds along with the testa were dried in the sun light thus chemical decomposition cannot take place.
Grinding of dried sample: Small amount of plant material can be milled using grinder or blender. But if the sample is in high amount then it is easier to get powdered sample by grinding from a spice mill. Grinding improves the efficiency of extraction by increasing surface area. It also decreases the amount of solvent required for the extraction. The dried samples were ground to coarse powder with a mechanical grinder (Blender) and powdered samples were kept in clean closed containers pending extraction. During grinding of samples, the grinder was thoroughly cleaned to avoid contamination with any remnant of previously ground material or other foreign matter deposited on the grinder.
Maceration of dried powdered sample: After getting the sample as dried powdered, the sample (500 Gram) was then soaked in 1000 ml of methanol for 5 days, the process is known as maceration technique. A glass made jar with plastic cover was taken and washed thoroughly with ethanol and dried. Then the dried powder sample was taken in the jar. After that methanol (1000 ml) was poured into the jar up to 1-inch height above the sample surface as it can sufficiently cover the sample surface. The plastic cover with aluminum foil was closed properly to resist the entrance of air into the jar. This process was performed for 5 days. The jar was shaked in several times during the process to get better extraction.
Filtration of the extract: After the extraction process the plant extracts was filtered with sterilized cotton filter. The cotton was rinsed with ethanol and fitted in a funnel. The filtrate was collected in a beaker. Then again it was filtered and this time What man’s filter was used for getting more clear extract which would be useful making the sample more concentrate in Rotary Evaporation Technique. Then the filtrate was taken into a volumetric flask and covered with aluminum foil paper and was prepared for rotary evaporation.
Sample concentration by rotary evaporation technique: After the filtration process two parts were obtained namely ‘residue part’ and ‘filtered part or filtrate’. The filtrate part, which contains the substance soluble in methanol, was putted into a 1000 ml round bottom flask (BOROSOL) and then the flask was placed in a rotary evaporator. The evaporation was done at 45 degree Celsius temperature. The number of rotation per minute was selected as 130 RPM. The pressure of the vacuum pumper machine (Biometra) was 6 bars. The water flow through the distillation chamber was also provided in a satisfactory flow rate. When the evaporation seemed to be satisfactory, then the methanol extract was collected in a 100 ml beaker. The evaporator flask was rinsed by diethyl ether. Then the beaker was covered with aluminum foil paper and kept on the water bath for 60 minutes and the temperature of water bath maintained as 50' C. Finally the concentrated methanol extract was found and stored in the laboratory refrigerator from which the extract was used for many chemical investigations.
Thin layer chromatography (TLC): Thin layer chromatography is used to separate mixtures of compounds. It gives a qualitative idea about the components that are present in a mixture. The experiment is usually conducted on a sheet of aluminum foil that has been coated with silica. This acts as the stationery phase for the mixture. The solvent or solvent system that runs on the stationery phase by capillary action and conducts the separation, this is known as the mobile phase. Once the sample has been spotted on the plate and the mobile phase run through it, the different components of the mixture separate differently owing to their relative affinities for the stationery and mobile phases. Heavier components or the ones more attracted to the stationery phase remain at the bottom while components that are light and more soluble in the mobile phase travel up with it. The relative separation of the components can be studied by calculating the Retention Factor (Rf), which is the ratio of the distance of migration of a particular substance to the distance of migration of the solvent front.
Using a pencil the baseline and the solvent front line was drawn on the TLC plate and the plate was labeled for the individual spots. The fraction of methanol extract after Vacuum Liquid Chromatography (VLC) and Column Chromatography was spotted on TLC plate and the plate was dried completely in the air. In a TLC tank the solvent system was added. The lid of the tank was closed and left to rest for a few minutes so that the solvent system could travel up the filter paper and saturate the chamber. The TLC plates were placed in the tank carefully so that the baseline did not touch the solvent. The plate was left in the tank so that the solvent system could run up the plate by capillary action and develop the spots. The plate was removed from the tank once the solvent had reached the solvent line. The plate was then allowed to dry completely. Three types of solvent system were used based on difference in polarity for the detection of different compounds. The developed plate was then viewed under UV light for the detection of bands and spots.
9 ml of distilled water was added to 1 ml of concentrated sulfuric acid to produce a 10% solution of sulfuric acid which was taken in a Petri dish. The TLC plate was dipped in this solution using tweezers with the silica face down. The plate was left in the open for 10 minutes to allow for drying. A hot plate was heated to about 90 degree C and the plates were heated until the spots developed.
Column chromatography: Column chromatography is basically a type of adsorption chromatography techniques. Here the separation of components depends upon the extent of adsorption to stationary phase. Here the stationary phase is a solid material packed in a vertical column made of glass or metal. The solution of the mixture to be separated is first allowed to be absorbed at the top most part of a column of adsorbent moderately tightly packed in a glass or metallic tube. The compound mixture is then pushed through, that is, the column is developed with a suitable organic solvent, called eluent. The components of the mixture are resolved into separate bands as they move down the column. The separated bands move down the column at different speeds due to their variable affinity for the adsorbent (the stationary phase) and the developing solvent (the mobile phase). As more eluent is added and allowed to percolate through the column the separated bands of the mixture are successively eluted from the column. Each of such eluted solution is called an elute, which normally represents the solution of one component of the mixture[2].
Mobile phase = solvent moving through the column.
Stationary phase = substance that stays fixed inside the column.
Eluent = fluid entering the column.
Elute = fluid exiting the column.
A column of appropriate size was chosen. The length of column was 2.5 cm and the diameter of column was 39 cm. Here, the adsorbent that are used as stationary phase is Silica Gel. Required amount of silica gel was added in sample (methanol extract of Artocarpus heterophyllus seed) and kept it for dry. Column was set in a stand and washed it through a solvent. In another beaker 30 g silica gel added in 100 ml n-hexane and gave it in column. N-hexane solvent put into the column to form column bed. Then the dry sample was added into column and gently packed into column. Then the different solvent according to the polarity (100% DCM, 80% DCM + 20% methanol, 60% DCM + 40% methanol, 40% DCM + 60% methanol, 20% DCM + 80% methanol) was selected. The mobile phase is poured into the column over the sample. A collecting beaker is placed at the bottom of column near the end to collect the elute. About 2 ml of elute was collected in a test tube.
Vacuum liquid chromatography: At first sample from rotary was mixed with required amount of silica gel and filled in a sintered glass funnel of the appropriate size. Vacuum is applied and the surface is pressed firmly to give a completely level, well compacted bed approximately 4.5 – 5.5 cm high. Then solvents were poured into sintered glass funnel according to their polarity, non-polar solvents were poured first then polar solvent poured. The mixture was separated according to the polarity of solvents. Fractions were collected separately and fractions are monitored by TLC. Five solvents (N-hexane, Di-chloro-methane (DCM), n-butanol, Ethyl acetate and Methanol) were used (from non-polar to polar). Each solvent measured = 100 ml
Anti-oxidant activity: The 1,1-diphenyl-2-picrylhydrazyl radical (DPPH) has been widely used to evaluate the free radical scavenging capacity of antioxidants. DPPH free radical is reduced to the corresponding hydrazine when it reacts with hydrogen donors. DPPH can make stable free radical in aqueous or methanol solution. With this method it was possible to determine the antiradical power of an antioxidant activity by measurement of the decrease in the absorbance of DPPH at 517 nm[3]. The odd electron in the DPPH free radical gives a strong absorption maximum at 517 nm and is purple in color. This molecule gets reduced to a yellow to colorless form when it takes up one hydrogen free radical from a free radical scavenging antioxidant to form DPPH-H, which is a stable molecule. The presence of greater amounts of antioxidants in the sample causes a greater reduction of DPPH and this can be used to monitor antioxidant activity by increasing the amount of samples. With increasing concentration samples, the absorbance of DPPH at 517 nm drops. A blank is prepared by adding DPPH to only the solvent and not the sample. The percentage antiradical scavenging activity is calculated by the following formula-
DPPH % antiradical scavenging activity = 1 – (Absorbance of sample / Absorbance of Blank) × 100.
8 mg of DPPH was accurately weighed and dissolved in 20 ml of methanol. The concentration of this solution was 400 μg/ml. This step was carried out in dark place since DPPH is highly light sensitive. The prepared DPPH solution was kept in dark place for 30 min.
5 mg of ascorbic acid was weighed and taken in a volumetric flask, dissolved in distilled water and the volume was made up to 50 ml by distilled water. The concentration of this solution was 100 μg/ml.
5 test tubes were labeled as 0.5ml, 1ml, 1.5ml, 2ml and 2.5ml. These volume of the solution were taken into the test tubes and made up to 5ml where required with distilled water. The concentrations of the test tubes were 10 μg/ml, 20 μg/ml, 30 μg/ml, 40 μg/ml, 50 μg/ml respectively. One test tube containing only 5 ml water was taken as blank. In a dark room, 100 μl of the DPPH solution was added to each of the test tubes and the test tubes were left in the dark for 30 minutes.
3 mg of crystal of husk was taken in a volumetric flask, to dissolve in (50% chloroform + 50% methanol) and the volume was made up to 30 ml by (50% chloroform + 50% methanol). The concentration of this solution was 100 μg/ml.
5 test tubes were labeled as 0.5ml, 1ml, 1.5ml, 2ml and 2.5ml. These volume of the crystal solution were taken into the test tubes and made up to 5ml where required with (50% chloroform + 50% methanol). The concentrations of the test tubes were 10 μg/ml, 20 μg/ml, 30 μg/ml, 40 μg/ml, 50 μg/ml respectively. 5 ml (50% chloroform + 50% methanol) was taken as blank.
In a dark room, 100 μl of the DPPH solution was added to each of the ten test tubes and the test tubes were left in the dark for 30 minutes. Using an UV- spectrophotometer the absorbance of these solutions was measured at 517 nm. The absorbances were recorded and percentages of inhibition were calculated by above formula. A linear regression curve was established in order to calculate the IC50 (μg/ml) which is the amount of sample necessary to decrease by 50 % the absorbance of DPPH.
In Vitro anti-diabetic test: Glycation is the key molecular basis of several diabetic complications like diabetes retinopathy, nephropathy, neuropathy and some cardiovascular diseases. Glycation End Products and the Plants derived agents with the anti-glycation and antioxidant activities are highly important in preventing diabetic complication. Antidiabetic activity of seed and husk of Artocarpus heterophyllus Lam. were investigated by glucose uptake in yeast cell. Yeast cells were prepared according to the method of Yeast cells[4]. Briefly, commercial baker’s yeast was washed by repeated centrifugation (3,000 × g; 15 min) in distilled water until the supernatant fluids were clear and a 50% (v/v) suspension was prepared in distilled water. Various concentrations of isolated constituents (1 mg) after VLC were added to 1 ml of glucose solution (10 mM) and incubated together for 10 min at 37°C. Reaction was started by adding 100 μl of yeast suspension, vortex and further incubated at 37°C for 60 min. After 60 min, the tubes were centrifuged (2,500 × g, 5 min) and glucose was estimated in the supernatant. Vildagliptin was taken as standard drug. The percentage increase in glucose uptake by yeast cells was calculated using the following formula-
Increase in glucose uptake (%) = (Abs. of sample – Abs. of control) / Abs. of sample × 100
Where, Abs. of control is the absorbance of the control reaction (containing all reagents except the test sample) and Abs. of sample is the absorbance of the test sample. All the experiments were carried out in triplicates.
Anti-microbial test: The agar diffusion test, or the Kirby-Bauer disk-diffusion method, is a means of measuring the effect of an antimicrobial agent against bacteria grown in culture[5]. The bacteria to be used are swabbed uniformly across a culture plate. A filter-paper disk, impregnated with the compound to be tested, is then placed on the surface of the agar. The compound diffuses from the filter paper into the agar. The concentration of the compound will be highest next to the disk, and will decrease as distance from the disk increases. If the compound is effective against bacteria at a certain concentration, no colonies will grow where the concentration in the agar is greater than or equal to the effective concentration. This is the zone of inhibition. Thus, the size of the zone of inhibition is a measure of the compound’s effectiveness: the larger the clear area around the filter disk, the more effective the compound[6]. The amount of nutrient agar needed was calculated and added to distilled water is an agar bottle and mixed thoroughly. It was then autoclaved to dissolve the agar and sterilize it. In order to avoid any type of contamination and cross contamination by the test organisms the antimicrobial screening was done in Laminar Hood and all types of precautions were highly maintained. UV light was switched on one hour before working in the Laminar Hood. Petridish and other glassware were sterilized by autoclaving at a temperature of 121ºC and a pressure of 15-lbs/sq. inch for 20 minutes. Micropipette tips, cotton, forceps, blank discs etc. were also sterilized.
The test organisms were transferred from the subculture to petri dish containing the required amount of melted and sterilized agar medium as required by the size of the dish. The bacterial and fungal suspension was taken by a loop and mixed with normal saline with the help of vortex machine. Then a sterilized cotton bud was taken and dipped into the bacterial/ fungal suspension. Then the bacterial/fungal sample is applied to the petri dish with the help of this cotton bud. The swabbing was done carefully so that the microorganisms would be spread out evenly on the dish. These were used as positive control to ensure the activity of standard antibiotic against the test organisms as well as for comparison of the response produced by the known antimicrobial agent with that of the test sample. In this investigation Ciprofloxacin (30 μg/disk) standard disk was used as the reference.
Measured amount of each test sample was dissolved in specific volume of solvent to obtain the desired concentrations in an aseptic condition. For the samples, a stock solution of 1000 μg/μl was prepared respectively by dissolved in (50% Methanol and 50% chloroform) and were used directly. Sterilized metrical (BBL, Cocksville, USA) filter paper disks were taken in a blank Petri dish under the laminar hood. Then disks were soaked with solutions of 20 μl of test samples and dried.
The sample disks and the standard antibiotic disks were placed gently on the previously marked zones in the agar plates pre-inoculated with test bacteria and fungi. The plates were then inverted and kept in an incubator at 37°C for 24 hours. The antimicrobial potency of the test agents are measured by their activity to prevent the growth of the microorganisms surrounding the discs, which gives clear zone of inhibition. After incubation, the antimicrobial activities of the test materials were determined by measuring the diameter of the zones of inhibition in millimeter with a transparent scale.
UV-visible spectrophotometric scanning of crystals of husk & tegmen of methanol extract: Ultraviolet-visible spectrophotometry (UV-Vis) related to the spectroscopy of photons in the UV-visible region. UV-visible spectroscopy uses light in the visible ranges or its adjacent ranges. The color of the chemicals involved directly affects the absorption in the visible ranges. Molecules undergo electronic transitions in these ranges of the electromagnetic spectrum[7]. Over a short period of time, the spectrometer automatically scans all the component wavelengths. The ultraviolet (UV) region scanned is normally from 200 to 400 nm, and the visible portion is from 400 to 800 nm. Crystal was taken in powder form. 3 mg of dried crystal of husk and tegmen of methanolic extract of the Artocarpus heterophyllus seed was taken in a test tube and 3 ml of (methanol + chloroform) and DMSO (Dichloromethane sulfoxide) was added respectively to make a 1mg / ml solution. 500 μl of this solution was used for subsequent dilution until the stock solution had been diluted by 100 times. The concentration of the solution was then 0.01 mg/ml using a UV-Visible spectrophotometer the crystal was subjected to scanning in the range of 200 nm to 800 nm. To find λ max, the wavelength was set on the Lambda UV spectrometer (Shimadzu, Japan) and the maximum absorbance was calibrated using separate blanks for each extracts. The sample solutions were inserted one after another and wavelength of 800 to 200 nm was passed. The wavelength at which the absorbance was maximum was recorded. A plot of absorbance versus wavelength shows λ max. The graph of scanning and the corresponding values of absorbance were recorded[8].
Infrared Spectroscopy: Infrared spectroscopy is one of the most important analytical techniques available to today’s scientists. Infrared spectroscopy is a technique based on the vibrations of the atoms of a molecule. An infrared spectrum is commonly obtained by passing infrared radiation through a sample and determining what fraction of the incident radiation is absorbed at a particular energy. The energy at which any peak in an absorption spectrum appears corresponds to the frequency of a vibration of a part of a sample molecule. One of the most common applications of infrared spectroscopy is to the identification of organic compounds[9]. Transmission spectroscopy is the oldest and most straightforward infrared method. This technique is based upon the absorption of infrared radiation at specific wavelengths as it passes through a sample. It is possible to analyze samples in the liquid, solid or gaseous forms when using this approach. There are three general methods used for examining solid samples in transmission infrared spectroscopy; i.e. Alkali halide discs, mulls and films. The use of alkali halide discs involves mixing a solid sample with a dry alkali halide powder[9]. In our study we used alkali halide discs to identify our extract. Here potassium bromide was used as the transmitting agent.
3 mg of powder of crystal of seed and husk was accurately weighed and grinded uniformly with 200 mg KBr powder in an agate mortar. The mixture was then subjected to a pressure of about 10 ton in −2 (1.575 × 10⁵ kgm−2) in an evacuated die. This sintered the mixture and produces a clear transparent disc. The three discs were then put into the IR spectrometer separately. (250 - 4000) wavelengths were passed and the detected signal and the corresponding values were recorded (Stuart, B., 2004).
Results
Thin layer Chromatographic
Thin layer chromatographic analysis using different fraction of methanolic extract of Artocarpus heterophyllus seeds (Tegmen) and husk after crystal formation. (Figure: 1.1 & 1.2) The Rf value was calculated as:
Rf = Distance spot travels / Distance solvent travels.
Rf value of seed= 1.8/5.1 = 0.35
Rf value of vildagliptin = 2.2/5.1 = 0.4
Rf value of husk = 4.6/5.1 = 0.9
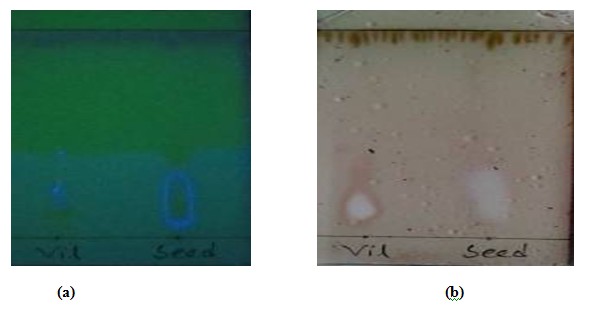
Figure 1.1: Thin layer chromatographic analysis of seed in (a) under UV spectrophotometer and (b) after charring with 10% H2SO4.
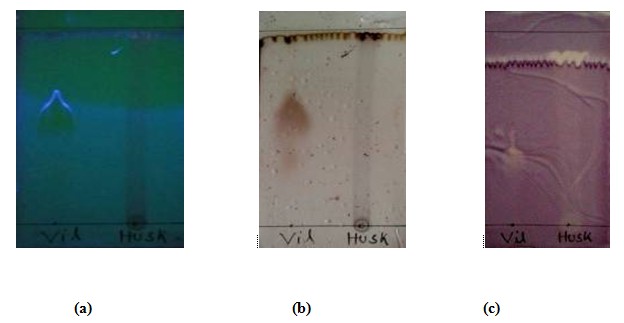
Figure 1.2: Thin layer chromatographic analysis of husk in (a) under UV spectrophotometer (b) after charring with 10% H2SO4 (c) after soaked in 0.4% DPPH solution.
UV-Visible Spectroscopy The spectrum of wavelength vs. Absorbance of crystal of tegmen and crystal of husk of methanolic extract of the Artocarpus heterophyllus seed were obtained from the UV-Visible spectrophotometer. 282 nm was found to be the λ max of tegmen of methanolic extract of the Artocarpus heterophyllus seed 218 nm was found to be the λ max of husk of methanolic extract of the Artocarpus heterophyllus seed. (Figure: 2.1 & 2.2)
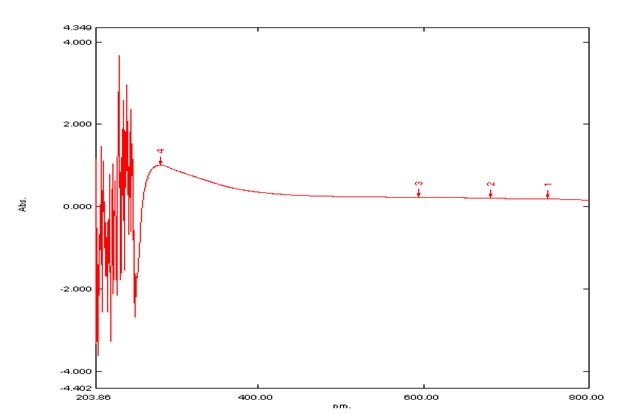
Figure 2.1: The graph of Wavelenght vs. Absorbanc of Tegnen of methanolic extract of the Artocarpus heterophyllus seed.
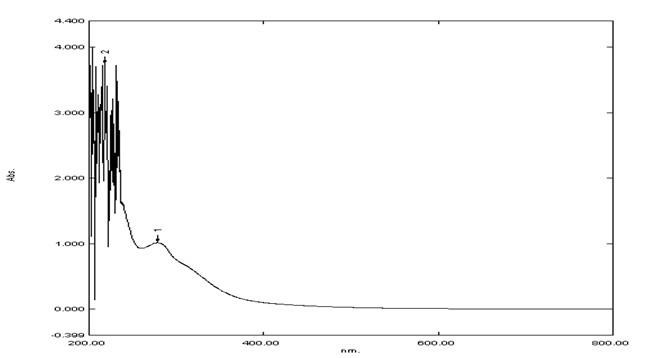
Figure 2.2: The graph of Wavelength vs. Absorbance of Husk of methanolic extract of the Artocarpus heterophyllus seed.
IR Spectroscopy
IR spectrum gives the idea about the functional group present in the compounds. A compound can be identified by analyzing the IR spectrum of that compound with the IR spectrum of some known reference standard. So, here we tried to get an idea about the functional groups present in the husk and tegmen. There were lots of stretching found in the IR spectrums of both husk and tegmen as broad and intense spectrum. From analyzing the IR spectrum of crystal of both husk and tegmen of methanolic extract of of Artocarpus heterophyllus seed, crystal of husk shows four peaks ranges from (1000 - 1250), (2000 - 2500), (2500 - 3000), (3000 - 3500) that may be indicates the presence of C-O, Ar-O, C-F, C-N, C≡C, C≡N, O-H (carboxylic acid), N-H, O-H (alcohol), ≡C-H (terminal alkyne), =C-H(alkene or arene). Crystal of tegmen shows four peaks ranges from (500 - 750), (1000 - 1250), (3000 - 3500), (3500 - 4000) that may be indicates the presence of C-I, C-Cl, C-Br, Phenyl group, C-O, Ar- O, N-H, O-H (alcohol), ≡C-H (terminal alkyne), =C-H (alkene or arene). (Figure: 3.1 & 3.2)
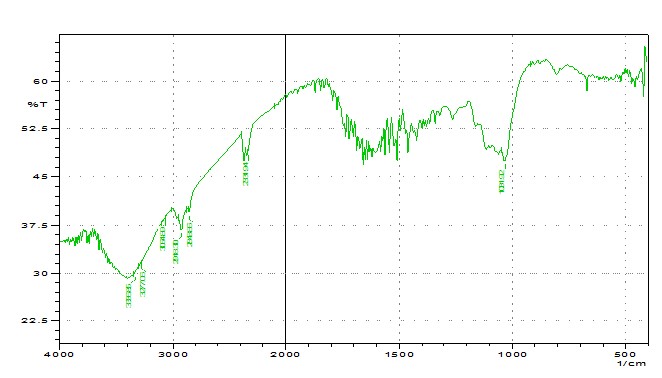
Figure 3.1: IR spectrum of Husk.
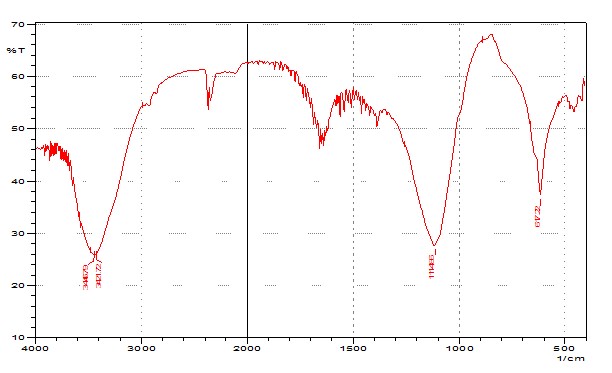
Figure 3.2: IR spectrum of Seed.
Anti-diabetic Activity
The result of anti-diabetic test of crystal of tegmen and husk of methanolic extract of the Artocarpus heterophyllus seed and standard vildagliptin are given in below: (Table: 1.1, 1.2 & 1.3) (Figure:4)
Table 1.1: Antidiabetic activity of crystal of Tegmen of Artocarpus heterophyllus seed.
| Sample Name | Concentrations μg/ml | Absorbance (340 nm) | % inhibition |
|---|---|---|---|
| Tegmen | 31.25 | 0.270 | 01% |
| 62.5 | 0.286 | 06% | |
| 125 | 0.296 | 09% | |
| 250 | 0.326 | 18% | |
| 500 | 0.600 | 55% |
Table 1.2: Antidiabetic activity of crystal of Husk of Artocarpus heterophyllus seed.
| Sample Name | Concentrations μg/ml | Absorbance (340 nm) | % inhibition |
|---|---|---|---|
| Husk | 31.25 | 0.295 | 0.6 |
| 62.50 | 0.320 | 09 | |
| 125 | 0.338 | 13 | |
| 250 | 0.345 | 15 | |
| 500 | 0.358 | 18 |
Table 1.3: Antidiabetic activity of standard Vildagliptin.
| Sample Name | Concentrations μg/ml | Absorbance (340 nm) | % inhibition |
|---|---|---|---|
| Vildagliptn | 31.25 | 0.246 | 05 |
| 62.50 | 0.273 | 14 | |
| 125 | 0.278 | 16 | |
| 250 | 0.300 | 22 | |
| 500 | 0.585 | 60 |
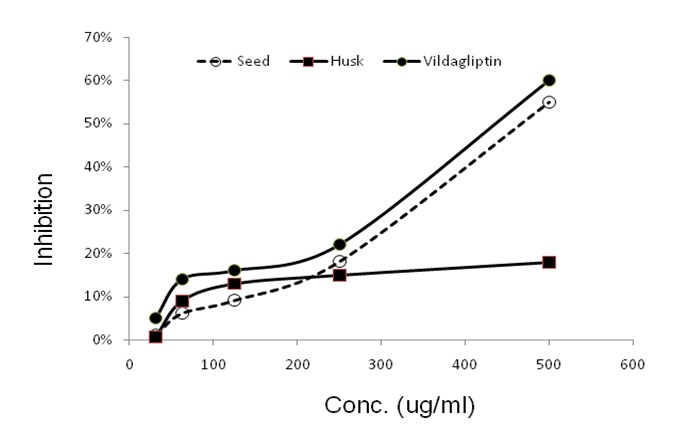
Figure 4: Comparison anti diabetic activity of seed, husk and standard vildagliptin.
Anti-oxidant Activity
DPPH test was carried out with standard solution of ascorbic acid, sample solution of isolated crystal from husk. The concentrations of the solutions ranged from (10 - 50) μg/ml. After being incubated with DPPH for 30 min, the absorbance of all solutions were taken at 517 nm. The percentage of inhibition was calculated from the following equation:
DPPH % free scavenging activity = (1 - Absorbance of sample/ Absorbance to blank) × 100
The tests were carried out on duplicate. The results are given below (Table 2.1 & 2.2) (Figure: 5)
Table 2.1: Percentage of Inhibition of Ascorbic Acid
| Sample name | Concentration (μg/ml) | Absorbance | Average % of inhibition ± SEM | IC50 (μg/ml) |
|---|---|---|---|---|
| Blank | - | 0.279 | - | 24.69 |
| Ascorbic 1 | 10 | 0.193 | 30.82 ± 3.81 | |
| Ascorbic 2 | 20 | 0.143 | 48.75 ± 4.44 | |
| Ascorbic 3 | 30 | 0.112 | 59.86 ± 2.84 | |
| Ascorbic 4 | 40 | 0.095 | 65.95 ± 0.28 | |
| Ascorbic 5 | 50 | 0.084 | 69.89 ± 1.99 |
Data are presented as mean values ± standard error of mean (±SEM).
Table 2.2: Percentage of Inhibition of crystal of Husk
| Sample name | Concentration (μg/ml) | Absorbance | Average % of inhibition ± SEM | IC50 (μg/ml) |
|---|---|---|---|---|
| Blank | - | 0.230 | - | 38.81 |
| Husk | 10 | 0.222 | 03.62 ± 10.5 | |
| 20 | 0.176 | 23.47 ± 2.8 | ||
| 30 | 0.142 | 38.26 ± 9.2 | ||
| 40 | 0.099 | 56.95 ± 8.7 | ||
| 50 | 0.087 | 62.17 ± 12.9 |
Data are presented as mean values ± standard error of mean (±SEM).
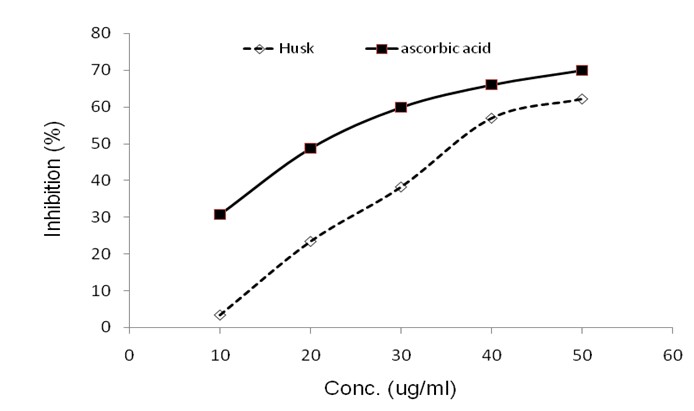
Figure 5: Graph of Concentration vs. Mean percentage of inhibition of ascorbic acid with standard error; y = 0.9534x + 26.452, R2= 0.9191 and Graph of Concentration vs. Mean percentage of inhibition of Husk of methanolic extract of the Artocarpus heterophyllus with standard error; y = 1.5028x - 8.332, R2= 0.9734.
Antimicrobial Screening
One species of Gram positive, one species of Gram negative bacteria and one species of fungi were used in this test. The positive control used was Ciprofloxacin (30 μg/disk). The zones of inhibition for the microbes were measured in millimeters using a transparent ruler after 24 - 48 hrs incubation. The test was carried out in duplicates. The results are as follows: (Table: 3) (Figure: 6)
Table 3: Zone of inhibition in presence of husk and seed extract
| Nature of bacteria | Name of the microorganisms | Zone of inhibition (mm) of Husk | Zone of inhibition (mm) of Tegmen | Positive control (Ciprofloxacin) |
|---|---|---|---|---|
| Gram(+) | Bacillus cereus | 10.6 ± 0.4 | 7 ± 0.8 | 17.5 ± 6.36 |
| Fungi | Candia albicans | 10 ± 0.8 | 6.6 ± 0.4 | 17.5 ± 0.71 |
| Gram (-) | E.coli | 8 ± 0.8 | 7.6 ± 1.2 | 17 ± 1.41 |
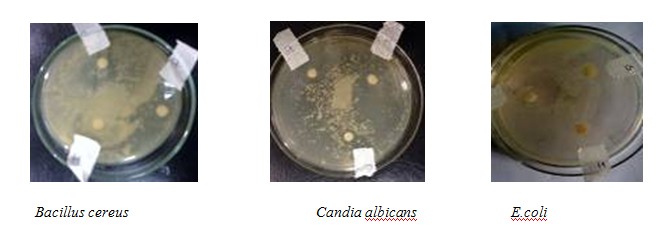
Figure 6: Zone of inhibition caused by extract of seed and husk in comparison with standard antibacterial agents.
Discussion
The sky blue spot present in the plate indicates the presence of valuable compound in the crystal of Tegmen and crystal of husk of Artocarpus heterophyllus seed those were spotted against an anti-diabetic drug (Vildagliptin). Rf value of seed = 1.8 / 5.1 = 0.35 and Rf value of husk = 4.6 / 5.1 = 0.9 against the Rf value of vildagliptin = 2.2 / 5.1 = 0.4. The formation of sky blue spot on the plate (crystal of tegmen) and dark sky blue spot (Vildagliptin) indicates the extensive presence of valuable compounds which may can maintain the glucose level in blood. The Rf value of both crystal of tegmen & vildagliptin is nearly same, but they flurosence at two different color (sky blue, dark sky blue). From which we can have a preliminary idea of the valuable compounds that may be present in the methanolic extract of Atocarpus heterophyllus seeds. IR spectrum of the compound isolated from tegmen also suggests the presence of vildagliptin like molecules. UV spectrum of that compound indicates the presence of pure compound in the crystal. In the TLC plate of Husk, the formation of yellow and brown colour on the plate after DPPH solution was indicates that the crystal of Husk of methanolic extract of Artocarpus heterophyllus seed contains antioxidant compounds that contain free radical scavenging properties.
The Artocarpus heterophyllus was observed to possess a significant antiglycation activity and may be used as a traditional medicine in the management of chronic diabetes mellitus (Deve, et al., 2014). A dynamic study was carried out to determine several pharmacognostic parameters and examine traditional claims for the anti-diabetic activity of the plant. Extracts of A. heterophyllus leaves decreases the blood glucose levels statistically significantly (P < 0.01)[1]. Another study showed about antidiabetic activity of Artocarpus heterophyllus Bark extracts used as edible medicine by local tribal population of Vellore districts were analyzed in streptozotocin induced diabetic rats. Hypoglycemic activities of extract treated diabetic rats were assessed by the percentage reduction in fasting blood glucose level[1]. In our study, we use Glucose uptake in Yeast cells method. In the Glucose uptake in Yeast cells method, the mechanism of glucose transport across the yeast cell membrane has been receiving attention as in vitro screening method for hypoglycaemic effect of various compounds / medicinal plants. It is reported that in yeast cells (Saccharomyces cerevisiae) glucose transport is extremely complex and it is transported in yeast is by a facilitated diffusion process.In our result, crystal of tegmen of Artocarpus heterophyllus seed showed highest (55%) anti-diabetic activity compared to crystal of husk of Artocarpus heterophyllus seed (18%). Anti-diabetic activity of crystal of tegmen of Artocarpus heterophyllus seed was increased when the concentration of the sample was increased. This Anti-diabetic activity of crystal of tegmen of Artocarpus heterophyllus seed showed less anti-diabetic effect compared to our standard sample, Vildagliptin; which showed 60% anti-diabetic activity at highest concentration.
The leaf extracts of Artocarpus heterophyllus (jack fruit) showed antioxidant activity. The 70% ethanol (JFEE), n-butanol (JFBE), water (JFWE), chloroform (JFCE), and ethyl acetate (JFEAE) extracts were obtained. Both JFEE and JFBE markedly scavenge diphenylpicrylhydrazyl radical and chelate Fe+2[10]. The four different seed extracts (ethanol, acetone, ethyl acetate, and water ) of Artocarpus heterophyllus showed effective flavonoids content, reducing potential and antioxidant activity due to the presence of high amount of phenolic compounds[11]. In another study, polyphenolic content and antioxidant properties of dichloromethane: methanol (1:1) extract of jackfruit seeds was found to be high. Results indicated jackfruit seeds to be a good source of antioxidant component[12]. In our study to evaluate the antioxidant activities, DPPH Free Radical Scavenging Assay was used. DPPH reaction has been widely used to test the ability of compounds to act as free-radical scavengers or hydrogen donors and to evaluate the antioxidant activity of foods and plant extracts. DPPH is a stable free radical that can accept an electron of hydrogen radical to become diamagnetic molecule. The reduction in DPPH radical was determined by the decrease of its absorbance at 517 nm (in methanol) induced by antioxidants[13]. In this study, the crystal of husk of methanolic extract of Artocarpus heterophyllus seed showed the highest anti-oxidant activity 62.17% at 50 μg/ml concentration. Compared to standard ascorbic acid, it showed 69.89% anti-oxidant activity at 50 μg/ml concentration. It showed the lowest anti-oxidant activity 03.62% at 10 μg/ml concentration and standard ascorbic acid showed 30.82% anti-oxidant activity at 10 μg/ml concentration.
Methanolic extracts of A. heterophyllus bark showed the best antibacterial activity against Bacillus subtilis and Pseudomonas fluorescen[14]. The crude methanolic extracts of the stem and root barks, stem and root heart-wood, leaves, fruits and seeds of Artocarpus heterophyllus and their subsequent with dichloromethane, ethyl acetate and butanol gave fractions that exhibited a broad spectrum of antibacterial activity. The butanol fractions of the root bark and fruits were found to be the most active. None of the fractions were active against the fungi tested (Khan, et al. 2003). Escherichia coli, Pseudomonas and staphylococcus aureus strains were found to be sensitive to essential oils obtained from plant and showed a very effective bactericidal activity[15]. The bark and stipule samples of Artocarpus heterophyllus (Jack fruit), Artocarpus hirsutus (Wild jack), and Artocarpus altilis (Bread fruit) extracted with acetone, distilled water, ethanol, chloroform, petroleum ether and benzene against various clinical pathogens like Escherichia coli, Pseudomonas aeruginosa, Salmonella typhi and Bacillus subtilis showed antibacterial properties. In our study,zone of inhibition of husk was 10.6 ± 0 mm against gram (+) bacteria, Bacilluscereus, where zone of inhibition of seed was 7 ± 0.8 mm and standard Cipro floxacin showed 17.5 ± 6.36 mm zone of inhibition. Zone of inhibition of husk was 10 ± 0.8 mm against fungi, Candia albicans, where zone of inhibition of seed was 6.6 ± 0.4 mm and standard Ciprofloxacin showed 17 ± 0.71 zone of inhibition. Also the zone of inhibition of husk was 8 ± 0.8 mm and the zone of inhibition of seed was 7.6 ± 1.2 mm against gram (-) bacteria, E.coli and standard Ciprofloxacin showed 17 ± 1.41 mm zone of inhibition.
Conclusion
The present study discusses the significance of Artocarpus heterophyllus as a valuable source for medicinally important compounds besides its seed which is a store house of minerals, vitamins, antioxidants and other nutrients. It provides rich opportunities for Artocarpus spp. especially from the fresh fruits of Artocarpus heterophyllus. Therefore, The present study on the crystal of tegmen and crystal of husk of methanolic extract of the Artocarpus heterophyllus seed showed the potentiality as an antioxidant, in vitro anti-diabetic activities and antibacterial activity. Besides, the crystal of tegmen showed anti-diabetic activity and crystal of husk showed anti-oxidant activity. In these study, crystal of husk also showed more anti-bacterial activity than crystal tegmen. So, the isolated compounds may be used as future therapeutic tools if further therapeutic investigations are carried out.
References
- 1. Jagtap, U.B., Bapat, V.A. Green synthesis of silver nanoparticles using Artocarpusheterophyllus Lam. Seed extract and its antibacterial activity. (2013) Industrial Crops and Products 46: 132-137.
- 2. Ghani, A. Textbook of Pharmacognosy. (2003) Institute of Medical Technology 268-269.
- 3. Jagtap, U.B., Bapat, V.A. Artocarpus: A review of its traditional uses, phytochemistry and pharmacology. (2010) J Ethnopharmacol 129(2): 142-166.
- 4. Kotowaroo, M.I., Mahomoodally, M.F., Gurib-Fakim, A., et al. Screening of traditional antidiabetic medicinal plants of Mauritius for possible alpha-amylase inhibitory effects in vitro. (2006) Phytother Res 20(3): 228-231.
- 5. Kowti, R., Haresh, A. R., Harsha, R., et al. In vitro free radical scavenging activity of leaves of Spathodea campanulata P. Beauv. (2010) Int J Drug Dev & Res 2(3): 622-628.
- 6. Prieto, P., Pineda, M., Aquilar, M. Spectrophotometric quantitation of antioxidant capacity through the formatoin of a phosphomolybdinum complex specific application to the determination of vitamin E. (1999) J Anal Biochem. 269(2): 337-341.
- 7. Gunasekaran, S. UV-VIS Spectroscopic Analysis of Blood Serum. (2003) Asian J Microbiolo Biotechnolo Environ Sci 5(4): 581-582.
- 8. Saxena, M., Saxena, J. Evaluation of phytoconstituents of AcorusCalamus by FTIR and UV-VIS spectroscopic analysis. (2012) Int J Biolog & Pharmac Res. 3(3): 498-501.
- 9. Stuart, B. Infrared Spectroscopy: Fundamentals and Applications. (2004) John Wiley & Sons 1-244.
- 10. Omar, H.S., El-Beshbishy, H.A., Moussa, Z., et al. Antioxidant Activity of Artocarpus heterophyllus Lam. (Jack Fruit) leaf extracts: remarkable attenuations of hyperglycemia and hyperlipidemia in streptozotocin-diabetic rats. (2011) Scientific World Journal 11: 788–800.
- 11. Shanmugapriya, K., Saravana, P.S., Payal, H., et al. Antioxidant activity, total phenolic and flavonoid contents of Artocarpus heterophyllus and Manilkara zapota seeds and its reduction potential. (2011) Int J Pharm Pharm Sci 3(5): 256-260.
- 12. Gupta, D., Mann, S., Sood, A., et al. Phytochemical, nutritional and antioxidant activity evaluation of seeds of jackfruit (Artocarpus heterophyllus Lam.). (2011) Int J Phar Bio Sci 2(4): 336-345.
- 13. Yang, Z., Xu, Y., Jie, G., et al. Study on the Antioxidant Activity of Tea Flowers (Camellia sinensis). (2007) Asia Pac J Clin Nutr 16:148-152.
- 14. Binumol, M., Sajitha, T. Phytochemical and antibacterial activity of Artocarpus heterophyllus Lam. and Artocarpus communis Forst. On Bacillus subtilis and Pseudomonas fluorescens. (2013) Int J Sci Eng Res 4(9).
- 15. Jha, S., Srivastava, A.K. Screening of antibacterial activity of the essential oil from seed of Artocarpus heterophyllus. Int J Agric Sci Res 2(3): 92-96.


