
Assessment of Peripheral Blood Tumour Burden in Mycosis Fungoides and Sézary Syndrome
J Yoo1, F Shah1, J Hodson3, A Stevens4, G Wong5, M Cobbold5, J Bryon6, S Chaganti2, F Clark2, M Drayson2, JJ Scarisbrick1*
Affiliation
- 1Department of Dermatology, University Hospital Birmingham, Birmingham, UK
- 2Department of Haematology, University Hospital Birmingham, Birmingham, UK
- 3Wolfson Computer Laboratory, University Hospital Birmingham, Birmingham, UK
- 4Department of Oncology, University Hospital Birmingham, Birmingham, UK
- 5Department of Immunology, University Hospital Birmingham, Birmingham, UK
- 6West Midlands Regional Genetics Laboratory, Birmingham Women’s NHS Foundation Trust, UK
Corresponding Author
Julia Scarisbrick, Department of Dermatology, University Hospital Birmingham, NHS Foundation Trust Birmingham, UK, Queen Elizabeth Hospital Room 48G Nuffield House, 5th Floor B15 2TH, Tel: 44 121 371 5127, Fax: 44 121 460 5845; E-mail: julia.scarisbrick@uhb.nhs.uk
Citation
Scarisbrick, J.J., et al. Assessment of Peripheral Blood Tumour Burden in Mycosis Fungoides and Sézary Syndrome Shows Infrequent Involvement in Early and Tumour Stage Disease. (2015) Cell Immunol Serum Biol 1(1): 6- 12.
Copy rights
©2015 Scarisbrick, J.J. This is an Open access article distributed under the terms of Creative Commons Attribution 4.0 International License.
Keywords
Mycosis Fungoides; Sézary Syndrome; T-cell receptor; Cutaneous T-cell lymphoma; Flow cytometric immunophenotyping
Abstract
Background: Peripheral blood involvement is recognised as an adverse prognostic factor in Mycosis Fungoides (MF) & Sézary Syndrome (SS) which is reflected in the revised staging for MF/SS using blood (B) classification. Various methods exist to assess B classification.
Objective: To assess peripheral blood involvement in MF/SS using T-cell receptor (TCR) analysis, lactate dehydrogenase levels and flow cytometric immunophenotyping.
Methods: 57 consecutive patients with MF/SS assessed at our Cutaneous Lymphoma Centre, University Hospital Birmingham, UK between 2011 and 2014 were identified: 30 with early stage (I-IIA) and 27 with advanced disease (IIB-IV).
Results: In early stage disease, 2/30 (7%) had identical TCR clones in skin and blood compared to 14/27 (52%) in advanced disease (p < 0.001). Abnormal immunophenotyping was found in 7/27 patients (26%) with advanced disease (p = 0.003) which included 6/14 (43%) erythrodermic patients but none in early stage disease. Elevated LDH was the most frequent abnormality occurring in 60% including 39% with early stage disease.
Conclusion: This represents the first study of all stages of MF/SS analysed for peripheral blood involvement. Abnormal immunephenotying is unusual in early or tumour stage disease. TCR gene analysis provides a sensitive detection rate of low level blood involvement in early MF but lacks specificity hence improved sequencing techniques is required such as next generation sequencing. We suggest that standardised TCR gene analysis can be used as a screening tool in all stage MF/SS patients and those with identical clonality or advanced disease patients can be further tested with immunophenotyping.
Introduction
Cutaneous T-cell lymphoma (CTCL) is a clonal lymphoproliferative malignancy involving the skin. Mycosis fungoides (MF) and Sézary syndrome (SS) account for 65% of all CTCL[1,2]. MF patients usually present with early stage disease (stage IA-IIA) consisting of cutaneous patches and plaques and pursue an indolent clinical course with 87% 5-year survival rate[3,4]. However, patients with early stage disease may progress to advanced disease (stage IIB-IVB) with tumours, erythroderma, blood, nodal or visceral involvement[5,6]. Sézary syndrome is an erythrodermic the leukemic variant of CTCL with a median survival of 3 years[7-10].
The initial staging by the Mycosis Fungoides Co-operative Group and the National Cancer Institute (1979) devised a Tumour (T), Node (N), Metastasis (M) classification for staging MF/SS[11]. Later studies demonstrated that significant peripheral blood involvement is an independent prognostic factor regardless of skin (T) or node (N) classification[12-15]. In 2007, the International Society for Cutaneous Lymphomas (ISCL) and European Organisation for Research and Treatment of Cancer (EORTC) revised the staging system for MF/SS and included blood classification using TNMB for overall staging IA-IVB (Table 1). Blood involvement is classified as B0-B2 (Table 2), Where B0 ≤5% circulating atypical lymphocytes, B1 greater than 5% circulating lymphocytes and B2 meets one of the following criteria; >1000/μL or CD4: 8 > 10 or CD4+CD7- > 40% or CD4+CD26- > 30%.
Table 1: ISCL/EORTC revised staging system for MF/SS
| T | N | M | B | |
|---|---|---|---|---|
| IA | 1 | 0 | 0 | 0,1 |
| IB | 2 | 0 | 0 | 0,1 |
| IIA | 1,2 | 1,2 | 0 | 0,1 |
| IIB | 3 | 0-2 | 0 | 0,1 |
| IIIA | 4 | 0-2 | 0 | 0 |
| IIIB | 4 | 0-2 | 0 | 1 |
| IVA1 | 1-4 | 0-2 | 0 | 2 |
| IVA2 | 1-4 | 3 | 0 | 0-2 |
| IVB | 1-4 | 0-3 | 1 | 0-2 |
T1, patches or plaques covering < 10% of the body surface. Further stratified into T1a (patches only) and T1b (plaque +/- patch); T2, patches or plaques equal to or greater than 10% of the body surface. Further stratified into T2a (patches only) and T2b (plaque +/- patch); T3, more than one tumour (equal to or greater than 1cm); T4, erythroderma which means involvement of more than 80% skin
N0, no palpable lymphadenopathy or histological evidence of mycosis fungoides; N1, Clinically abnormal peripheral lymph nodes and histopathology Dutch grade 1 or NCI LN0-2. Further stratified into N1a (clone negative) and N1b (clone positive); N2, clinically abnormal peripheral lymph nodes and histopathology Dutch grade 2 or NCI LN3. Further stratified into N2a (clone negative) and N2b (clone positive); N3, Clinically abnormal peripheral lymph nodes and histopathology Dutch grade 3-4 or NCI LN4 (clone positive or negative); Nx, clinically abnormal peripheral lymph nodes but no histologic confirmation
M0, no visceral involvement; M1, histologically confi rmed visceral involvement.
Table 2: Blood Classification
| Classification | Diagnostic criteria |
|---|---|
| B0a | Absence of significant blood involvement: 5% or less of peripheral blood lymphocytes area atypical (Sézary cells) + Clone negative |
| B0b | Absence of significant blood involvement: 5% or less of peripheral blood lymphocytes area atypical (Sézary cells) + Clone positive |
| B1a | Low blood tumour burden: 5% or more of peripheral blood lymphocytes area atypical (Sézary cells) but does not meet the criteria of B2 + Clone negative |
| B1b | Low blood tumour burden: 5% or more of peripheral blood lymphocytes area atypical (Sézary cells) but does not meet the criteria of B2 + Clone positive |
| B2 | High blood tumour burden: a clonal rearrangement of the TCR in the blood and either: 1. 1.0 K/μL or more Sézary cells or, |
Previous studies have shown that blood tumour burden is an important prognostic factor but this classification has not been tested prospectively. A series of studies have demonstrated that a B2 rating[2], or a hematologic staging of 3 or more (i.e. H3: with more than 1,000/mm³ absolute Sézary count; H4: with more than 10,000/mm³ absolute Sézary count) according to the suggested British Classification[2,15,16] is associated with a poor prognosis. In contrast, Agar et al found that B1 was the most significant cut off for defining a poorer prognostic group in MF/SS[17].
Manual Sézary cell estimates, previously used to assess blood tumour burden in SS, have been superseded by flow cytometry which has been proven to be more reliable in quantifying peripheral blood tumour burden. T-cell clonality can be measured by Southern blot and/or polymerase chain reaction (PCR) analysis of T-cell receptor (TCR) gene rearrangements[2,18] and detect low level blood involvement but do not provide a quantitative measurement. Here we assess the blood classification in patients with all stages of MF and SS and test the clinical utility of flow cytometry and TCR analysis of peripheral blood for detecting blood involvement.
Materials and Methods
A retrospective cross-sectional study was performed reviewing 57 consecutive patients with MF/SS assessed at our Cutaneous Lymphoma Centre, University Hospital Birmingham, UK, between 2011 and 2014. The study population included 51 with MF and 6 with SS. Diagnosis of MF/SS was made based on ISCL/EORTC staging criteria[19] using a combination of clinical, immunohistochemical and histologic findings. From the hospital records, white cell count (WCC), eosinophil count, lymphocyte count and serum lactate dehydrogenase (LDH) level were recorded from the time of clonality and immunophenotyping study. This study was approved via the Research and Development team at University Hospital Birmingham.
Flow cytometric immunophenotying
Peripheral blood was collected in EDTA tube and T-cell phenotyping was performed using FACSCantoII cytometers (BD Biosciences, San Jose, CA) in the MIRHO laboratories (Midlands Integrated Reporting for Haemato Oncology), with data acquisition with FACSDiva software. This included seven different coloured fluochrome-conjugated antibodies in each of five tubes which is the standard panel for investigating new lymphoproliferative disease. These were tube one CD19, CD20, CD5, CD23, CD200, kappa, lambda; tube two CD19, CD27, CD79b, CD10, CD34, CD38, CD45; tube three CD19, CD103, CD11c, CD3, CD25, CD45, CD49d; tube four CD3, TCR gamma delta, CD7, CD2, CD4, CD8, CD45; tube five CD3, CD30, CD57, CD56, CD16, CD8, CD45 (BD Biosciences). Results were assessed by a supervised analysis of serial two dimensional plots and sub-gating procedures. According to the ISCL/EORTC revised staging criteria, loss of CD7 in >40% of CD4+ T cells was used as the most important diagnostic criteria for peripheral blood involvement.
TCR gene rearrangement study
Genomic DNA was extracted from peripheral blood collected in EDTA tube and skin biopsies. TCR β and γ chain gene rearrangements were analysed using the BIOMED-2 clonality assays – ABI Fluorescence Detection (IdentiClone, InVivo Scribe Technologies, San Diego, CA, USA) according to the manufacturer’s instructions[20]. The control gene PCR (Specimen Control Size Ladder master mix) was used to check the DNA quality and we only included the DNA samples which if more than 300bp products were amplified in a control PCR.
A “TCR clone” was considered if dominant peaks, 4 or more times higher than the baseline, were detected in at least 3/5 reactions on the ABI tracing. It was considered non-clonal if it showed an oligoclonal or polyclonal pattern. Results from paired skin biopsies and peripheral blood were cross-referenced to determine the presence of matching clonal peaks.
Statistical Analysis
Comparisons between variables were performed using Fisher’s exact test. Cases with missing data were excluded on a per-analysis basis. All analyses were performed using IBM SPSS Statistics 22 (IBM Corp. Armonk, NY), with p < 0.05 deemed to be indicative of statistical significance.
Results
Patient characteristics
We reviewed 57 consecutive patients diagnosed with MF/SS with a median age of 62 years (range, 48-73 years), of whom 27 (47%) were female and 30 (53%) were male. Of 57 patients, 51 patients had MF and 6 patients had SS. We reviewed disease stage of the patients: 30/57 (53%) with early disease (stage I to IIA) and 27/57 (47%) with advanced disease (stage IIB to IV). Demographics of the study population and their staging are shown in Table 3.
Table 3: Demographics
| Age (Median, Range) | 62 (48 - 73) |
|---|---|
| Gender | |
| Female | 27 (47%) |
| Male | 30 (53%) |
| Stage | |
| IA | 6 (11%) |
| IB | 23 (40%) |
| IIA | 1 (2%) |
| IIB | 8 (14%) |
| IIIA | 7 (12%) |
| IIIB | 0 (0%) |
| IVA1 | 5 (9%) |
| IVA2 | 6 (11%) |
| IVB | 1 (2%) |
| T Classification | |
| T1a | 5 (9%) |
| T1b | 1 (2%) |
| T2a | 9 (16%) |
| T2b | 19 (33%) |
| T3 | 9 (16%) |
| T4 | 14 (25%) |
| N Classification | |
| N0 | 35 (61%) |
| N1 | 4 (7%) |
| N2 | 0 (0%) |
| N3 | 8 (14%) |
| Nx | 10 (18%) |
| B Classification | |
| B0a | 40 (70%) |
| B0b | 10 (18%) |
| B1a | 1 (2%) |
| B1b | 0 (0%) |
| B2 | 6 (10%) |
| M Classification | |
| M0 | 56 (98%) |
| M1 | 1 (2%) |
Skin TCR rearrangement study
All patients (n = 57) had skin samples tested for clonality. A dominant skin clone was found in 45 patients (79%). The rate of positive clonality on skin was not found to differ significantly by disease stage (p = 0.340), although it was higher in advanced disease (IIB-IVB) at 85% compared to early disease (IA-IIA) at 73%. The difference by T-classification was also non-significant (p = 0.710), with rate of 86% in T4, compared to 77% in T1-T3.
Blood TCR rearrangement study
T-cell clonality was assessed in peripheral blood by PCR in all patients (n = 57). Blood TCR identified a clone in 31/57 patients (54%) which was identical to skin dominant clone in 16 out of 57 patients (28%). In early disease, 2/30 patients (7%) had identical skin / blood TCR clones, which was significantly lower than the 14/27 (52%) in patients with advanced disease (p < 0.001). Erythrodermic disease was associated with a significantly higher rate of identical skin / blood TCR clones (p < 0.001), with rates of 64% (9/14) in T4 disease, compared to 16% (7/43) in T1-T3 (Graph 1).
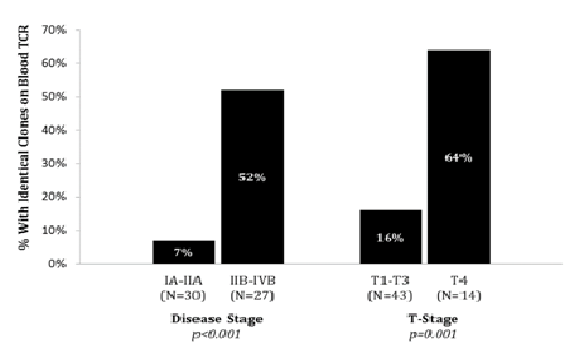
Graph 1: Identical Clone on Blood TCR Gene Rearrangement Study
Flow cytometric immunophenotyping
Flow cytometric immunophenotyping was performed in all patients (n = 57). Abnormal immunophenotyping was only detected in patients with advanced disease (7/27, 26%) (p = 0.003).
In T1-T3 skin classification, only 1 out of 43 patients (2%) had abnormal immunophenotyping compare to 6 of 14 (43%) in erythrodermic CTCL (p < 0.001) (Graph 2).
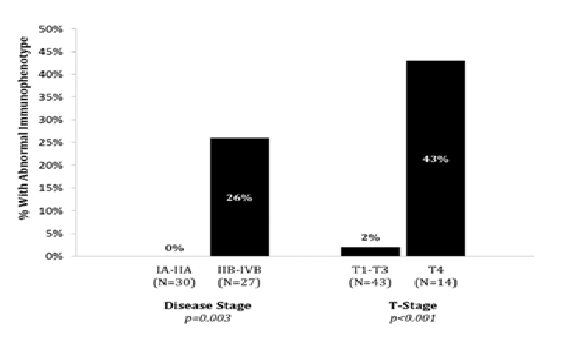
Graph 2: Abnormal Immunophenotying in Overall Stage and Skin (T) Classification
Amongst patients with abnormal immunophenotying (n = 7), all patients had stage IV disease; stage IVA1 (n = 5) and stage IVA2 (n = 2). All 7 patients had identical clones on skin / blood TCR gene rearrangement studies. The CD4:CD8 ratio was greater than 10 in 6 and all 7 patients had raised LDH. WCC and lymphocyte count were raised in 6 of 7 patients (86%) and 2 patients (29%) had raised eosinophil count.
Aberrance in the expression of CD7 was most common. 5/7 patients with abnormal immunophenotyping had CD7 aberrancy and more than 95% of CD4+ T cells also had CD7 aberrancy. In normal immunophenotyping patients, CD4+CD7- T cells did not exceed above 5%. There was no CD30+ T cells in our patients. The abnormal immunophenotyping results are summarised in Table 4.
Table 4: Immunophenotypic features in patients with detectable T cell clones in peripheral blood
| Patient Number | % of CD4+ T cells negative for CD7 | CD4:CD8 ratio | CD2 | CD3 | CD4 | CD5 | CD7 | CD8 | CD16 | CD56 | CD30 |
|---|---|---|---|---|---|---|---|---|---|---|---|
| 1 | 95% | 8.5 | dim+/- | + | + | dim+ | - | - | - | - | - |
| 2 | 100% | 163.2 | + | + | + | + | - | - | - | - | - |
| 3 | 98% | 373.0 | - | dim+ | + | + | - | - | - | - | - |
| 4 | 100% | 43.3 | dim+ | + | + | + | - | - | - | - | - |
| 5 | 33% | 39.0 | - | dim+ | + | + | partial + | - | - | - | - |
| 6 | 96% | 35.5 | + | + | + | + | - | - | - | - | - |
| 7 | 34% | 135 | dim+ | dim+ | + | + | partial+ | - | - | - | - |
(dim – underexpression of antigen, defined as at least 0.25 log difference in intensity between normal positive and aberrant population; partial – discrete negative and positive expression seen for an antigen in the aberrant population)
Blood classification
Blood classification was B0a in 40 patients, B0b in 10 patients, B1a in 1 patient, B1b in no patients and B2 in 6 patients. Graph 3 shows the rate of abnormal immunophenotying in different blood classifications. Rates of abnormal immunophenotying differed significantly across the B classification (p < 0.001), with 1/50 (2%) B0 patients and 6/6 (100%) B2 patients. The patient with abnormal phenotyping and B0 had overall stage IVA2 (T2bN3M0B0).
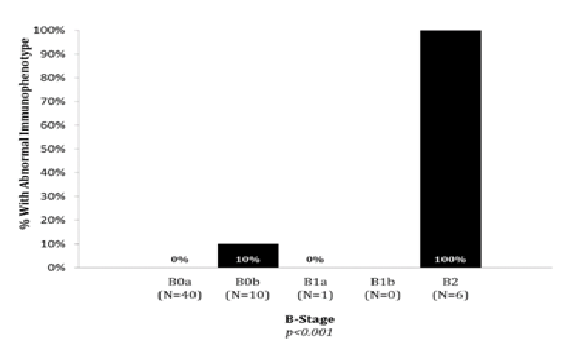
Graph 3: Abnormal Immunophenotyping in Blood Classification
CD4:CD8 ratio
One of the diagnostic methods to assess peripheral blood tumour burden in SS is a global increase in CD4+ T cells leading to CD4:CD8 ratio greater than 10 (B2 classification). All patients had CD4:CD8 recorded (data completeness 100%). Raised CD4:CD8 ratio was not detected in any of the early stage patients (0/30) but 6 of 27 (22%) with advanced disease had a ratio greater than 10. All patients with raised CD4:CD8 ratio had
White cell count and differential
Blood markers including WCC, lymphocyte, and eosinophil count were measured in 56 patients (data completeness 98%) at the time of diagnosis. The median and range for the blood markers are shown in Table 5.
Table 5: Median (range) for white cell count and differentials in MF/SS
| Overall Stage | ||
|---|---|---|
| IA - IIA | IIB - IVB | |
| WCC | 7.0 (6.0 - 9.1) | 8.0 (5.1 – 11.8) |
| Lymphocyte | 1.9 (1.2 - 2.2) | 1.4 (0.9 - 2.1) |
| Eosinophil | 0.1 (0.1 - 0.2) | 0.1 (0.1 - 0.4) |
| T Classification | ||
| T1 - T3 | T4 | |
| WCC | 6.9 (5.1 - 9.1) | 10.1 (7.7 – 15.5) |
| Lymphocyte | 1.5 (1.1 - 2.0) | 1.8 (1.1 – 7.6) |
| Eosinophil | 0.1 (0.1 - 0.2) | 0.4 (0.1 - 0.9) |
12 out of 56 patients had raised WCC (21%). This did not differ significantly between patients with early and advanced disease (17% vs. 26%, p = 0.523).
Eosinophil count was raised in 7/56 (13%) patients. Eosinophilia was significantly more likely in advanced than in early disease (22% vs. 3%, p = 0.048).
Lymphocyte count was raised in 7/56 (13%) patients, with significantly higher rates of raised counts in advanced (22%) than in early (3%) disease (p = 0.048). Significant differences were also detected between T4 and T1-T3 disease, with raised counts observed in 43% and 2% of patients respectively (p < 0.001).
Serum lactate dehydrogenase level
52 of 57 patients (data completeness 91%) had serum LDH result measured. 31 (60%) had elevated LDH above normal reference range for our laboratory. The median for LDH in erythrodermic disease was 288 (range, 270-404) and 209 (range, 180-264) in patch, plaque and tumour stage disease. 13/14 (93%) erythrodermic disease had raised LDH compared to 18/38 (47%) in non-erythrodermic disease (p = 0.004) (Graph 4).
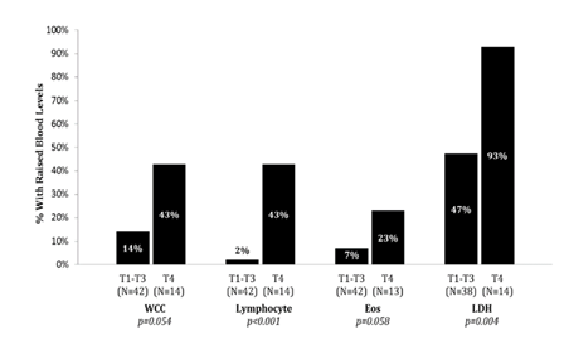
Graph 4: Raised Blood Markers in Skin Classification (WCC, lymphocyte, eosinophil and LDH)
As summarised in (Table 6), the most frequent abnormality was elevated LDH followed by identical skin / blood TCR clonality, immunophenotyping, lymphocyte count, and CD4:CD8 ratio in advanced/erythrodermic disease. In early disease, raised LDH was the most frequent abnormality followed by identical skin / blood TCR clonality and lymphocyte count. None of the patients with early disease had abnormal immunophenotyping nor raised CD4:CD8 ratio. All investigations were found to be significantly associated with erythrodermic disease.
Table 6: Positive investigations observed in MF/SS to assess peripheral blood tumour burden by Overall and Skin Classification
| Early disease (IA-IIA) |
Advanced disease (IIB-IVB) |
P value | |
|---|---|---|---|
| TCR gene rearrangement study | 2/30 (7%) | 14/27 (52%) | < 0.001 |
| Immunophenotying | 0/30 (0%) | 7/27 (26%) | 0.003 |
| CD4:CD8 ratio (>10) | 0/30 (0%) | 6/27 (22%) | 0.017 |
| Raised LDH (>214) | 14/26 (54%) | 17/26 (65%) | 0.572 |
| Raised lymphocyte count >4 | 1/29 (3%) | 6/27 (22%) | 0.048 |
| Non-erythrodermic disease (T1-T3) | Erythrodermic disease (T4) | P value | |
| TCR gene rearrangement study | 7/43 (16%) | 9/14 (64%) | 0.001 |
| Immunophenotying | 1/43 (2%) | 6/14 (43%) | < 0.001 |
| CD4:CD8 ratio (>10) | 0/43 (0%) | 6/14 (43%) | < 0.001 |
| Raised LDH (>214) | 18/38 (47%) | 13/14 (93%) | 0.004 |
| Raised lymphocyte count >4 | 1/41 (2%) | 6/14 (43%) | < 0.001 |
Discussion
In this study, the peripheral blood involvement of 57 patients diagnosed with both early and advanced MF/SS were assessed and the various diagnostic approaches used to measure the peripheral blood tumour burden in MF/SS were reviewed. In the last decade, many studies found a relationship between peripheral blood tumour burden and prognosis and this was reflected on the ISCL/EORTC revised staging proposal for MF/SS by including a blood classification. The ISCL/EORTC suggest various methods to assess peripheral blood involvement including CD4:CD8 ratio, TCR gene rearrangement study and immunophenotyping and methods vary between centres. There is currently no consensus on the definitive methods to use or which are most informative for the assessment of blood tumour burden in MF/SS.
In our study 7 of 57 patients had B1-2 classification, all with T4 disease including 6 with SS and 1 with erythrodermic MF (B1b). The remaining 50 had B0 classification and corresponding T classification in this cohort was: T1: n = 6, T2: n = 28, T3: n = 9 and T4: n = 7. Dominant TCR clonaltiy was seen in 45 out of 57 patients (79%) on their skin sampleand 16 patients (28%) had the identical TCR clone detected in their blood. Clonal rearrangement in blood was common (54%) but for a blood clone to be relevant it must be identical to skin clone. The rate of identical TCR clonality in blood was 7% and 52% in early disease and advanced disease respectively in this study which is lower than the expected rate based on the published literature[21]. Beylot-Barry et al has found that 15% of early disease and 63% of advanced disease patients had identical TCR clonality on skin and blood[21]. One of the limitations with TCR gene rearrangement by PCR and/or Southern blot is that it does not give quantitative assessment of blood tumour burden.
Blood classification in MF/SS defines an abnormal phenotype greater than 5% of the total lymphocytes as B1. As such any patient with an aberrant phenotype (typically CD4+CD7- or CD4+CD26-) is considered ‘normal’ or B0 with no blood involvement. This is because these lower levels of aberrant phenotypes are seen in benign dermatoses. The 50 patients with a normal immunophenotype had no abnormal phenotype detected above 5%. Patients were tested for the following phenotypes CD2,3,4,5,7,8,16,56,30. Immunophenotyping identified 7 abnormal T-cell populations and all had advanced disease: 5 in IVA1 and 2 in IVA2 (p = 0.003). 6 of 14 erythrodermic patients (57%) had abnormal immunophenotyping (p < 0.001). Immunophenotyping abnormalities were most frequent in B2 but were detected in 1 patient with B0. Most previous reports using flow cytometry have been studied in SS where abnormalities may be found in above 90%[22,23]. One previous report of flow cytometry using 4 markers (CD3,4,7,26) of 69 patients with MF/SS found abnormalities in 30% of early stage disease[24] but the rate of abnormal result in our study involving consecutive patients diagnosed with MF/SS was much lower (2%). Amongst patients with abnormal immunophenotyping (n = 7), all patients had identical clone on blood and skin by TCR rearrangement study and raised LDH. CD4:CD8 ratio, WCC and lymphocyte count were raised in 6 patients. The most common abnormality in immunophenotyping was aberrance in the expression of CD7 which was consistent with other literatures[25,26]. Aberrancy of other T-cell antigens, including CD2, CD3 and or CD26, is also associated with SS[27-29] and our study has also demonstrated dim CD2, CD3 or CD5. The ISCL/EORTC staging classification suggested ≥40% CD4+CD7- T cells or ≥30% CD4+CD26- T cells to be demonstrated on immunophenotyping to confirm B2 peripheral blood involvement. However, aberrancy in the expression of CD26 was not evaluated in our study as historically it was not historically included in our CTCL panel. Hristow et al[24] found higher rates of CD26- (41%) compared to CD7- (20%) in all stages of MF whilst Horna et al[23] found similar rates of CD26 and CD7 antigen loss in erythrodermic CTCL (79% and 78% respectively). The rate of abnormal immunophenotyping may have been higher if CD26 was also analysed in our study.Immunophenotyping lacks specificity as abnormal immunophenotype can occasionally be detected in reactive T cell populations. In addition, the heterogenicity of immunophenotypic abnormalities between patients makes it difficult to draw definitive criteria for immunophenotypic abnormalities but for individual patients the immunophenotype appears stable even after treatment in the majority[22,30].
CD4:CD8>10 was decided based on many studies in 1980s to exclude raised ratio due to benign dermatoses such as atopic erythroderma[31-34]. Only one patient had a raised CD4:8 ratio less than 10 in this study. Raised CD4:CD8 ratio greater than 10 was not detected in any of the early stage patients (0/30) but in 6 of 27 (22%) with advanced disease. All patients with raised CD4:CD8 ratio had erythrodermic disease.
Elevated serum LDH was the most frequent abnormal finding. A raised LDH has been shown to be an independent poor prognostic marker for survival in MF/SS and associated with an increased risk of disease progression in univariate and multivariate analysis[12,16,17,35-38]. However, there is a bias towards testing haematological markers at diagnosis in those with advanced disease. Agar et al showed that only 435 had LDH and 744 of 1501 TCR analysis in blood recorded at diagnosis[17]. In this study, 91% had LDH tested. Raised LDH was found to be significantly more common in erythrodermic disease (13/14, 93%) compared with non-erythrodermic disease (18/38, 47.4%). This suggests that it may be utilized as a cost-effective tool to screen the peripheral blood tumour burden in advanced/erythrodermic disease. However, the measure of LDH may lack specificity. This study represents the first study of consecutive patients with all stages of MF/SS analysed for peripheral blood involvement. Whilst immunophenotyping provided a useful measure of blood tumour burden in erythrodermic patients, abnormalities were unusual in early disease and tumour stage disease. The cost burden of immunophenotyping is relatively high and may not add further information in patients with early stage MF. TCR gene analysis is typically tested for using Biomed 2 primers and provides more sensitive detection rate of low level blood involvement in early MF compared to immunophenotyping. However, current PCR method for TCR gene analysis lacks specificity hence improved sequencing techniques is required. New sequencing technology, such as next generation sequencing (NGS), could be applied in our clinical setting to improve the diagnosis. Currently, there are more than 500 publications demonstrating its potential advantages as a clinical diagnostic tool but these studies were mainly looking at leukaemia and lymphoma. Recent study by Weng et al has demonstrated the use of NGS in monitoring minimal residual disease in CTCL following bone marrow transplant[39].
This study is novel as it presents a large case series of all stages of MF/SS and shows that immunophenotyping abnormalities are rare in early stage and tumour stage disease and that TCR gene analysis and LDH measurements may be used to screen for likely peripheral blood involvement which may be confirmed by immunophenotyping.
Conflict of interest
There is no conflict of interest from all authors.
References
- 1. Olsen, E.A., Rook, A.H., Zic, J., et al. Sézary syndrome: immunopathogenesis, literature review of therapeutic options, and recommendations for therapy by the United States Cutaneous Lymphoma Consortium (USCLC). (2011) J Am AcadDermatol 64(2): 352-404.
- 2. Vonderheid, E.C., Bernengo, M.G., Burg, G, et al. Update on erythrodermic cutaneous T-cell lymphoma: report of the International Society for Cutaneous Lymphomas. (2002) J Am AcadDermatol 46(1): 95-106.
- 3. Zackheim, H.S., Amin, S., Kashani-Sabet, M., et al. Prognosis in cutaneousT-cell lymphoma by skin stage: long-term survival in 489 patients. (1999) J Am AcadDermatol 40(3): 418-4 25.
- 4. Willemze, R., Kerl, H., Sterry, W., et al. EORTC classi?cation for primary cutaneous lymphomas: a proposal from the Cutaneous Lymphoma Study Group of the European Organization for Research and Treatment of Cancer. (1997) Blood 90(1): 354-371.
- 5. Lorincz, A.L. Cutaneous T-cell lymphoma (mycosisfungoides). (1996) The Lancet 347(9005): 871-876.
- 6. Siegel, R.S., Pandol?no, T., Guitart, J., et al. Primary cutaneous T-cell lymphoma: review and current concepts. (2000) J ClinOncol 18(15): 2908-25.
- 7. Green, S., Byar, D., Lamberg, S. Prognostic variables in mycosis fungoides. (1981) Cancer 47(11): 2671-2677
- 8. Lamberg, S.I., Green S.B., Byar, D.P., et al. Clinical staging for cutaneous T-cell lymphoma. (1984) Ann Int Med 100(2): 187-192.
- 9. Diamandidou, E., Cohen, P.R.., Kurzrock, R. Mycosis fungoides and Se´zary syndrome. (1996) Blood 88(7): 2385-2409.
- 10. Scarisbrick, J.J., Kim, Y.H., Whittaker, S.J., et al. Prognostic factors, prognostic indices and staging in mycosis fungoides and Se´zary syndrome: where are we now? (2014) BJD 170(6): 1226-1236.
- 11. Bunn, PA, Jr., Lamberg, S.I. Report of the Committee on Staging and Classi?cation of Cutaneous T-Cell Lymphomas. Cancer Treat Rep 63(4): 725-728.
- 12. Kim, Y.H., Liu, H.L., Mraz-Gernhard, S., et al. Long term outcome of 525 patients with mycosis fungoides and Sézary Syndrome: clinical prognostic factors and risk for disease progression. (2003) Arch Dermatol 139(7): 857-866.
- 13. Toro, J.R., Stoll, H.L., Stomper, P.C., et al. Prognostic factors and evaluation of mycosis fungoides and Sézary syndrome. (1997) J Am Acad Dermatol 37(1): 58-67.
- 14. Fraser-Andrews, E., Woolford, AJ., Russell-Jones, R., et al. Detection of a peripheral blood T cell clone is an independent prognostic marker in mycosis fungoides. (2000) J Invest Dermatol 114(1): 117- 121
- 15. Scarisbrick, J.J., Whittaker, S., Evans, A.V., et al. Prognostic significance of tumour burden in the blood of patients with erythrodermic primary cutaneous T-cell lymphoma . ( 2001) Blood 97(3): 624-630.
- 16. Vidulich, K.A., Talpur, R., Bassett, R.L., et al. Overall survival in erythrodermic cutaneous T-cell lymphoma: an analysis of prognostic factors in a cohort of patients with erythrodermic cutaneous T-cell lymphoma. (2009) Int J Dermatol 48(3): 243-252.
- 17. Agar, N.S., Wedgeworth, E., Crichton, S., et al. Survival Outcomes and Prognostic Factors in Mycosis Fungoides/Se´zarySyndrome:Validation of the Revised International Society for Cutaneous Lymphomas/ European Organisation for Research and Treatment of Cancer Staging Proposal. (2010) J Clin Oncol 28(1): 4730-4739.
- 18. Morice, W.G., Katzmann, J.A., Pittelkow, M.R., et al. A comparison of morphologic features, flow cytometry, TCR-Vβ analysis, and TCR-PCR in qualitative and quantitative assessment of peripheral blood involvement by Sézary syndrome. (2006) Am J Clin Pathol 125(3): 364-374.
- 19. Olsen, E., Vonderheid, E., Pimpinelli, N., et al. Revisions to the staging and classification of mycosis fungoides and Sézary syndrome: a proposal of the International Society for Cutaneous Lymphomas (ISCL) and the Cutaneous Lymphoma Task Force of the European Organization of Research and Treatment of Cancer (EORTC). (2007) Blood 110(6):1713-1722.
- 20. Droese, J., Langerak, A.W., Groenen, P.J., et al. Validation of BIOMED-2 multiplex PCR tubes for detection of TCRB gene rearrangements in T-cell malignancies. (2004) Leukemia 18(9): 1531–1538.
- 21. Beylot-Barry, M., Sibaud, V., Thiebaut, R., et al. Evidence that an identical T cell clone in skin and peripheral blood lymphocytes is an independent prognostic factor in primary cutaneous T cell lymphoma.(2001) J Inv Dermatol 117(4): 920-926.
- 22. Novelli, M., Fava, P., Sarda, C., et al. Blood flow cytometry in Sézary Syndrome. (2015) Am J Clin Pathol 143(1): 57-69.
- 23. Horna, P., Deaver, D.M., Qin, D., et al. Quantitative ?ow cytometric identi?cation of aberrant T cell clusters in erythrodermic cutaneous T cell lymphoma. Implications for staging and prognosis. (2014) J Clin Pathol 67(5): 431–436
- 24. Hristov, A.C., Vonderheid, E.C., Borowitz, M.J. Simplified Flow Cytometric Assessment in Mycosis Fungoides and Sézary Syndrome. (2011) Am J Clin Pathol 136(6): 944-953.
- 25. Bogen, S.A., Pelley, D., Charif, M., et al. Immunophenotypic identification of Sézary cells in peripheral blood. (1996) Am J Clin Pathol 106(6): 739-748.
- 26. Lima, M., Almeida, J., dosAnjosTeixeira, M., et al. Utility of flow cytometry immunophenotyping and DNA ploidy studies for diagnosis and characterization of blood involvement in CD4+ Sézary’s syndrome. (2003) Haematologica 88(8): 874-887.
- 27. Bernengo, M.G., Novelli, M., Quaglino, P., et al. The relevance of the CD4+ CD26– subset in the identification of circulating Sézary cells. (2001) Br J Dermatol 144(1): 125-135.
- 28. Edelman, J., Meyerson, H.J. Diminished CD3 expression is useful for detecting and enumerating Sézary cells. (2000) Am J Clin Pathol 114(3): 467-477.
- 29. Jones, D., Dang, N.H., Duvic, M., et al. Absence of CD26 expression is a useful marker for diagnosis of T-cell lymphoma in peripheral blood. (2001) Am J ClinPathol 115(6): 885-892.
- 30. Vaughan, J., Harrington, A.M., Hari, P.N., et al. Immunophenotypic stability of Se´zary cells by flow cytometry: usefulness of flow cytometry in assessing response to and guiding alemtuzumab therapy. (2012) Am J Clin Pathol 137(3): 403-411.
- 31. Haynes, B.F., Metzgar, R.S., Minna, J.D., et al. Phenotypic characterization of cutaneous T-cell lymphoma. Use of monoclonal antibodies to compare with other malignant T-cells. (1981) N Eng J Med 304(22): 1319-1323.
- 32. Laroache, L., Bach, J.F. T cell imbalance in non-leukemic and leukemic cutaneous lymphoma defined by monoclonal antibodies. (1981) Clin Immunol Immuno pathol 20(2): 278-284.
- 33. Kung, P.C., Berger, C.L., Goldstein, G., et al. Cutaneous T cell lymphoma: characterization by monoclonal antibodies. (1981) Blood 57(2): 261-266.
- 34. Willemze, R., Van Vloten, W.A., Hermans, J., et al. Diagnostic criteria in Sézary syndrome: a multiparameter study of peripheral blood lymphocytes in 32 patients with erythroderma.(1983) J Invest Dermatol 81(5): 392-397.
- 35. Talpur, R., Singh, L., Daulat, S., et al. Long-term outcomes of 1263 patients with mycosis fungoides and Sézary syndrome from 1982 to 2009. (2012) Clin Cancer Res 18(18): 5051-5060.
- 36. Diamandidou, E., Colome, M., Fayad, L., et al. Prognostic factor analysis in mycosis fungoides/Se´zary syndrome. (1999) J Am Acad Dermatol 40(6): 914-924.
- 37. Marti, R.M., Estrach, T., Reverter, J.C., et al. Prognostic clinicopathologic factors in cutaneous T-cell lymphoma. (1991) Arch Dermatol 127(10): 1511-1516.
- 38. Suzuki, S.Y., Ito, K., Ito, M., et al. Prognosis of 100 Japanese patients with mycosis fungoides and Sézary syndrome. (2010) J Dermatol Sci 57(1): 37-43.
- 39. Weng, W.K., Armstrong, R., Arai, S., et al. Minimal residual disease monitoring with high-throughput sequencing of T-cell receptors in cutaneous T cell lymphoma. (2013) Science translational medicine 5(214): 214ra171.


