
Assessment of Water Quality among Water Vendors and Storage Facilities within Gombe Metropolis
Umar Musa Kwami1*, Herry O. Sawyerr2
Affiliation
1Gombe State College of Health Science and Technology, Kaltungo, Gombe State, Nigeria
2Department of Environmental Health Science, Kwara State University, Malete, Kwara State, Nigeria
Corresponding Author
umar Musa Kwami
Citation
Kwami, U.M., et al. Assessment of Water Quality Among Water Vendors and Storage Facilities Within Gombe Metropolis. (2018) J Environ Health Sci 4(2): 58- 63
Copy rights
© 2018 Kwami, U.M. This is an Open access article distributed under the terms of Creative Commons Attribution 4.0 International License.
Abstract
The issue of water shortage and lack of water sanitation remain the topic of discussion as a result of illness and diseases caused by pathogenic aquatic microorganism and parasitic healthmiths. Water quality and treatments occurred at different source of water which include well, Dam, borehole, aquifer and springs among others, but little is been done in assessing the water storage facilities and water vendors particularly in Gombe metropolis. Themain aims and objectives of this research work are to ascertain as well as to find out wholesomenessof water from water storage facilities and water vendors. Systematic random sampling was used in sampling fifty (50) sample of water from water storage facilities and water vendors. The finding shows that 30% among the sample of water is suitable and wholesome for consumption, while 70% of sample analyzed is not suitable for consumption and other domestic activities in terms of water nutrients. Only 20% of the water analyzed is suitable for drinking in terms of feacal coliforms but 80% of the water is unfit for drinking and other domestic activities, and 22% is suitable for drinking and other domestic activities in terms of water physical qualities, but 78% is not suitable for drinking and other domestic activities. Finally, 20% of the sample analyzed is suitable for drinking and other domestic activities chemically, but 80% is not suitable for drinking and other domestic activities. the researcher therefore advise the house hold and water vendors to carry out regular, proper and effective washing and cleaning of their water storage facilities
Introduction
Water remains one among the most essential elements that determine the survival of mankind. The issue of inadequate and lack of water sanitation is one among the factors that contribute in high rate of morbidity and mortality. Water shortage is the leading factors in causing dead worldwide. Water covers 70% of our planet, and it is easy to think that it will always be plentiful. However, freshwater that we drink, baths in, irrigates our farm fields with-is incredibly rare. Only 3% of the world’s water is fresh water, and two-thirds of that is tucked away in frozen glaciers or otherwise unavailable for our use.
As a result, some 1.1 billion people worldwide lack access to water, and a total of 2.7 billion find water scarce for at least one month of the year. Inadequate sanitation is also a problem for 2.4 billion people- they are exposed to diseases, such as cholera and typhoid fever, and other water-borne illnesses. Two million people, mostly children, die each year from diarrheal diseases alone.
Many of the water systems that keep ecosystems thriving and feed a growing human population have become stressed. Rivers, lakes and aquifers are drying up or becoming too polluted to use. More than half the world’s wetlands have disappeared. Agriculture consumes more water than any other source and wastes much of that through inefficiencies. Climate change is altering patterns of weather and water around the world, causing shortages and droughts in some areas and floods in others.
At the current consumption rate, this situation will only get worse. By 2025, two-thirds of the world’s population may face water shortages. And ecosystems around the world will suffer even more. Presence of microbial organism, feacal and total coliforms, water nutrients and other substances in our water contribute in diseases and illness particularly water from water vendors and storage facilities. A times water from water source such as borehole, well, stream, and aquifer are clean and wholesome for drinking and other domestic activities.
Water storage facilities and water vendors favour a lots of microbial and feacal coliforms due to lack of cleaning and proper sanitation of such containers and facilities. Microbial feacal coliforms and other healthmiths are major source of diseases and illness. Water pollution caused by fecal contamination is a serious problem due to the potential for contracting diseases from pathogens (disease causing organisms). Frequently, concentrations of pathogens from fecal contamination are small, and the number of different possible pathogens is large. Such harmful micro pathogenic microorganism may growth and reproduces in our water storage facilities and water vendors over long period of time.
Significant amount of research is been done in the area of water shortage and water born related diseases due to lack of proper water sanitation. However, little or no any work is been done in assessment of water storage facilities as well as water vendors in determine how clean in terms of sanitary condition of such facilities and free from water born related pathogenic microorganism such as feacal coliforms, helminthes, fungi, bacteria and viruses among others which give births to this research work’.
The objectives of the study are:
1. To assess the physical quality of water sample from water storage facilities and water vendors within Gombe metropolis.
2. To assess the chemical quality of water sample from water storage facilities and water vendors within Gombe metropolis.
3. To assess microbial total/feacal coliforms of water sample from water storage facilities and water vendors within Gombe metropolis.
4. To assess water nutrients from water sample from water storage facilities and water vendors within Gombe metropolis.
Materials and Methods
The experimental design involved collecting 50 water samples using a systematic sampling approach. The water samples were analyzed in terms of physical, chemical, microbial and water nutrients. The results are as follow (Table 1).
Table 1: Water quality analysis and suitability.
| turbidity | Suitable | 11 | 22 |
|---|---|---|---|
| Not Suitable | 39 | 78 | |
| colour | Not Suitable | 06 | 12 |
| Suitable | 44 | 88 | |
| Odour | Not Suitable | 10 | 20 |
| Suitable | 40 | 80 | |
| taste | Not Suitable | 11 | 22 |
| Suitable | 39 | 78 | |
| Temperature | Not Suitable | 12 | 24 |
| Suitable | 38 | 76 | |
| pH | Not Suitable | 10 | 20 |
| Suitable | 40 | 80 | |
| conductivity | Not Suitable | 11 | 22 |
| Suitable | 39 | 78 | |
| chloride content | Not Suitable | 10 | 20 |
| suitable | 40 | 80 |
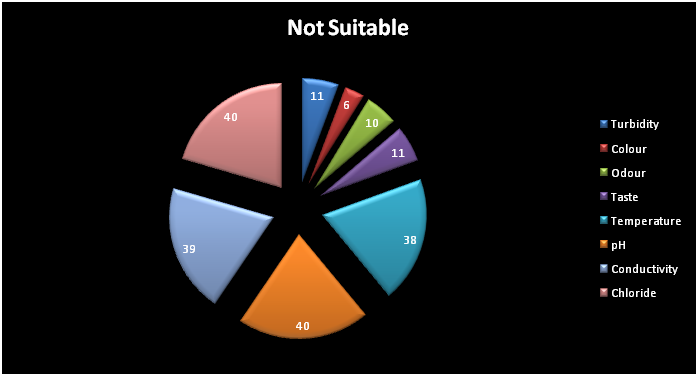
Figure 1: Graphical presentation of physical water quality analysis from water vendors.
Based on Table 1 and Figure 1 shown above, in terms of turbidity, 11 among the sample collected which is equivalent to 22% of the sample collected is not suitable for drinking and other domestic activities due to the turbidity of the water, while 39 among the sample collected which is equivalent to 82% is suitable for drinking and other domestic activities. In terms of water colour, 06 among the sample collected which is equivalent to 12% is not suitable for drinking, while 44 among the sample collected which is equivalent to 98% is suitable for drinking.
In terms of water odour, 10 among the samples collected which is equivalent to 20% is not suitable for drinking, while 40 among the sample collected which is equivalent to 80% are suitable for drinking., while 11 among the sample collected which is equivalent to 22% is not suitable for drinking. 39 among the sample collected which is equivalent to 78% are suitable for drinking in terms of Odour. In terms of water temperature 12 which is equivalent to 24% of the sample collected are not suitable for drinking and other domestic activities, while 38 among the sample collected which is equivalent 76% of the water sample is suitable for drinking and other domestic activities.
Ph is also one among the water physical water quality that is been analyzed. And based on the sample collected 10 samples which is equivalent to 20% is not suitable for drinking but 40 among the sample collected which is equivalent to 80% of the sample are suitable for drinking. 11 sample of water analyzed which is equivalent to 22% are not suitable for drinking in terms of water conductivity while 78% among the sample is suitable for drinking and domestic activities. While for the issue of water chloride content 10 among the sample collected which is equivalent to 20% is not suitable for drinking, while 40 among the sample collected which is equivalent to 80% is suitable for drinking and other domestic activities.
Table 2: Chemical water Quality Analysis of water vendors.
| Scale | Frequency | Percentage | |
|---|---|---|---|
| TDS | Suitable | 40 | 80% |
| Not suitable | 10 | 20% | |
| Cl- | Suitable | 44 | 88% |
| Not suitable | 06 | 12% | |
| Alkalinity | Suitable | 40 | 80% |
| Not suitable | 10 | 20% | |
| Hardness | Suitable | 41 | 82% |
| Not suitable | 9 | 18% | |
| Fe | Suitable | 45 | 90% |
| Not suitable | 05 | 10% |
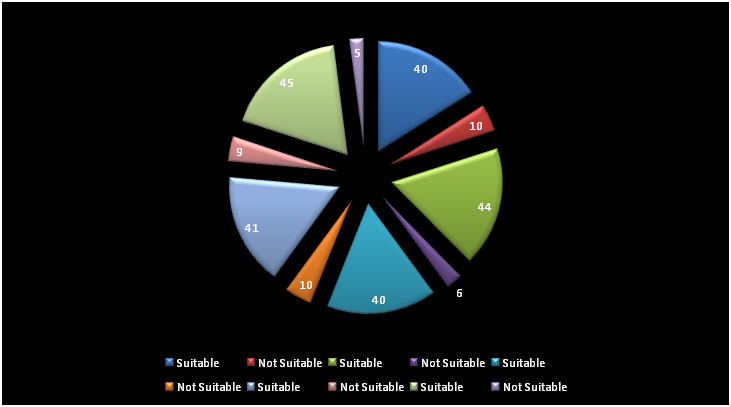
Figure 2: Chemical water quality analysis from water vendors.
The water quality analysis in terms of total dissolved solute shows that 40 out of total of 50 samples which is equivalent to 80% indicate that the water is suitable for drinking and other domestic activities, while 10 out 50 samples analyzed which is equivalent to 20% shows that the water is unfit for drinking and other domestic activities. Chloride shows that out of 50 samples analyzed, 44 out of 50 samples which is equivalent to 88% is suitable for drinking and other domestic activities, while 6 out of 50 samples which is equivalent to 8% shows that the water is unfit for drinking and other domestic activities. Water alkalinity shows that out of 50 samples only 40 samples which is equivalent to 80% proved that the water is fit for drinking and other religious activity, but 10 out of 50 samples which is equivalent to 20% shows that the water is unfit for drinking and other domestic activities.
Water hardness indicates that out of 50 samples collected 41 samples which is equivalent to 82% indicate that the water is fit/suitable for drinking and other domestic activities while 9 out of 50 sample which is equivalent to 18% is not suitable for drinking and other domestic activity. And finally, the result of iron shows that only 45 sample which is equivalent to 90% is suitable for drinking, while 5 among the samples which is equivalent to 10% shows that the water is not suitable for domestic cooking drinking and other activities.
Table 3: Analysis of water chemistry from water vendors
| Nitrate | Suitable | 38 | 76 |
|---|---|---|---|
| Not Suitable | 12 | 24 | |
| sulphate | Suitable | 40 | 80 |
| Not Suitable | 10 | 20 | |
| potassium | Suitable | 32 | 64 |
| Not Suitable | 18 | 36 | |
| manganese | Suitable | 43 | 86 |
| Not Suitable | 07 | 14 | |
| calcium | Suitable | 35 | 70 |
| Not Suitable | 15 | 30 | |
| magnesium | Suitable | 38 | 76 |
| Not Suitable | 12 | 14 | |
| Phosphate | Suitable | 39 | 78 |
| Not Suitable | 11 | 22 | |
| hardness | Suitable | 40 | 80 |
| Not Suitable | 10 | 20 | |
| Ion (meaning what?) | Suitable | 37 | 74 |
| Not Suitable | 13 | 26 |
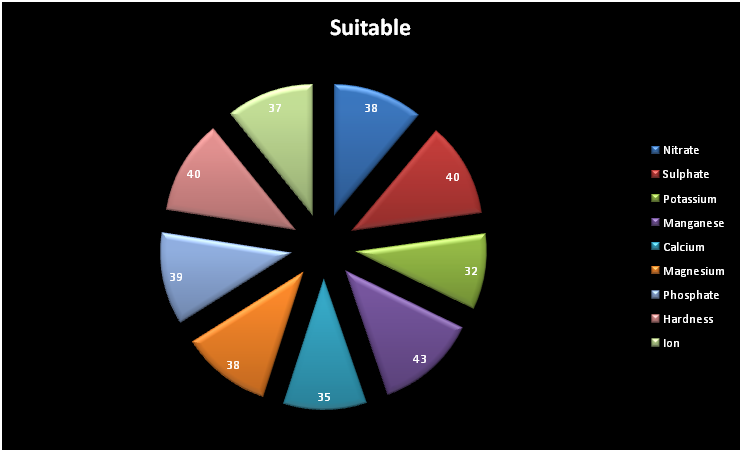
Figure 3: Graphical presentation of nutrient water quality analysis from water vendors.
Based on the water collected from water vendors and analyzed (Table 3) (Table 4), out of 50 sample, 34 out of 50 sample analyzed which is equivalent to 76% shows that the water is suitable for drinking and other domestic activities in respect to nitrate, while 12 out of 50 sample which is equivalent to 24% shows that the water is not suitable for drinking and other domestic activities. Sulphate shows that out of 50 samples analyzed, 40 samples which is equivalent to 80% is suitable for drinking but 10 out of 50 sample which is equivalent to 20% shows that the water is not fit for drinking and other domestic activities.
Potassium shows that out of 50 samples analyzed, only 32 which is equivalent to 64% is suitable for drinking and other domestic activities, while 18 of the sample analyzed which is equivalent to 36% shows that the water is not fit for drinking and other domestic activities. 43 out of 50 samples analyzed in terms of magnesium which is equivalent to 86% shows that the water is suitable for drinking and other domestic activities, while 07 out of 50 samples analyzed which is equivalent to 14% shows that the water is not suitable for drinking and other domestic activities.
Calcium shows that out of 50 samples analyzed 35 which is equivalent to 70% indicate that the water is suitable for drinking and other domestic activities, while 15 out of 50 samples analyzed which is equivalent to 30% shows that the water is not suitable for drinking and other domestic activities. Manganese indicate that out of 50 sample analyzed, 38 which is equivalent to 76% indicate that the water is suitable for drinking and other domestic activities, while 12 out of 50 sample which is equivalent 24% shows that the water is not suitable for drinking and other domestic activities.
Phosphate shows that out of 50 sample analyzed only 39 samples which is equivalent to 78% is suitable for drinking, while 11 out 50 samples analyzed which is equivalent to 12% shows that the water is unfit for drinking and other domestic activities. But hardness shows that out of 50 sample analyzed, 40 which is equivalent to 80% shows that the water is suitable for drinking and other domestic activities, while 10 among the sample analyzed which is equivalent to 20% indicate that the water is not unfit for drinking and other domestic activities, and finally iron shows that 37 out of 50 samples analyzed which is equivalent to 74% indicate that the water is suitable for drinking and other domestic activities, but 13 out of 50 sample which is equivalent to 26% indicate that the water is unfit for drinking and other domestic activity.
Table 4: Results for microbial water quality analysis.
| Coliforms | Scale | Frequency | Percentage |
|---|---|---|---|
| Fecal coliform | Suitable | 10 | 20 |
| Not Suitable | 40 | 80 | |
| Total coliform | Suitable | 08 | 16 |
| Not Suitable | 42 | 84 |
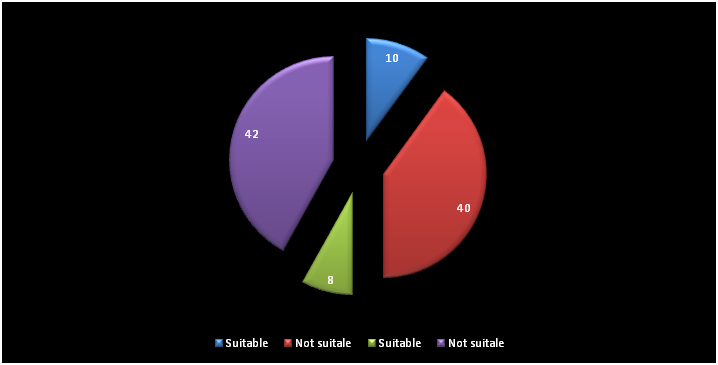
Figure 4: Graphical presentation of microbial water quality analyses from water vendors.
Based on the sample of water analyzed from the water vendors, out of the 50 samples 10 which is equivalent to 20% shows that the water is suitable for drinking and other domestic activities, while 40 of the samples analyzed out of 50 samples from the water vendors which is equivalent to 80% shows that the water is unfit for drinking and other domestic activities in terms of feacal coliforms. In terms of total coliforms, out of 50 samples collected and analyzed from the water vendors, 9 sample which is equivalents to 18%, shows that the water is fit for drinking and other activities, but 41 of the sample which is equivalent to 82% indicate that the water is unfit for drinking and other domestic activities.
Findings
The finding of this research works shows that in terms of physical analysis out of fifty (50) sample of water analyzed only 22% are fit for drinking and other domestic activities, but 78% of the water are unfit for drinking and other domestic activities. Microbial water quality analysis shows that ten (10) among the sample out of fifty (50) are fit for drinking which is equivalent to 20%, but the remaining 80% are not fit for drinking and other domestic activities. Chemical analysis shows that only ten (10) among the sample which is equivalent to 20%, but the remaining 80% is unfit for drinking and other domestic activities. And finally, the water nutrients shows that fifteen (15) samples which is equivalent to 30% is fit for drinking, but 35 out of fifty (50) analyzed which is equivalent to 70% is unfit for drinking and other domestic activities.
Conclusion
Although water remains the key determinant of human survival, water that is generally use for drinking and other domestic activities is generally unfit based on the finding of this research work. Only limited sources that are fit for drinking and other domestic activities. As such, there is need by governmental and nongovernmental organization to formulate laws and policies that will ensure that all the sources of water is tested for their potential use. If not the rate of morbidity and mortility will keep on increasing due to water born related diseases and illness.
References
- 1. Ahmed, S.M., Hall, A.J., Robinson, A.E., et al. Global prevalence of norovirus in cases of gastroenteritis: a systematic review and meta-analysis. (2014) Lancet Infect Dis ١٤(٨): 725–730.
- 2. Angulo, F.J., Tippen, S., Sharp, D.J., et al. A community waterborne outbreak of Salmonellosis and the effectiveness of a boil water order. (1997) Am J Public Health 87(4): 580–584.
- 3. Ashbolt, N.J., Amézquita, A., Backhaus, T., et al. Human health risk assessment (HHRA) for environmental development and transfer of antibiotic resistance. (2013) Environ Health Perspect 121(9): 993–1001.
- 4. Ashbolt, N.J., Grabow, W.O.K., Snozzi, M. Indicators of microbial water quality. In: Fewtrell L, Bartram J, editors. Water quality: guidelines, standards and health. Risk assessment and risk management for water-related infectious disease. (2001) London: IWA Publishing 289–315.
PubMed||CrossRef||Others
- 5. Ashbolt, N.J., Schoen, M.E., Soller, J.A., et al. Predicting pathogen risks to aid beach management: the real value of quantitative microbial risk assessment (QMRA). (2010) Water Res 44(16): 4692–4703.
- 6. Beaudeau, P., Schwartz, J., Levin, R. Drinking water quality and hospital admissions of elderly people for gastrointestinal illness in Eastern Massachusetts, 1998–2008. (2014) Water Res 52: 188–198.
- 7. Bichai, F., Dullemont, Y., Hijnen, W., et al. Predation and transport of persistent pathogens in GAC and slow sand filters: a threat to drinking water safety? (2014) Water Res 64: 296–308. doi: 10.1016/j.watres.2014.07.005.
- 8. Borchardt, M.A., Spencer, S.K., Kieke, B.A., et al. Viruses in nondisinfected drinking water from municipal wells and community incidence of acute gastrointestinal illness. (2012) Environ Health Perspect 120(9): 1272–1279.
- 9. Coleman, B.L., Louie, M., Salvadori, M.I., et al. Contamination of Canadian private drinking water sources with antimicrobial resistant Escherichia coli. (2013) Water Res 47(9): 3026–3036.
- 10. Collier, S.A., Stockman, L.J., Hicks, L.A., et al. Direct healthcare costs of selected diseases primarily or partially transmitted by water. (2012) Epidemiol Infect 140(11): 2003–2013.
- 11. Craun, G.F., Brunkard, J.M., Yoder, J.S., et al. Causes of outbreaks associated with drinking water in the United States from 1971 to 2006. (2010) Clin Microbiol Rev 23(3): 507–528.
- 12. Cromeans, T., Park, G.W., Costantini, V., et al. Comprehensive comparison of cultivable norovirus surrogates in response to different inactivation and disinfection treatments. (2014) Appl Environ Microbiol 80(18): 5743–5751.
- 13. Dornas, F.P., Silva, L.C., de Almeida, G.M., et al. Acanthamoeba polyphaga mimivirus stability in environmental and clinical substrates: implications for virus detection and isolation. (2014) PLoS One 9(2): e87811.
- 14. Ebacher, G., Besner, M.C., Clément, B., et al. Sensitivity analysis of some critical factors affecting simulated intrusion volumes during a low pressure transient event in a full-scale water distribution system. (2012) Water Res 46(13): 4017–4030.
- 15. Exner, M., Kramer, A., Lajoie, L., et al. Prevention and control of health care-associated waterborne infections in health care facilities. (2005) Am J Infect Control 33(5): S26–S40.
- 16. Ford, T.E. Microbiological safety of drinking water: united states and global perspectives. (1999) Environ Health Perspect 107(Suppl 1): 191–206.
- 17. Gourabathini, P., Brandl, M.T., Redding, K.S., et al. Interactions between food-borne pathogens and protozoa isolated from lettuce and spinach. (2008) Appl Environ Microbiol 74(8): 2518–2525.
- 18. Grandesso, F., Allan, M., Jean-Simon, P.S., et al. Risk factors for cholera transmission in Haiti during inter-peak periods: insights to improve current control strategies from two case–control studies. (2014) Epidemiol Infect 142(8): 1625–1635.
- 19. Grøndahl-Rosado, R.C., Yarovitsyna, E., Trettenes, E., et al. A one year study on the concentrations of Norovirus and enteric adenoviruses in wastewater and a surface drinking water Source in Norway. (2014) Food Environ Virol 6(4): 232-245.
- 20. Harrison, E.M., Weinert, L.A., Holden, M.T., et al. A shared population of epidemic methicillin-resistant Staphylococcus aureus ١٥ circulates in humans and companion animals. (2014) Am Bio 5(3): e00985–13.
- 21. Hata, A., Katayama, H., Kojima, K., et al. Effects of rainfall events on the occurrence and detection efficiency of viruses in river water impacted by combined sewer overflows. (2014) Sci Total Environ 468–469: 757–763.
- 22. Hellard, M.E., Sinclair, M.I., Forbes, A.B., et al. A randomized, blinded, controlled trial investigating the gastrointestinal health effects of drinking water quality. (2001) Environ Health Perspect 109(8): 773–778.
- 23. Hrudey, S.E., Hrudey, E.J. Ensuring safe drinking water: learning from frontline experience with contamination. (2014) Denver (CO): American Water Works Association.
PubMed||CrossRef||Others
- 24. Hrudey, S.E., Huck, P.M., Payment, P., et al. Walkerton: Lessons learned in comparison with waterborne outbreaks in the developed world. (2002) J Environ Eng Sci 1(6): 397–407.
- 25. Jones, M.K., Watanabe, M., Zhu, S., et al. Enteric bacteria promote human and mouse norovirus infection of B cells. (2014) Science 346(6210): 755–759.
- 26. Juhna, T., Birzniece, D., Larsson, S, et al. Detection of Escherichia coli in biofilms from pipe samples and coupons in drinking water distribution networks. (2007) Appl Environ Microbiol 73(22): 7456–7464.
- 27. Lambertini, E., Borchardt, M.A., Kieke, B.A., Jr, et al. Risk of viral acute gastrointestinal illness from nondisinfected drinking water distribution systems. (2012) Environ Sci Technol 46(17): 9299–9307.
- 28. Leclerc, H., Schwartzbrod, L., Dei-Cas, E. Microbial agents associated with waterborne diseases. (2002) Crit Rev Microbiol 28(4): 371–409.
- 29. Li, D., De Keuckelaere, A., Uyttendaele, M. Application of long-range and binding reverse transcription-quantitative PCR to indicate the viral integrities of noroviruses. (2014) Appl Environ Microbiol 80(20): 6473–6479.
- 30. Liu, G., Bakker, G.L., Li, S., et al. Pyrosequencing reveals bacterial communities in unchlorinated drinking water distribution system: an integral study of bulk water, suspended solids, loose deposits, and pipe wall biofilm. (2014) Environ Sci Technol 48(10): 5467–5476.
- 31. Loharikar, A., Newton, A.E., Stroika, S., et al. Cholera in the United States, 2001–2011: a reflection of patterns of global epidemiology and travel. (2014) Epidemiol Infect 143(4): 695-703.
- 32. Loret, J.F., Greub, G. Free-living amoebae: biological by-passes in water treatment. (2010) Int J Hyg Environ Health 213(3): 167–175.
- 33. Matthews, J.E., Dickey, B.W., Miller, R.D., et al. The epidemiology of published norovirus outbreaks: a review of risk factors associated with attack rate and genogroup. (2012) Epidemiol Infect 140(7): 1161–1172.
- 34. Medema, G., Loret, J-F., Stenström, T.A., et al. Quantitative microbial risk assessment in the water safety plan. Final report on the EU Micro Risk Project. (2006) Brussels: European Commission. PubMed||CrossRef||Others
- 35. Messner, M.J., Berger, P., Nappier, S.P. Fractional poison: a simple dose–response model for human norovirus. (2014) Risk Anal 34(10): 1820–1829.
- 36. National Research Council. Drinking water distribution systems: assessing and reducing risks. Committee on Public Water Supply Distribution Systems: assessing and reducing risks. Water Science and Technology Board, Division on Earth and Life Studies, National Research Council of the National Academies. Washington, DC: The National Academies Press; 2006.
PubMed||CrossRef||Others
- 37. Reynolds, K.A., Mena, K.D., Gerba, C.P. Risk of waterborne illness via drinking water in the United States. (2008) Rev Environ Contam Toxicol 192: 117–158.
- 38. Rodriguez, R.A., Bounty, S., Beck, S., et al. Photo reactivation of bacteriophages after UV disinfection: Role of genome structure and impacts of UV source. (2014) Water Res 55C: 143–149.
- 39. Sales-Ortells, H., Medema, G. Screening-level microbial risk assessment of urban water locations: a tool for prioritization. (2014) Environ Sci Technol 48(16): 9780–9789. doi: 10.1021/es5020407.
- 40. Scheid, P., Schwarzenberger, R. Acanthamoeba spp. as vehicle and reservoir of adenoviruses. (2012) Parasitol Res 111(1): 479–485.
- 41. Schijven, J.F., Teunis, P.F., Rutjes, S.A., et al. QMRA spot: tool for quantitative microbial risk assessment from surface water to potable water. (2011) Water Res 45(17): 5564–5576.
- 42. Sedmak, G., Bina, D., Macdonald, J., et al. Nine-year study of the occurrence of culturable viruses in source water for two drinking water treatment plants and the influent and effluent of a wastewater treatment plant in Milwaukee, Wisconsin (August 1994 through July 2003). (2005) Appl Environ Microbiol 71(2): 1042–1050.
- 43. Smeets, P.W., Rietveld, L.C., van Dijk, J.C., et al. Practical applications of quantitative microbial risk assessment (QMRA) for water safety plans. (2010) Water Sci Technol 61(6): 1561–1568.
- 44. Soller, J.A., Bartrand, T., Ashbolt, N.J., et al. Estimating the primary etiologic agents in recreational freshwaters impacted by human sources of faecal contamination. (2010) Water Res 44(16): 4736–4747.
- 45. Storey, M.V., Ashbolt, N.J. Enteric virions and microbial biofilms: a secondary source of public health concern. (2003) Water Sci Technol 48(3): 97–104.
- 46. Szabo, J., Minamyer, S. Decontamination of biological agents from drinking water infrastructure: a literature review and summary. (2014) Environ Int 72: 124–128.
- 47. Szewzyk, U., Szewzyk, R., Manz, W., et al. Microbiological safety of drinking water. (2000) Ann Rev Microbiol 54: 81–127.
- 48. Tan, M., Jiang, X. Histo-blood group antigens: a common niche for norovirus and rotavirus. (2014) Expert Rev Mol Med 16: e5.
- 49. Teunis, P.F., Xu, M., Fleming, K.K., et al. Enteric virus infection risk from intrusion of sewage into a drinking water distribution network. (2010) Environ Sci Technol 44(22): 8561–8566.
- 50. Thomas, V., McDonnel, G., Denyer, S.P., et al. Freeliving amoebae and their intracellular pathogenic microorganisms: risk for water quality. (2010) FEMS Microbiol Rev 34(3): 231–259.
- 51. World Health Organization. Guidelines for drinking-water quality. 4. Geneva: World Health Organization; 2011.
PubMed||CrossRef||Others
- 52. World Health Organization. Water safety plan manual: step-by-step risk management for drinking-water suppliers. Geneva: World Health Organization; 2009.
PubMed||CrossRef||Others


