
Bioanalytical Method Optimization for the Therapeutic Drug Monitoring of Vancomycin
Ariana Beatriz Alasino, Yamile Soledad Caro, Maria Mercedes De Zan*
Affiliation
Laboratorio de Control de Calidad de Medicamentos, Facultad de Bioquímica y Ciencias Biológicas, Universidad Nacional del Litoral
Corresponding Author
De Zan, M.M. Laboratory of Quality Control of Medicines, Faculty of Biochemistry and Biological Sciences, National University of the Littoral, Santa Fe, Argentina; Tel: + 54 342 4575205; E-mail: mmdezan@fbcb.unl.edu.ar
Citation
De Zan, M.M., et al. Bioanalytical Method Optimization for the Therapeutic Drug Monitoring of Vancomycin. (2017) J Anal Bioanal Sep Tech 2(2): 89- 95.
Copy rights
© 2017 De Zan, M.M. This is an Open access article distributed under the terms of Creative Commons Attribution 4.0 International License.
Keywords
Vancomycin; Therapeutic Drug Monitoring; Design of Experiments; Chromatographic Optimization
Abstract
Chemometric optimization and validation of a method based on High Performance Liquid Chromatography (HPLC) using core – shell particles for the determination of Vancomycin (VMC) in human plasma is reported. The combination of the efficiency of the core-shell particles and the benefits of the design of experiments allowed the successful determination of VCM, even in presence of several interferents. Selectivity, linearity, accuracy and precision were accomplished according to the European Medicines Agency (EMA) guideline, within the concentration range of 1.00 – 60.0 μg/mL of VCM. It is noteworthy that this method requires small amount of sample and solvents, and the sample treatment is simple and no time-consuming. Thus, this method becomes a simple and high-throughput alternative to therapeutic drug monitoring in treated patients, as well as an analytical procedure that conforms to the principles of the green chemistry.
Introduction
Vancomycin (VCM) [Figure 1] is a glycopeptide antibiotic that was isolated from Streptomyces oriental is cultures for first-time in the 1950s for a research group of Eli Lilly and Company Laboratories[1]. In the same decade, the Food and Drug Administration of the United States (US FDA) approved its use in humans for pharmacological treatments[2]. VCM is an antibacterial agent with activity against Gram-positive bacteria and, in the last decade, it has been the drug of choice for treating Methicillin Resistant Staphylococcus Aureus (MRSA) infections, which are of worldwide public health concern[3-5].
The therapeutic range is very narrow in VCM, so diverse recommendations and guidelines for dosing and monitoring this antibiotic in the clinical practice were published by different medical societies[3-6]. Target trough concentrations of 10 – 20 μg/mL are generally recommended, being necessary to maintain it always above 10 μg/mL to improve the clinical outcome of MRSA infections avoiding the development of resistance. However, in severe infections, such as bacteremia, infective endocarditis, osteomyelitis, meningitis and hospital-acquired pneumonia caused by MRSA, trough concentrations > 15 μg/mL are suggested[7,8]. Nevertheless, trough concentrations > 20 μg/mL should be avoided because of the risk of nephrotoxicity[9-12].
The large interindividual variability in VCM pharmacokinetic, linked to patient age, clinical condition and disease, make it really necessary to perform the Therapeutic Drug Monitoring (TDM) in all treated patients[13-16]. It is carried out determining the plasmatic concentration of the antibiotic, in order to adjust its correct dose, for better results with minor side effects.
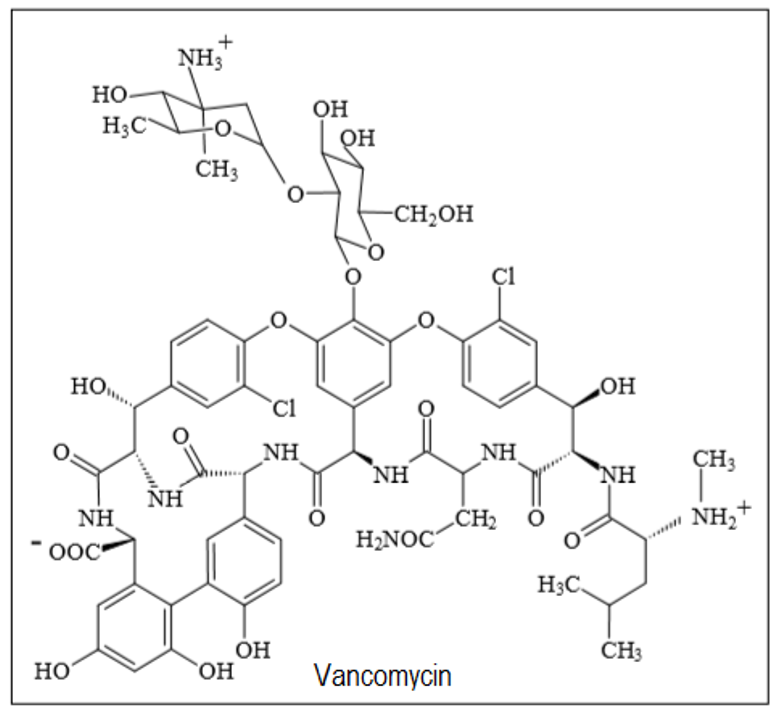
Figure 1: Chemical structure of vancomycin.
Several immunoassays have been developed for the determination of VCM in human fluids, giving rise to various commercial kits[17-19]. However, the separative techniques, such as High Performance Liquid Chromatography (HPLC) with different types of detectors, present better efficiency than immunological techniques due to their high selectivity and reproducibility. It has been shown that immunoassays may cause over estimation of plasma levels of VCM in prolonged treatments due to accumulation of metabolites or antibiotic breakdown products that generate cross-reaction with the active molecule[20]. Moreover, a recent research demonstrated that different immunoassay contribute to the variability in VCM measured concentration in neonate samples, calling attention to the clinical impact that this issue may have[21].
Some recently reported methods use HPLC coupled to mass or tandem mass spectrometry detector (HPLC-MS, HPLC-MS/MS) for the determination of VCM in biological fluids or tissues[22-23]. Although this methodology is undoubtedly of reference, it is not currently accessible to a clinical laboratory because of its high complexity and cost. Liquid chromatography with ultraviolet detector is presented as an excellent choice for a clinical laboratory of medium complexity. Some methods using this strategy have been published in previous years using columns with traditional chromatographic particles[24-26], but none using core shell technology. Moreover, there are not many papers in the literature survey, describing chromatographic methods for quantifying VCM that have studied potential interferences caused by other drugs that can be co-administered with this. Ye et al developed a method to quantify VCM and ceftazidime in cerebrospinal fluid, using tinizole as an internal standard. They obtained a retention time of 7 minutes for VCM and 11 minutes for ceftazidime[27]. Vera López et al. developed a method to quantify VCM, imipenem and cefepime in human plasma, using cefuroxime as an internal standard, reaching a run time of 30 minutes[28]. Furuta et al studied potential interfering drugs but they did not optimize the method to separate the VCM of the drugs that presented a retention time similar to the analyte[29].
The development of a new chromatographic method may involve chemometrics optimization approaches to find the optimum experimental conditions enabling sufficient resolution of the relevant peaks, and furnishing adequate and robust assay results in an acceptable analysis time[30]. Experimental design, especially response surface analysis and “Derringer’s desirability function” are valuable tools when many optimization criteria have to be achieved simultaneously[31-33].
In this study, a fast and efficient HPLC-UV method using core-shell particles was developed for the selective determination of VCM in human plasma, in presence of concomitant pharmaceuticals, applicable to the TDM. The chromatographic separation was chemometrically optimized and the method was validated according to European Medicines Agency (EMA) guideline on bioanalytical method validation[34].
Materials and Methods
Chemicals, Reagents and Samples
Vancomycin hydrochloride standard was supplied by Instituto Nacional de Medicamentos (Buenos Aires, Argentina). Methanol (MeOH) LC grade and perchloric acid 70% ACS reagent were purchased from Sintorgan (Buenos Aires, Argentina). Potassium phosphate monobasic anhydrous (NaH2PO4) p.a. was acquired from Cicarelli (San Lorenzo, Argentina). Ultrapure water was obtained from a Simplicity® UV water purification system (Millipore, Milford, MA, USA). Commercial pharmaceutical formulations of cefotaxime, ceftazidime, ceftriaxone trimethoprim, sulfamethoxazole, ranitidine hydrochloride, colistin, amikacin, ampicillin-sulbactam, diphenylhydramine hydrochloride, piperacillin-tazobactam, meropenem, meprednisone, omeprazole, acyclovir, amphotericin B, fluconazole, dexamethasone base and voriconazole were used as potential interfering drugs.
A 1200 μg/mL stock standard solution of VCM was prepared by dissolving a suitable amount of VCM in 50.0 mL of ultrapure water. The solution was then stored at 4 °C in the dark for a maximum period of 3 days. Stock standard solutions of each potential interfering drug were prepared by dissolving an appropriate amount of the corresponding substance in 10.0 mL of ultrapure water to reach a concentration of 200 μg/mL. Then, the solutions were stored at 4 °C in the dark.
Human plasma samples containing VCM were obtained from treated patients hospitalized at Hospital J.M. Cu - llen of Santa Fe, Argentina, and utilized after TDM analysis. The samples were processed immediately after arrival to the laboratory or stored at 4°C and analyzed within a maximum period of 6 hours. Human plasma from untreated healthy volunteers were obtained from Hospital J.M. Cullen of Santa Fe, Argentina, and used as blank plasma samples.
Apparatus and Software
Chromatographic procedures were accomplished by using an Agilent 1260 Infinity Series LC instrument, equipped with quaternary pump, degasser, thermostatic column compartment, auto-sampler, UV-Vis Diode Array Detector (DAD) (Agilent Technologies, Walbronn, Germany) and Agilent ChemStation OpenLAB software package (Agilent Technologies, Walbronn, Germany) to control the instrument, the data acquisition and data analysis. Design of experiments, surface response modeling and desirability function calculation were performed using Stat-Ease Design Expert 7.0.0 software.
Chromatographic Procedure
The separation was accomplished on a Poroshell 120 EC-C18 (3.0 mm x 75 mm, 2.7 μm) analytical column (Agilent Technologies, Walbronn, Germany) in isocratic mode at 0.4 mL/min flow rate and monitored at 240 nm. The mobile phase consisted in a mixture of 50 mmol/L phosphate buffer solution and MeOH. The pH of the phosphate buffer solution, the proportion of MeOH in the mobile phase and the temperature of the column compartment were optimized by experimental design. (See the section below).
Calibration Standards, Quality Control Samples and Real Samples
A set of seven calibration standards were daily prepared in triplicate by transferring appropriate aliquots of stock standard solution of VCM to 1.00 mL volumetric flask and completing to the mark with untreated human plasma. The final concentrations of VCM in the calibration solutions were 1.00, 2.50, 5.00, 10.0, 20.0, 40.0 and 60.0 μg/mL.
Quality control (QC) samples were prepared by diluting the suitable volume of stock standard solution of VCM in untreated human plasma to achieve concentrations of 1.00, 3.00, 30.0 and 45.0 μg/mL for low limit of quantitation (QC-LLOQ), low (QC-L), medium (QC-M) and high (QC-H) concentration levels, respectively. To evaluate possible interferences that may occurs as consequence of concomitant medication, interference test solutions were prepared by diluting the stock standard solutions of each drug in untreated human plasma at a concentration of 10 μg/mL. Additionally, human plasma samples containing VCM obtained from treated patients were analyzed.
Plasma deproteinization was performed for the all samples in the same way, by adding 15.0 μL of perchloric acid to 200 μL of each and mixing for 30 s with a vortex mixer. Eventually, these solutions were centrifuged at 6000 rpm for 4 min. Finally, the supernatant of each solution was transferred to vials and 20 μL were injected into the chromatographic system.
Results
Optimization of Chromatographic Conditions
An optimization procedure was performed to establish the values of the most relevant factors that conform to specific criteria for the chromatographic system. The optimization criteria and the levels of the analyzed factors were established taking into account prior considerations.
First, it was necessary to evaluate the possible interferences that can be present in the human plasma samples due to concomitant drugs, which are usually co-administrated with VCM. For this purpose, several pharmaceuticals were analyzed. For this analysis, initial chromatographic conditions, i.e., Buffer:MeOH (85:15), pH of buffer solution = 3.50 and column compartment at 30°C. Under these conditions, only ceftazidime (CAZ) and trimethoprim (TMP) showed similar chromatographic characteristics to VCM, e.g., retention time and spectral features. Thus, they were included in the analytic system used for the optimization procedure.
Moreover, three process variables were evaluated in the following ranges: 1) 2.50 – 4.50 for the pH of the phosphate buffer of the mobile phase; 2) 14.0% – 16.0% MeOH in the mobile phase; and 3) 20.0 °C – 40.0 °C for the column compartment temperature. The process factors and the evaluated ranges were selected on the basis of previous experiments. Then, the optimization criteria were established in order to minimize the time of the analysis, but with the requirement of maximum peak purity of VCM and total resolution between VCM, CAZ and TMP.
For the optimization, a Box-Benkhen Design (BBD) was built by combination of different levels of the mentioned process variables. Thus, a total of 17 experiments were performed in 3 blocks (3 consecutive days). Therefore, in order to minimize the systematic error, the experiments were carried out following a random order.
After performing the experiments, four responses were fitted to suitable mathematical models, i.e., resolution between VCM and CAZ peaks (R1), resolution between VCM and TMP peaks (R2), retention time of VCM (T) and peak purity of VCM signal (P). It is worthwhile noticing that, for R1 (VCM-CAZ resolution), transformed response, y = 1/y, was utilized in order to achieve variance stabilization and normal distribution of the residuals. The appropriate transformation function was selected by using the Box-Cox graphical strategy[33].
The mathematical model follows the general expression of a polynomial model, which is expressed as:
y = β0 + Σ(i = 1)kβi xi + Σ(1 ≤ i ≤ j)kβij xixj + Σ(i = 1)kβii xi2 + ε (1)
Where y is the response to be optimized, xij are the process factors, β0 is the overall mean effect, βi represents the effect of the factor xi, βij is the effect of the ij interaction between the factors xi and xj, and ε is a random error component. The coefficients were calculated by multiple regression technique and least square methodology, then, they were evaluated using the Analysis of Variance (ANOVA) test. Thus, the model was considered satisfactory when the regression fitting was significant for a confidence level of 0.05, i.e., p values ≤ 0.05. The responses obtained for each combination of the BBD are depicted in [Table I]. [Table II] summarizes the results for the models fitting.
Table I: Box-Bhenken design used for the optimization of the chromatographic conditions.
| Run | Blocka | Factors | Responsesb | |||||
|---|---|---|---|---|---|---|---|---|
| pH | MeOH (%) | Temp (°C) | R1 | R2 | T (min) | P | ||
| 1 | 1 | 3.50 | 15.0 | 30.0 | 6.02 | 1.30 | 3.35 | 0.62 |
| 2 | 1 | 3.50 | 15.0 | 30.0 | 1.69 | 10.80 | 4.63 | 0.82 |
| 3 | 1 | 3.50 | 16.0 | 40.0 | 11.30 | - c | 5.70 | 0.81 |
| 4 | 1 | 3.50 | 14.0 | 40.0 | 7.45 | 10.90 | 6.28 | 0.96 |
| 5 | 1 | 3.50 | 15.0 | 30.0 | 1.90 | 11.00 | 4.76 | 0.66 |
| 6 | 1 | 3.50 | 16.0 | 20.0 | 16.10 | 0.50 | 5.60 | 0.72 |
| 7 | 1 | 3.50 | 14.0 | 20.0 | 2.05 | 10.80 | 4.47 | 0.75 |
| 8 | 1 | 3.50 | 15.0 | 30.0 | 14.40 | 0.50 | 8.99 | - |
| 9 | 1 | 3.50 | 15.0 | 30.0 | 5.06 | 4.38 | 5.27 | 0.97 |
| 10 | 2 | 2.50 | 16.0 | 30.0 | 1.79 | 11.00 | 4.67 | 0.68 |
| 11 | 2 | 2.50 | 14.0 | 30.0 | 1.96 | 10.10 | 5.27 | 0.93 |
| 12 | 2 | 2.50 | 15.0 | 40.0 | 8.72 | 10.80 | 5.80 | 0.92 |
| 13 | 2 | 2.50 | 15.0 | 20.0 | 13.20 | 5.32 | 9.22 | - |
| 14 | 3 | 4.50 | 15.0 | 40.0 | 13.10 | 0.50 | - | - |
| 15 | 3 | 4.50 | 15.0 | 20.0 | 4.53 | 14.50 | 3.62 | 0.63 |
| 16 | 3 | 4.50 | 14.0 | 30.0 | 1.84 | 11.10 | 4.71 | 0.92 |
| 17 | 3 | 4.50 | 16.0 | 30.0 | 1.95 | 10.70 | 4.71 | 0.80 |
athe blocks represent the different working days.
bR1: resolution between VCM and CAZ peaks; R2: resolution between VCM and TMP peaks; T: retention time of VCM giving in minutes; and P: peak purity of VCM signal.
cData not shown. The values were not considered for the fitting due to the disproportionate influence in the models.
Table II: Mathematical models obtained for the fitting of the responses.
| Response | Model | Significant terms a | ANOVAb | |
|---|---|---|---|---|
| Model | Lack of fit | |||
| R1 | Quadratic | AC, A2, B2, C2 | < 0.0001 | 0.1557 |
| R2 | Quadratic | A, B, C, AC, BC, A2, B2, C2 | < 0.0001 | 0.3510 |
| T | Quadratic | A, B, C, AB, AC, BC, A2, B2, C2 | < 0.0001 | 0.3849 |
| P | 2FIc | AB, BC | 0.0074 | 0.8508 |
aA = proportion of methanol in the mobile phase given in %, B = pH of the buffer solution in the mobile phase, C = Temperature of the column compartment given in °C
bANOVA: Analysis of variance with a probability value of p = 0.05.
c2FI indicates a model with linear terms and interaction
The four responses were simultaneously optimized by using the desirability function with the criteria that are depicted in [Table III]. Under these optimization criteria, the experimental conditions that correspond to the one maximum value of the desirability function (D = 0.50) were: phosphate buffer solution pH 2.75; 15.0 % MeOH in the mobile phase and 40 °C for the column compartment. As example, the response surface of the global desirability for pH and MeOH percentage is depicted in [Figure 2]. The values obtained by optimization were experimentally checked and the corresponding responses were compared with those predicted by the models. Excellent correlation between them was found, reaching values of R1 = 6.76, R2 = 6.84, T = 4.52 min and P = 91.0 %. As it can be shown in [Figure 3], under optimal chromatographic conditions, monitoring at 240 nm, plasma components and all the pharmaceuticals analyzed are completely resolved in a total run time of 10 min.
Table III: Criteria for the optimization of the individual responses.
| Response | Goal | Lower limit | Upper limit |
|---|---|---|---|
| R1 | In range | 1.50 | 8.00 |
| R2 | Maximize | 1.50 | 8.00 |
| T | Minimize | 3.35 | 5.00 |
| P | Maximize | 0.86 | 0.97 |

Figure 2: Global desirability response surface as a function of two factors: pH and MeOH content of the mobile phase.
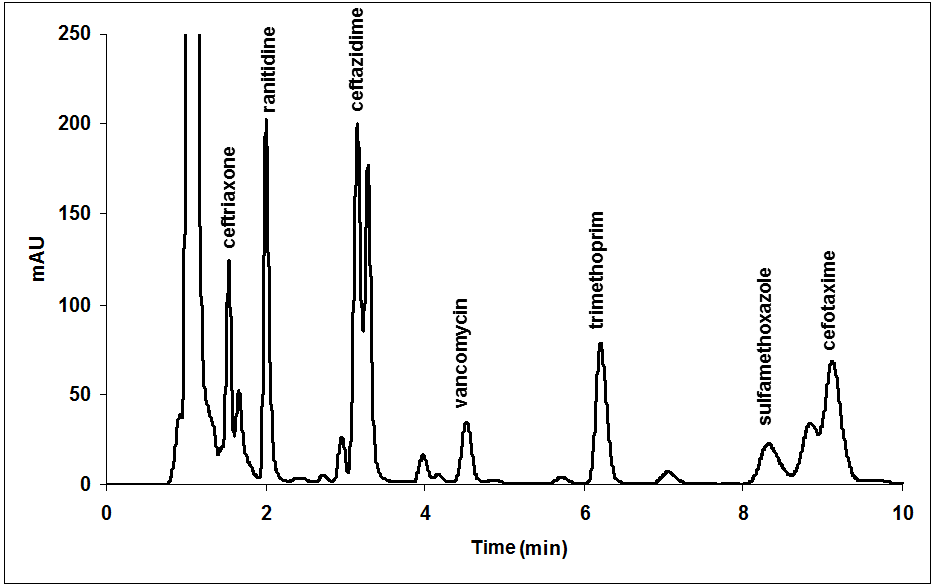
Figure 3: Chromatogram obtained at 240 nm in the optimized condition for a human plasma containing 10 μg/mL of VCM and frequently co-administrated drugs.
Discussion
Method Validation
Selectivity
The study of selectivity was carried out by evaluating the possible interferences generated by the endogenous components of plasma, by hemolysis and by co-administrated medication. For the first, six individual plasma samples obtained from untreated volunteers were analysed. For hemolysis study whole blood samples from six patients treated with VCM were frozen for 30 minutes at -20°C and thawed at room temperature. Hemolyzed plasmas obtained by this procedure were analysed. No peak was observed in the retention time of VCM in the blank plasmas, nor in the hemolyzed ones [Figure 4]. Finally, analytical signal of co-administrated medications that absorb at the wavelength employed for VCM detection (ceftriaxone, ranitidine hydrochloride, CAZ, TMP, sulfamethoxazole and cefotaxime) were evaluated. All these drugs presented excellent resolution with the peak of VCM [Figure 3].
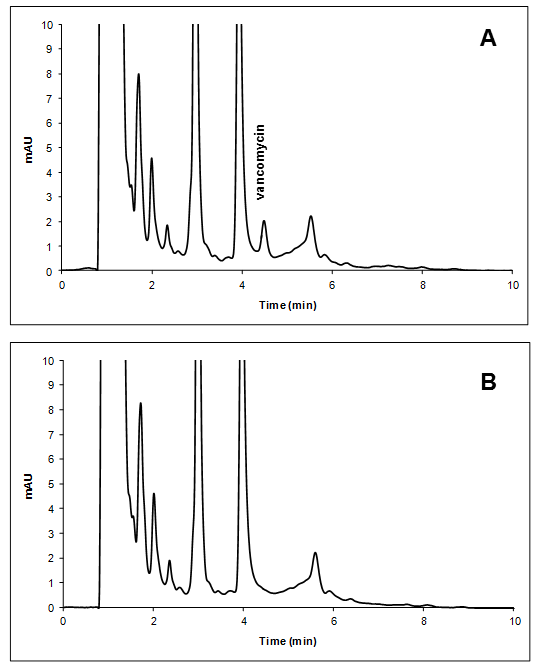
Figure 4: Chromatogram of blank plasma spiked with VCM in the LLOQ (A) compared with hemolyzed blank plasma (B).
Linearity and lower limit of quantification
Linearity was evaluated by analyzing calibration standard solutions in duplicate at seven concentration levels in the range of 1.00 μg/mL and 60.00 μg/mL of VCM. For LLOQ determination calibration standards of 0.50, 1.00 and 2.00 μg/mL of VCM were analyzed and the predicted concentrations were calculated. The lowest concentration of VCM that satisfied the EMA specifications for LLOQ (CV ≤ 20% and back calculated concentration within ± 20 % of nominal value) was 1.00 μg/mL, for which a CV of 4.1% and 109% of nominal concentration were obtained. Then, three calibration curves were obtained in three different days. The curves were adjusted with linear models, which did not showed significant lack of fit considering 95% confidence level. Besides, the differences between the slopes of the three calibration curves were not statistically significant. The respective linear regression equations for the three calibration curves were found to be y = 13.0x + 3.17, y = 12.7x + 0.50 and y = 11.4x + 3.77, respectively.
Additionally, back calculated concentrations of the calibration standard solutions were obtained by using the calibration curves obtained. The back calculated concentrations were always within a range of ± 15% of the nominal value, meeting the EMA criteria.
Accuracy and precision
The accuracy and the precision of the method were assessed through a recovery study that includes the determination of VCM in the QC samples. For this, the calibration curves obtained were utilized to predict the concentration in the QC samples and the predicted concentrations were compared with the corresponding nominal value. The CV values computed to evaluate precision were below 15% in all cases, and the mean of the predicted concentrations show variations within 15% of the nominal concentration, except for LLOQ, which was within 20%. All these results (Table IV), which meet the EMA criteria, assert the accuracy and the precision of the developed method.
Dilution integrity and stability of the standard solution
Dilution integrity was evaluated to ensure that a sample with a VCM concentration above the Upper Limit of Quantitation (ULOQ) can be diluted without affecting the precision and the accuracy of the method. For this purpose, 100 μL of a > ULOQ plasma sample of 100 μg/mL of VCM was diluted in 400 μL of blank plasma obtaining a final VCM concentration of 20.0 μg/mL. Then, predictions of five independent solutions were performed. The results showed recoveries ranging from 90% - 110% and CV values that do not exceed 2.4%. These figures demonstrate that neither the accuracy nor the precision are affected for the sample dilution.
Table IV: Values obtained when analysing QC samples.
| QC | Nominala | Predictedb | Mean Accuracy (%) | CV (%) | ||||
|---|---|---|---|---|---|---|---|---|
| intra-day | inter-day | Day 1 | Day 2 | Day 1 | Day 2 | |||
| QC-LLOQ | 0.99 | 0.94 | 0.98 | 94 | 98 | 2.2 | 6.7 | |
| QC-L | 2.99 | 3.14 | 3.11 | 106 | 104 | 11 | 11 | |
| QC-M | 29.8 | 32.3 | 28.3 | 108 | 95 | 6.2 | 7.1 | |
| QC-H | 45.2 | 46.4 | 43.0 | 102 | 95 | 4.1 | 7.0 | |
aVCM concentrations are given in μg/mL
bEach mean value is the average of five replicates.
The stability of the standard aqueous solution of VCM was evaluated over a period of seven days. For this purpose, the solution that was stored in the dark at -4°C, was analyzed by periodically injecting several aliquots in the HPLC system and the area of the VCM peak was evaluated. The results demonstrated that the area of the VCM peak remains unchanged until the third day of analysis and no significant degradation was observed over this time. Then, a detriment of more than 20% with respect to the area obtained in the first day of analysis was observed. However, no secondary peaks were found at the working wavelength. These results suggest that the standard solution of VCM can be stored at -4°C for a maximum period of three days.
Conclusion
The method developed for the determination of VCM in plasma by high performance liquid chromatography is fast, selective, accurate and precise, requiring only 200 μL of patient plasma. This small volume of sample makes this method suitable for drug monitoring in pediatric patients and for pharmacokinetics studies in neonate.
The application of experimental design and multiple response optimizations enabled to assure efficient resolution of the analyte signal from possible interferences produced by concomitant medication in a complete run time of ten minutes. The use of core-shell particles was an important additional tool for reducing the analyses time, and also contributed to the reduction of organic solvents employed during the runs.
Conflict of interest: Authors doesn’t have any conflict of interest.
Financials: This work was supported by Universidad Nacional del Litoral (Project CAI+D 2011 N°: PI-50120110100025 LI).
References
1. Moellering, R.C. Vancomycin: A 50-Year Reassessment. (2006) Clin Infect Dis 42(1): 3-4.
2. Molinari, H., Pastore, A., Lian, L.Y., et al. Structure of Vancomycin and a Vancomycin/D-Ala-D-Ala Complex in Solution. (1990) Biochem 29(9): 2271-2277.
3. Liu, C., Bayer, A., Cosgrove, S.E., et al. Clinical Practice Guidelines by the Infectious Diseases Society of America for the Treatment of Methicillin Resistant Staphylococcus aureus Infections in Adults and Children. (2011) Clin Infect Dis 52(3): 18-55.
4. De Vedia, L., López Furst, M.J., Scapellato, P., et al. Tratamiento de las infecciones invasivas por Staphylococcus aureus meticilino resistente adquirido en la comunidad. (2014) Actualiza en SIDA e infect 22: 53-63.
Pubmed||Crossref||Others
5. Matsumoto, K., Takesue, Y., Ohmagari, N., et al. Practice guidelines for therapeutic drug monitoring of vancomycin: a consensus review of the Japanese Society of Chemotherapy and the Japanese Society of Therapeutic Drug Monitoring. (2013) J Infect Chemother 19(3): 365-380.
6. Gomez, D.S., Campos, E.V., de Azevedo, R.P., et al. Individualised vancomycin doses for paediatric burn patients to achieve PK/PD targets. (2013) Burns 39(3): 445-450.
7. Jacoba, J.T., Diaz Granados, C.A. High vancomycin minimum inhibitory concentration and clinical outcomes in adults with methicillin-resistant Staphylococcus aureus infections: a meta-analysis. (2013) Int J Infect Dis 17(2): e93-e100.
8. Rybak, M.J. The Pharmacokinetic and Pharmacodynamic Properties of Vancomycin. (2006) Clin Infect Dis 42(1): 35-39.
9. Lodise, T.P., Lomaestro, B., Graves, J., et al. Larger vancomycin doses (at Least Four Grams per Day) are associated with an increased incidence of nephrotoxicity. (2008) Antimicrob Agents Chemother 52(4): 1330-1336.
10. Ingram, P.R., Lye, D.C., Tambyah, P.A., et al. Risk factors for nephrotoxicity associated with continuous vancomycin infusion in outpatient parenteral antibiotic therapy. (2008) J Antimicrob Chemother 62(1): 168-171.
11. Ghehi, M.T., Rezaee, S., Hayatshahi, A., et al. Vancomycin Pharmacokinetic Parameters in Patients Undergoing Hematopoietic Stem Cell Transplantation (HSCT). (2013) Int J Hematol Oncol Stem Cell Res 7(4): 1-9.
12. Takahashi, Y., Takesue, Y., Takubo, S., et al. Preferable timing of therapeutic drug monitoring in patients with impaired renal function treated with once daily administration of vancomycin. (2013) J Infect Chemother 19(4): 709-716.
13. Zhao, W., Zhang, D., Fakhoury, M., et al. Population Pharmacokinetics and Dosing Optimization of Vancomycin in Children with Malignant Hematological Disease. (2014) Antimicrob Agents Chemother 58(6): 3191–3199.
14. Medellín-Garibay, S.E., Ortiz-Martín, B., Rueda-Naharro, A., et al. Pharmacokinetics of vancomycin and dosing recommendations for trauma patients. (2016) J Antimicrob Chemother 71(2): 471–479.
15. Álvarez, R., López Cortés, L.E., Molina, J., et al. Optimizing the Clinical Use of Vancomycin. (2016) Antimicrob Agents Chemother 60(5): 2601-2609.
16. Kato, H., Hagihara, M., Nishiyama, N., et al. Assessment of optimal initial dosing regimen with vancomycin pharmacokinetics model in very low birth weight neonates. (2017) J Infect Chemother 23(3): 154-160.
17. Wilson, J.F., Davis, A.C., Tobin, C.M. Evaluation of commercial assays for vancomycin and aminoglycosides in serum: a comparison of accuracy and precision based on external quality assessment. (2003) J Antimicrob Chemother 52(1): 78-82.
18. Khataee, A.R., Hasanzadeh, A., Iranifam, M., et al. nanosheets-enhanced flow-injection chemiluminescence system for determination of vancomycin in water, pharmaceutical and human serum. (2014) Spectrochim Acta A: Mol Biomol Spectrosc 122: 737-743.
19. Najjar, T.A., AI-Dhuwailie, A.A., Tekle, A. Comparison of high-performance liquid chromatography with fluorescence polarization immunoassay for the analysis of vancomycin in patients with chronic renal failure. (1995) J Chromatogr B Biomed Appl 672(2): 295-299.
Pubmed||Crossref||Others
20. Oyaert, M., Peersman, N., Kieffer, D. Novel LC–MS/MS method for plasma vancomycin: Comparison with immunoassays and clinical impact. (2015) Clinica Chimica Acta 441: 63-70.
21. Samardzic, J., Smits, A., Spriet, I., et al. Different Vancomycin Immunoassays Contribute to the Variability in Vancomycin Trough Measurements in Neonates. (2016) BioMed Res Int 1-4.
22. Putty, S., Vemula, H., Bobba, S., et al. A liquid chromatography–tandem mass spectrometry assay for D-Ala-D-Lac: A key intermediate for vancomycin resistance in vancomycin-resistant enterococci. (2013) Anal Biochem 442(2): 166-171.
23. Cheng, C., Liu, S., Xiao, D., et al. LC–MS/MS method development and validation for the determination of polymyxins and vancomycin in rat plasma. (2010) J Chromatogr B Analyt Technol Biomed Life Sci 878(28): 2831-2838.
24. Muppidi, K., Pumerantz, A.S., Betageri, G., et al. Desarrollo y validación de un método rápido de cromatografía líquida de alta resolución con detección UV para la determinación de vancomicina en plasma de ratón; Cromatografía y Técnicas de Separación. (2013) 4: 1-6.
Pubmed||Crossref||Others
25. Usman, M., Hempel, G. Development and validation of an HPLC method for the determination of vancomycinin human plasma and its comparison with an immunoassay (PETINIA). (2016) Springer Plus 5(124): 1-7.
26. Hayes, R., Ahmed, A., Edge, T., et al. Core–shell particles: Preparation, fundamentals and applications in high performance liquid chromatography. (2014) J Chromatogr A 1357: 36-52.
27. Ye, G., Cai, X., Wang, B., et al. Simultaneous determination of vancomycin and ceftazidime in cerebrospinal fluid in craniotomy patients by high-performance liquid chromatography. (2008) J Pharm Biomed Anal 48(3): 860-865.
28. Vera López, K.J., Faria Bertoluci, D., Vicente, K.M., et al. Simultaneous determination of cefepime, vancomycin and imipenem in human plasma of burn patients by high-performance liquid chromatography. (2007) J Chromatogr B Analyt Technol Biomed Life Sci. 860(2): 241-245.
29. Furuta, I., Kitahashi, T., Kuroda, T., et al. Rapid serum vancomycin assay by high-performance liquid chromatography using a semipermeable surface packing material column. (2000) Clinica Chimica Acta 301(2): 31-39.
30. Dejaegher, B., Vander Hoydens, Y. Experimental designs and their recent advances in set-up, data interpretation, and analytical applications. (2011) J Pharm Biomed Anal 56(2): 141-158.
31. Almeida Bezerra, M., Santelli, R.E., Oliveira, E.P. Response surface methodology (RSM) as a tool for optimization in analytical chemistry. (2008) Talanta 76(5): 965-977.
32. Leardi, R. Experimental design in chemistry: A tutorial. (2009) Anal Chim Acta 652(2): 161-172.
33. Vera Candioti, L., De Zan, M.M., Cámara, M.S., et al. Experimental deign and multiple response optimizations Using the desirability function in analytical methods development. (2014) Talanta 124: 123-138.
34. European Medicines Agency Guideline on bioanalytical method validation. (2011)
Pubmed||Crossref||Others


