
Biodiversity studies on bioeroding sponges infesting brown mussel of the south west coast of India
P. Sunil kumar*, P.A. Thomas
Affiliation
*Central Marine Fisheries Research Institute Kochi, India
Corresponding Author
P. Sunil kumar. Central Marine Fisheries Research Institute, Kochi, India. E-mail: sukkuedavetty2012@gmail.com
Citation
Sunil Kumar, p., et al. Biodiversity Studies on Bioeroding Sponges Infesting Brown Mussel of the South West Coast of India. (2015) J Marine Biol Aquacult 1(2): 1- 3.
Copy rights
© 2015 Sunil Kumar, P. This is an Open access article distributed under the terms of Creative Commons Attribution 4.0 International License
Keywords
Brown mussel; Biodiversity indices; Southwest coast; India
Abstract
A study on the biodiversity indices of boring sponges infesting the brown mussel population of the southwest coast of India was attempted in this paper. Four species, Cliona lobata, Cliona vastifica, Cliona celata and Cliona margaritifera were identified from Station 1, Vizhinjam. From Station II maximum number of species were identified and they are in the order of abundance; Cliona lobata, Cliona vastifica, Cliona celata, Cliona margaritifera, Cliona carpenteri, Thoosa armata, Thoosa hancocki, Aka minuta and Alectona millari. Cliona lobata, Cliona vastifica, Cliona celata and Cliona margaritifera were identified from station III, Colachel and Cliona lobata, Cliona vastifica, Cliona celata, Cliona margaritifera and Cliona carpenteri from Station IV, Kadiyapatnam. Pielou’s[1] index (D) was the highest at Station I (1.17) and the lowest at station 2 (0 .89). Shannon Weaver function[2], H (S), was the highest at Station II (1 .85), showing maximum number of species (s = 8), while it was lowest at Station 1 (1 .62) with the least number of species (s = 4).
Introduction
The Porifera is one among the rare groups of animals on which the biodiversity data have already been documented. In the case of this group, species information and related data are scanty. Therefore universal documentation tools and active communication among taxonomists working in related areas are highly imperative. Computer based biodiversity system has been developed as a universal tool for the documentation of biodiversity data. Linnaeus II software developed by Expert centre for taxonomic identification provides a helping hand for the documentation of biodiversity data on sponges[3].
Biodiversity data have hardly been documented in the case of bioeroding sponges. In the case of this group, species Information and related data are scanty. Therefore universal documentation tools and active communication among taxonomists working in different areas and related fields are highly imperative. Taxonomic and distributional data are essential for the study of sponge biodiversity. Modern multimedia techniques can be applied for biodiversity studies. Computer- based Biodiversity information system has been developed as a universal tool for biodiversity documentation. The Linneaus II software developed by ETI (Expert Centre for Taxonomic Identification) provides a helping hand for the documentation of biodiversity data on sponges[3].
As per the reports of the Zoological survey of India the Indian invertebrate fauna comprises 89,451 species. Some groups of invertebrates have been well documented in the past while others are not. Only very few studies have been made on the taxonomy and biodiversity of rare groups especially the marine sponges. As India is a Signatory to the GATT and Biodiversity Convention (BDC), it is mandatory on our part to study, document and utilize our biodiversity wealth for the betterment of humanity.
Materials and Methods
Four major landing centres were selected during the present study and these were, from north to south, Vizhinjam (Stn. 1), Enayam (Stn.2), Colachel (stn.3) and Kadiyapatnam (Stn. 4) (Map 1). A sample of 100 mussels was collected at random from each centre from different units once or twice every month for a period of one year. The methods suggested by Old[4], Thomas[5], Thomas, et al.[6] Schonberg[7,8] were followed for preparing spicules and for biodiversity studies. The following statistical methods were used in the present study:
1. Species richness index[9]
2. Simpson’s Index or species concentration factor[10]
3. Shannon Weaver diversity index[2] 4. Heips evenness index[11]
5. Species dominance index[1]
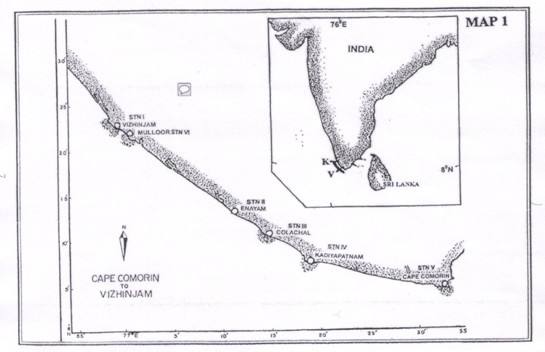
Figure 1:
Results and Discussion
The sponge fauna of India is dominated by species of Demospongiae followed by those of hyalospongiae and Calicospongiae. Also 34 species of coral boring sponges have been recorded. The Gulf of Mannar and Palk Bay region has the highest diversity. 319 species followed by Andaman and Nicobar Islands 95 species, Lakshadweep 82 species and Gulf of Kutch 25 species[12]. Values of five diversity indices calculated for each sample are given in Table 1 A & B. Number of species (S) is defined as the total number of species encountered at the station. The number of species at the stations covered ranges from 4 (Station I) to 9 (Station II).
Pielou’s[1] index (0) is concerned with the dominance of species. At the stations covered, it is the highest at Station I (1.17) and the lowest at station 2 (0 .89). Species dominance is inversely related to the number of species. The mean (x), standard deviation (Cr) and the coefficient of variation (%) of this index in this study being 1.05, 0.11 and 10.4 correspondingly.
Simpson’s[10] index (Sp) of the degree of concentration or diversity is almost uniform for the Stations I, II and IV (0.999) covered, but it is relatively low at Station III (Sp = 0.996). Mean of this index is 0.998, standard deviation and coefficient of variation being 0.001 and 0.14 respectively.
Margalef’s[9] index (d varies from 0.63 (Station 1) to 1.12 (Station 2), mean, standard deviation and coefficient of variation being 0.88, 0.1 8 and 19.97 respectively.
Table 1A: Biodiversity Indices
| Station | Margalef index (d) | Simpsons index (Sp) | Shannon index H(S) | Pielou’s index (D) | Heip’s index (E) | No. of species (S) |
|---|---|---|---|---|---|---|
| 1 | 0.6346 | 0.9990 | 1.6191 | 1.680 | 1.349 | 4 |
| 2 | 1.1238 | 0.9997 | 1.8537 | 0.8914 | 0.769 | 9 |
| 3 | 0.9353 | 0.9960 | 1.6280 | 1.0115 | 1.023 | 4 |
| 4 | 0.8384 | 0.9985 | 1.8282 | 1.1359 | 1.305 | 5 |
Table 1B: Mean (x), Standard deviation (0) and Coefficient of variation (CV) of Biodiversity Indices
| Margalef index (d) | Simpsons index (Sp) | Shannon index H(S) | Pielou’s index (D) | Heip’s index (E) | |
|---|---|---|---|---|---|
| X | 0.883 | 0.998 | 1.732 | 1.051 | 1.111 |
| SD | 0.176 | 0.001 | 0.109 | 0.109 | 0.233 |
| CV | 19.972 | 0.139 | 6.299 | 10.400 | 21.050 |
Shannon Weaver function[2], H (S), is the highest at Station II (1 .85), showing maximum number of species (s = 8), while it is lowest at Station 1 (1 .62) with the least number of species (s = 4). Mean (x), standard deviation and coefficient of variation for this index are 1.73, 0.11 and 6.30 respectively.
Heip’s[11] index measures evenness of occurrence of species in a population. In the present study, it varies from 0.77 to 1.35. Low equitability indicates dominance of a few species, while high equitability reflects uniform distribution of species. Mean of this is 1.11, standard deviation and coefficient of variation being 0.23 and 21 .05 respectively.
519 species of sponges are known to occur in the Indian seas. Out of that 34 are coral boring have been reported from the Gulf of Mannar[13]. In the present study a total of nine species were identified from five stations along the south west coast of India. In conclusion, this study suggests that species number (s),Shannon- Weaver function, H(S) and Margalef’s index (d) are the lowest at Station 1 (S = 4, H (S)200 = 1.62 and d = 0.63) and the highest number of species and the greatest diversity at Station II (s = 8, H(S) = 1.85 and d = 1.12).
References
- 1. Pielou, E.C. Measurement of structure in animal communities. In: Ecosystem structure and function" (J. A. Wiens, Ed.) (1971) Proc. 31st Annual Biology Colloquim. Oregon State U. P., Portland. 415 pp.
- 2. Shannon, C.E., Weaver, W. The mathematical theory of communication, (1963) University of Illinois Pvers, Urbana 117 pp.
- 3. Rob, W.M., Van, Soest., Petrer, H.Schalk., et al., Por-Linneaus: The application of interactive multimedia software for species data storage and computer assisted identification of Porifera. (1996) BIOLOGIE 66 Suppl: 63-72.
- 4. Old, M.C. The Taxonomy and Distribution of the Boring Sponges (Clionidae) Along The Atlantic Coast Of North America. (1941) Chesapeake Biological Laboratory 44: 1-30.
- 5. Thomas, P.A. Boring Sponges of the Reefs of Gulf of Mannar and Palk Bay. (1972) Symp corals and coral reefs 333-362.
- 6. Thomas, P.A. Boring Sponges Destructive to Economically Important Molluscan Beds and Coral Reefs in Indian Seas. (1979) Indian J Fish 26(1-2): 163-200.
- 7. Schonberg, C.H.L. An Improved Method of Tissue Digestion for Spicule Mounts in Sponge Taxonomy. (1999) Mem Queensland Mus 44: 533-539.
- 8. Schonberg, C.H.L. Bioeroding sponges common to the Central Australian Great Barrier Reef: Descriptions of three new species, two new records and additions to two previously described species. (2000) Senckenbergiana maritima 30(3): 161-221.
- 9. Margalef, R. La teoria de la informacion en ecologia. (1957) Mem R Acad Barcelona 32 (3): 373-449.
- 10. Simpson, E.H. Measurement of diversity. (1949) Nature 163: 688.
- 11. Heip, C. A New Index Measuring Evenness. (1974) J mar boil Ass UK 54(3): 555-557.
- 12. Venketaraman, k. Coastal and marine biodiversity of India. (2005) Indian Journal of Marine Sciences 34(1): 57-75.
- 13. Thomas, P.A. An Appraisal of the Biological and Biochemical Diversity in the Sponges. (1996 a) Mar Fish Infor Ser 142: 1-5.


