
Changes of Hemodynamics and Blood Glucose during Tracheal Intubation in the Geriatrics with Different Glycosylated Hemoglobin Levels
Xiaoguang Guo1, Xiaoyan Zhou2, Jie Sun3
Affiliation
- 1Department of Anesthesiology, First Affiliated Hospital, Zhengzhou University, Zhengzhou, China
- 2Department of Anesthesiology, Nanjing eight one Hospital of People’s Liberation Army, Nanjing, China
- 3Department of Anesthesiology, First Affiliated Hospital, Nanjing Medical University, Nanjing, China
Corresponding Author
Yanning Qian, Department of Anesthesiology, The First Affiliated Hospital of Nanjing Medical University, No. 300, Guangzhou Road, Nanjing 210029, China, Tel: +86 25 8371 8836; Fax: +86 25 8420 0723; E-mail: yanning_qian@163.com
Citation
Qian, Y., et al. Changes of Hemodynamics and Blood Glucose during Tracheal Intubation in the Geriatrics with Different Glycosylated Hemoglobin Levels. (2017) J Anesth Surg 4(2): 77-81.
Copy rights
© 2017 Qian, Y. This is an Open access article distributed under the terms of Creative Commons Attribution 4.0 International License.
Keywords
Geriatrics; Glycosylated hemoglobin; Tracheal intubation; Hemodynamic; Blood glucose
Abstract
Background: The severe cardiovascular response following tracheal intubation has threatened geriatrics’ safety. HbA1c may be an independent risk predictor for the outcome of cardiovascular disease and/or DM. We investigated the relationship between preoperative HbA1c levels and changes of hemodynamic and blood glucose (Glu) during tracheal intubation in geriatrics.
Methods: 112 geriatric non-cardiac surgery patients undergoing general anesthesia were divided into 4 groups according to HbA1c levels (Group A, B, C and D). Mean arterial pressure (MAP) and heart rate (HR) were recorded before anesthesia induction (T0), just before intubation (T1), at intubation (T2), 1, 2, 3, 5, 8 and 10 minutes after intubation (T3-8). Glu Levels were measured at T0, T1, T6 and T8.
Results: Compared with group A or B, MAP decreased markedly at T1-8 in group C or D (P < 0.05). Compared with T0, HR decreased markedly at T1, T6-8 in group C and at T1-3, T5-8 in group D (P < 0.05). The TΔ (the difference value of MAP between T0 and T8 points) and the HΔ (the difference value of HR between T0 and T8 points) of all patients were highly correlated with preoperative HbA1c levels [TΔ (mmHg) = -9.436 HbA1c + 25.94, R2 = 0. 368; HΔ (bpm) = -6.172 HbA1c + 26.842, R2 = 0.208].
Conclusion: Preoperative high HbA1c level may contribute to significant hemodynamic changes and significant increased blood Glucose levels after tracheal intubation, especially for elder patients with HbA1c > 7 %.
Introduction
Plasma haemoglobin A1c (HbA1c) represents the most prevalent glycohemoglobin (GHb) which is formed by the slow irreversible, non-enzymatic glycation of valine and lysine residues in the haemoglobin molecule[1]. As the postsynthetic modifications of HbA irreversibly form GHb, the HbA1c concentration constitutes a reliable, integrated measure of the average blood glucose concentration over the life spans of circulating red cells. Measurement of HbA1c is widely used in clinical practice to reflect mean ambient fasting and postprandial glycaemia over a 2 – 3 months period[2,3]. HbA1c level has added to a diagnosis criteria of diabetes mellitus (DM) by the American Diabetes Association (ADA) in 2010[4]. As the increasing incidence of cardio-cerebrovascular complications in DM patients, the relationship between the HbA1c level and the cardio-cerebrovascular complications has sparked growing interests within the past years. U. Krishnamurti et al reported HbA1c was an independent risk predictor for the outcome of cardiovascular disease and/or DM[5].
Anesthesia induction is the essential process of anesthesia. We should keep equability during the induction, avoid oxygen deficit and the cardiovascular suppression, ensure adequate anesthesia depth, and eliminate the stress reaction of tracheal intubation. It has been demonstrated that elderly patients have an increased risk of hypotension during anesthesia induction[6,7]. As we know, the aged people usually represent with degenerative organs function, especially the cardiovascular system. DM accelerated the degenerative changes of cardiovascular system, thus lead to instability of hemodynamics, unbalance of oxygen supply, cardiovascular intolerance to anesthesia induction, increased perioperative complication, and mortality[8,9]. A preliminary study showed[10] the elevated HbA1c levels of elderly DM before surgery was a predictor for tracheal intubation response variation. The response would be more obvious while the level of HbA1c exceeded 6.5 %. But no research focuses on the relationship between different HbA1c levels and intubation response.
In the present study, we observed the changes of hemodynamics and blood glucose levels during tracheal intubation in elderly patients with different preoperative HbA1c levels, especially HbA1cl > 7%, in order to explore whether the HbA1c level was an preoperative predictor of the cardiovascular response to tracheal intubation in aged DM patients.
Materials and Methods
Subjects Patients aged 65 - 74 years with American Society of Anesthesiologists status I II and scheduled for elective non-cardiac surgery under general anesthesia in our hospital from December of 2010 to May of 2011 were recruited for the study after approval by the Ethics Committee of Jiangsu Province Hospita and patients` written informed consent. We excluded patients with baseline artery blood pressure > 160/95 mmHg, intubation for more than once and a history of taking medications that might affect the cardiovascular system or block adrenergic responses to intubation. In no case were vasoactive medications used during induction. Based on their preoperative HbA1c levels, all patients were divided into 4 groups: the Group A (HbA1c < 5.7%, 24 cases), the Group B (5.7% ≤ HbA1c ≤ 6.4%, 34 cases), the Group C (6.5% ≤ HbA1c < 7%, 27 cases), the Group D (7% ≤ HbA1c ≤ 8%, 27 cases).
Anesthesia and monitoring
All the patients received intravenous access followed by lactate Ringer’s solution at 8 ml/Kg/h and radial artery pressure monitoring on the arrival to the operating room. The blood samples were collected for the levels of HbA1c by Latex Agglutinate Reaction Kit (Shanghai Shen Suoyou Medical Diagnostic Products Ltd.). The detection of glucose levels of all patients was performed by collecting blood samples from the patients’ right index fingers, and then examining using Johnson Blood Glucose Meter.
All patients underwent venous injection of midazolam 0.05 mg/kg, propofol 1.5 mg/kg, fentanyl 3 μg/kg and atracurium Besilate 0.15 mg/kg at a constant speed within 60 seconds and then received orotracheal intubation 2.5 minutes later by the same anesthetist. Every patient received intermittent positive pressure ventilation with tidal volume 6 ~ 8 ml/Kg, rate 12 ~ 13 bpm and ET CO2 was kept at 35 ~ 40 mmHg. In the study no anesthetics was given through the vein or respiratory tract except the drugs administered for induction and any implementation of the operations on the patients were forbidden including physical movement, catheterization and preparation for the operation area.
MAP and HR were recorded before anesthesia induction (T0), just before intubation (T1), at intubation moment (T2), 1, 2, 3, 5, 8, and 10 min after intubation (T3 ~ 8). The level of the artery blood glucose were respectively recorded at T0, T1, T6 and T8 using the fast blood glucose meter (Bayer Health Care, Germany).
Statistical Analyses
All the data were presented as means ± SD. Statistical analysis was performed by the SPSS 13.0 for Windows statistical software (SPSS Inc, Chicago, IL, USA). The data within the groups were compared with one way analysis of variance and the comparison between the two groups used covariance analysis. P-value less than 0.05 were considered as statistical significant. The major variables were also analyzed with linear correlation (R = correlation). 0.5 < R ≤ 0.8 was considered as significant correlation and 0.8 < R ≤ 1 means a strong correlation.
Results
Patients Charateristics: There were no significant differences in the gender, age, weight and intubation time among the four groups (Table 1)
Table 1:
| Group | Cases | Sex (male/female) | Weight (Kg) | Age(year) | Intubation time (s) |
|---|---|---|---|---|---|
| A | 24 | 12/12 | 60.21 ± 8.17 | 68.25 ± 4.95 | 54 ± 3 |
| B | 34 | 25/9 | 61.56 ± 9.67 | 66.18 ± 4.81 | 55 ± 5 |
| C | 27 | 16/11 | 63.93 ± 10.64 | 68.26 ± 4.78 | 54 ± 4 |
| D | 27 | 18/9 | 63.04 ± 9.59 | 67.11 ± 3.83 | 55 ± 3 |
Changes of MAP during anesthesia induction (Figure 1)
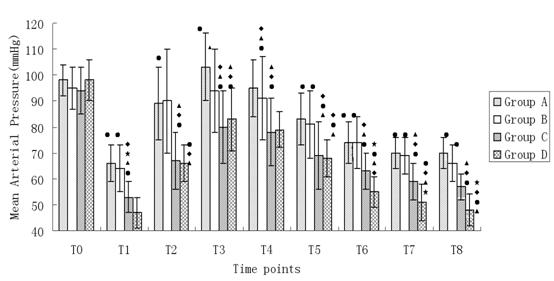
Figure 1: Changes of MAP during anesthesia induction. Compared with T0, •P < 0.05; Compared with A, ΔP < 0.05; Compared with B, ♦P < 0.05; Compared with C, *P < 0.05.
MAP at T0 in all groups had no significant difference (P > 0.05). MAP was significantly decreased at T1 in all the groups (P < 0.05). In group A, MAP at T3 was higher than that of T0 (P < 0.05), but in other groups MAP had a decrement tendency. MAP at T5-8 in group A and B and MAP at T2-8 in group C and D were significantly lower than their baseline value (P < 0.05). Compared with group A and B, MAP at all time points (T1-8) in group C and D was obviously lower (P < 0.05). Compared with group C, MAP at T1 and T6-8 in group D decreased significantly (P < 0.05).
Changes of HR during anesthesia induction (Figure 2)
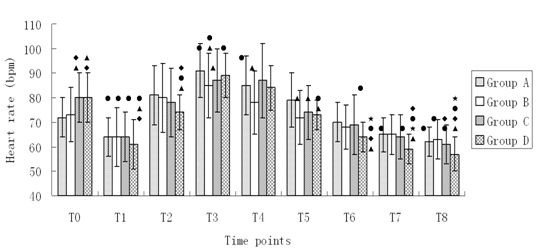
Figure 2: Changes of HR during anesthesia induction. Compared with T0, •P < 0.05; Compared with A, ΔP < 0.05; Compared with B, ♦P < 0.05; Compared with C, *P < 0.05.
HR values of patients at T0 in group A and B had no significant difference (P > 0.05). HR at T0 in group C and D was higher than that in group A and B (P < 0.05). Compared with HR at T0 in all four groups, HR obviously decreased at T1 (P < 0.05). HR was high at T3-4 in group A and at T3 group B and D (P < 0.05). HR significantly decreased at T7-8 in group A, at T8 in group B, at T6-8 in group C and T5-8, T2 at in group D (P < 0.05). Compared with HR at different time points after induction in group A, HR dropped more significantly at T3-5 in group B, at T3, T5 in group C and at T1-2, T5-8 in group D (P < 0.05). Compared with HR at different time points after induction in group B, HR significantly decreased at T1, T8 in group C and at T1-2 T6-8 in group D (P < 0.05). HR was obviously lower at T6-8 in group D compared with that at the time points after induction in group C (P < 0.05).
Changes of blood glucose during anesthesia induction (Figure 3)
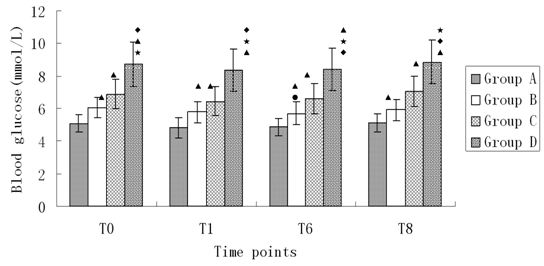
Figure 3: Changes of blood glucose during anesthesia induction. Compared with T0, •P < 0.05; Compared with A, ΔP < 0.05; Compared with B, ♦P < 0.05; Compared with C, *P < 0.05
Glucose levels at all time points in four groups increased as the HbA1c levels, and this increased tendency had significant difference (P < 0.05). There was no significant difference of glucose level at T6 in group B (P < 0.05). There was no significant difference of glucose level in other groups (P < 0.05).
The correlation between preoperative HbA1c levels and changes of MAP (Figure 4), HR (Figure 5) and glucose level at all time points.
The difference (TΔ) between MAP at T0 and that at T0 in all the patients was highly positively correlated to their preoperative HbA1c levels [TΔ (mmHg) = -9.436 HbA1c +25.94, R2 = 0. 368, P < 0.001]. The difference between HR at T0 and that at T0 in all the patients was positively correlated to their preoperative HbA1c levels [HΔ (bpm) = -6.172 HbA1c +26.842, R² = 0.208, P < 0.001]. The highly positive correlation also existed among preoperative HbA1c levels and glucose levels at T0, T1, T6 and T8 (T0glu = 1.682 HbA1c - 4.079, R² = 0.739, P < 0.001; T1glu = -4.079 + 1.682 HbA1c, R² = 0.715, P < 0.001; T6glu = -4.124 + 1.642 HbA1c, R² = 0.718, P < 0.001; T8glu = -4.419 + 1.741 HbA1c, R² = 0.737, P < 0.001, respectively).
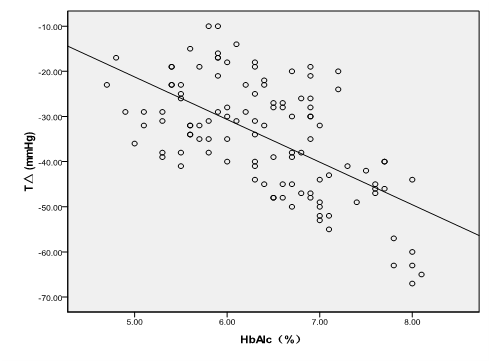
Figure 4: TΔ = the difference value of MAP between T0 and T8; TΔ had A statistically significant inverse correlation with the HbA1c levels [TΔ (mmHg) = -9.436 HbA1c + 25.94, R² = 0. 368, P < 0.001].
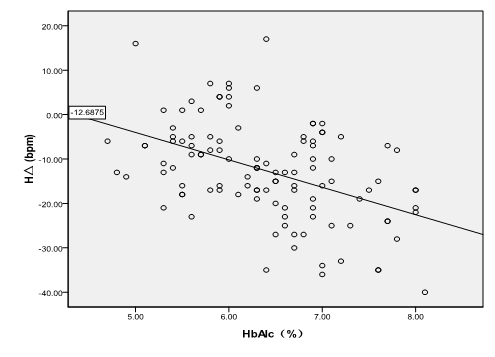
Figure 5: HΔ = the difference valve of HR between T0 and T8; The HΔ was statistically correlated with preoperative HbA1c levels [HΔ (bpm) = -6.172 HbA1c + 26.842, R² = 0.208, P < 0.001].
Discussion
HbA1c (Hemoglobin A1c, HbA1c), a form of hemoglobin, is measured primarily to identify the average blood Glu level over prolonged periods of time and suggested to be a golden standard for evaluating Glu level of DM for a long time. The Diabetic Guideline 2010 from the American Diabetes Association (ADA) added HbA1c ≥ 6.5% as a new dynamic criteria, and people with 5.7% ≤ HbA1c ≤ 6.4% were considered as at a high risk of diabetes in the 2010 Diagnosis and classification of diabetes mellitus. Diabetes Care.
As a systemic disease, the diabetes can lead to the pathological changes of tissues and organs all over the body, especially the micrangiums, and the degree of the pathological changes depending on the course of disease and the Glu level[11]. Moreover, the cardio-cerebrovascular complications of the diabetics have been the major course of the death of DM[12,13]. Gustavson et al[14], reported that the inflammatory markers such as C-reactive protein, fibrinogen, red blood cells subsidence ratio and white blood cells count in patients with coronary heart disease will increase with an increase of HbA1c levels, which suggested the increasing HbA1c levels may enhance the progression of coronary heart disease. In the Norfolk cohort of European prospective investigation of cancer and nutrition[15], the value of HbA1c levels was examined as a predictor of death from cardiovascular in all causes in men, and the result showed that an increase of 1% HbA1c was associated with a 28% increase in risk of death. This effect remained in people without diabetes. These studies suggested that the HbA1c level before operation might be considered as an important predictor for the risk of cardiovascular events in diabetic patients.
In our study, MAP at all time points (T1-8) of group C and D was obviously lower than that of group A and B. MAP at all time points in group D was clearly below that in group C. This result showed that the higher the preoperative HbA1c levels was, the lower MAP would happen after anesthesia induction. As a result, high HbA1c levels led to long-term hyperglycaemia, which may enhance the glycosylation and protein of the protein on the inner surface of blood vessels, and the following increased advanced glycation end products promoted the progression of atherosclerosis. The high endothelin and reduced secretion of NO and prostacylin (PGI2) owing to high blood glucose may also contribute to the injury of vascular endothelial cell. The high blood glucose may directly injure the endothelial cell[16,17]. So the higher the blood glucose is, the more severe the vasomotorial dysfunction will be, which may lead to the large fluctuations of MAP.
According to the diabetes diagnostics guideline of ADA, patients in the group C and D were diagnosed with diabetes. The baseline HR of patients in group C and D was higher that that in group A and B. This result may be due to the impaired function of cardiac autonomic nervous system of diabetes patients. HR dropped more significantly at T3-5 in group B, at T3, T5 in group C and at T1-2, T5-8 in group D than that in group B (P < 0.05). Compared with HR at different time points after induction in group B, HR decreased more sharply at T1, T8 in group C and at T1-2, T6-8 in group D (P < 0.05). HR was obviously lower at T6-8 in group D compared with that at the time points after induction in group C (P < 0.05). Such results reflected that the higher the HbA1c levels is, the weaker the acceleration of cardiac autonomic nervous conduction is. One study reported that a significant hemodynamic change emerged after the endotracheal intubation of diabetes patients, including low HR, hypotension and decreased cardiac output[18]. Another studies showed that the diabetes complication and cardiovascular risk may be associated with the impairment of parasympathetic nerve function[19,20]. In group A, MAP at T3 was higher than that at T0, and HR at T3, T4 was also higher than that at T0. This hemodynamic change was a normal stress response to tracheal intubation in older patients, which reflected the normal functions of cardiac autonomic nervous system in these patients.
HbA1c values may serve as biomarkers for glucose control during the perioperative period in patients with diabetes[ 21]. In the current study, patients with higher HbA1c had higher preoperative and operative blood glucose, which was consistent with the Moitra’s results.
All the results of the present study indicated that the elder diabetics with higher HbA1c levels presented with significant hemodynamic changes especially when HbA1c ≥ 7%. The standards of medical care in diabetes 2010 of ADA recommended the HbA1c level in patients with diabetes should be regulated around 7% or below so as to reduce the incidence of microvascular and neurological complications. A previous prospective study of elevated HbA1c and increased risk of adverse outcome following surgical intervention by O’Sullivan CJ et al demonstrated that patients with or without diabetes with suboptimal HbA1c levels had a higher incidence of 30-day postoperative morbidity compared to those with optimal HbA1c levels and the high HbA1c level may have prognostic significance in patients without diabetes undergoing vascular surgery[22]. This previous result was consistent with that of our current study. Then the preoperative HbA1c level of the geriatrics should be paid great importance by the anaesthetists to make preoperative evaluation so as to maintain perioperative hemodynamics steadily and the balance of vital organs oxygen delivery and consumption.
The changes of MAP, HR at different time points in group A and B were less than those in group C and D. The blood glucose levels before and during the surgery in group B were higher than those in group A. Patients in group B (HbA1c 5.7% - 6.4%) classified as people at a high risk of diabetes in the ADA 2010, had over 10 times of the incidence of diabetes than patients with lower HbA1c levels and active interventions were needed. Long-term hyperglycaemia could facilitate the generation of HbA1c, and one study[23] showed that HbA1c decreased the erythrocyte deformability and increased the binding affinity with oxygen of red blood cells. A prospective cohort study demonstrated that HbA1c levels predict insulin sensitivity during surgery which was associated with an increased risk of major complications including mortality, heart failure, stroke, independent of the diabetic state[24].
In our study, the changes of MAP and HR during induction and tracheal intubation in geriatrics had a significant correlation with the preoperative HbA1c levels. The intra-operative blood glycose levels at the four time points were respectively highly relevant to preoperative HbA1c levels. We acknowledge several limitations of our study. Colayco et al reported that highrisk patients with type 2 diabetes who failed to decrease HbA1c to < 8% were at increased risk for cardiovascular events[25]. We didn’t collect enough cases of elder patients with HbA1c > 8% within limited duration, which may be the reason for the deficiency of more remarkable hemodynamic changes.
In conclusion, our current study demonstrated the geriatrics with higher HbA1c level presented with significant hemodynamic changes and significant increased blood glucose levels after tracheal intubation, especially for elder patients with HbA1c > 7%, and these changes were highly correlated with the preoperative HbA1c levels. Thus, it suggested that elevated glycosylated hemoglobin level could predict severe changes of hemodynamics and blood glucose level during tracheal intubation in elderly diabetics.
Acknowledge:
All authors have no financial support and potential conflicts of interest for this work.
References
- 1. Huisman, T.H., Martis, E.A., Dozy, A. Chromatography of hemoglobin types on carboxymethylcellulose. (1958) J Lab Clin Med 52(2): 312-3127.
Pubmed || Crossref || Others - 2. Koenig, R.J., Peterson, C.M., Jones, R.L., et al. Correlation of glucose regulation and hemoglobin AIc in diabetes mellitus. (1976) N Engl J Med 295(8): 417-420.
Pubmed || Crossref || Others - 3. Gillett, M.J. International Expert Committee report on the role of the A1c assay in the diagnosis of diabetes. (2009) Diabetes Care 30(4): 1327-1334.
Pubmed || Crossref || Others - 4. American Diabetes Association. Standards of medical care in diabetes 2010. (2010) Diabetes Care 33(suppl 1): S11–S61.
Pubmed || Crossref || Others - 5. Krishnamurti, U., Steffen, M.W. Glycohemoglobin: a primary predictor of the development or reversal of complications of diabetes mellitus. (2001) Clinical Chemistry 47(7): 1157–1165.
Pubmed || Crossref || Others - 6. Hug, C.C., McLeskey, C.H., Nahrwold, M.L., et al. Hemodynamic effects of propofol: data from over 25,000 patients. (1993) Anesth Analg 77(4 suppl): S21-S29.
Pubmed || Crossref || Others - 7. Michelsen, I., Helbo-Hansen, H.S., Kohler, F., et al. Prophylactic ephedrine attenuates the hemodynamic response to propofol in elderly female patients. (1998) Anesth Analg 86(3): 477-481.
Pubmed || Crossref || Others - 8. Vigue, B., Probst, D., Minoz, O., et al. Hemodynamic effects of the induction of general anesthesia after low thoracic epidural anesthesia. (1991) Ann Fr Anesth Reanim 10(3): 225-229.
Pubmed || Crossref || Others - 9. Underwood, P., Askari, R., Hurwitz, S. Response to comment on Underwood et al. Preoperative A1C and clinical outcomes in patients with diabetes undergoing major noncardiac surgical procedures. (2014) Diabetes Care 37(8): 611-616.
Pubmed || Crossref || Others - 10. Yuan Yan et al
Pubmed || Crossref || Others - 11. Cantu-Brito, C., Mimenza-Alvarado, A., Sanchez-Hernandez, J.J. Diabetes mellitus and aging as a risk factor for cerebral vascular disease: epidemiology, pathophysiology and prevention. (2010) Rev Invest Clin 62(4): 333-342.
Pubmed || Crossref || Others - 12. Ehara, N., Morimoto, T., Furukawa, Y., et al. Effect of baseline glycemic level on long-term cardiovascular outcomes after coronary revascularization therapy in patients with type 2 diabetes mellitus treated with hypoglycemic agents. (2010) Am J Cardiol 105(7): 960-966.
Pubmed || Crossref || Others - 13. Kuhl, J., Sartipy, U., Eliasson, B., et al. Relationship between preoperative hemoglobin A1c levels and long-term mortality after coronary artery bypass grafting in patients with type 2 diabetes mellitus. (2016) Int J Cardiol 202: 291-296.
Pubmed || Crossref || Others - 14. Gustavsson, C.G., Agardh, C.D. Markers of inflammation in patients with coronary artery disease are also associated with glycosylated haemoglobin Aic within the normal range. (2004) Eur Heart J 25(23): 2120-2124.
Pubmed || Crossref || Others - 15. Khaw, K.T., Wareha, N., Luben, R., et al. Glyeated haemoglobin, diabetes, and mortlity in men in Norfolk cohort of European prospective investigation of cancer and nutrition. (2001) BMJ 322(7277): 15-18.
Pubmed || Crossref || Others - 16. Selvin, E., Marinopoulos, S., Berkenblit, G. Meta-analysis: Glycoylated hemoglobin and cardiovascular disease in diabetes mellitus. (2004) Ann Intern Med 141(6): 421-431.
Pubmed || Crossref || Others - 17. Demirtas, L., Degirmenci, H., Akbas, E.M., et al. Association of hematological indicies with diabetes, impaired glucose regulation and microvascular complications of diabetes. (2015) Int J Clin Exp Med 8(7): 11420-11427.
Pubmed || Crossref || Others - 18. Ewing, D.J., Campbell, I.W., Clarke, B.F. Heart rate changes in diabetes mellitus. (1981) Lancet 1(8213): 183-186.
Pubmed || Crossref || Others - 19. Keyl, C., Lemberger, P., Palitzsch, K.D., et al. Cardiovascular autonomic dysfunction and hemodynamic response to anesthetic induction in patients with coronary artery disease and diabetes mellitus. (1999) Anesth Analg 88(5): 985-991.
Pubmed || Crossref || Others - 20. Maeda, H., Sugiyama, S., Jinnouchi, H., et al. Advanced peripheral microvascular endothelial dysfunction and polyvascular disease in patients with high cardiovascular risk. (2015) J Cardiol 67(5): 455-462.
Pubmed || Crossref || Others - 21. Moitra, V.K., Greenberg, J., Arunajadai, S. The relationships between glycosylated hemoglobin and perioperative glucose control in patients with diabetes. (2010) Can J Anaesth 57(4): 322-329.
Pubmed || Crossref || Others - 22. O'Sullivan, C.J., Hynes, N., Mahendran, B., et al. Haemoglobin A1c (HbA1C) in non-diabetic and diabetic vascular patients. Is HbA1C an independent risk factor and predictor of adverse outcome. (2006) Eur J Vasc Endovasc Surg 32(2): 188-197.
Pubmed || Crossref || Others - 23. Yi-Feng, M. Relationship between blood flow velocity changes of central retinal artery and HbA1c levels in patients with diabetes mellitus. (2001) Journal of Modern Practical Medicine13: 330-332.
Pubmed || Crossref || Others - 24. Sato, H., Carvalho, G., Sato, T. The association of preoperative glycemic control, intraoperative insulin sensitivity, and outcomes after cardiac surgery. (2010) J Clin Endocrinol Metab 95(9): 4338-4434.
Pubmed || Crossref || Others - 25. Colayco, D.C., Niu. F., McCombs, J.S., et al. Glycosylated hemoglobin and cardiovascular outcomes in type 2 diabetes A Nested Case-Control Study. (2011) Diabetes Care 34: 77-83.
Pubmed || Crossref || Others


