
Comparison of Dehydroepiandrosterone Sulfate to Free Testosterone and Luteinizing Hormone to Follicular Stimulating Hormone Ratios in Polycystic Ovarian Syndrome Women
Manju Bala1, Menaka.K2*, Anjali Gupta3, Meenakshi2
Affiliation
- 1Professor, Department of Biochemistry
- 2PG Students, Department of Biochemistry
- 3Professor, Department of Obstetrics and Gynaecology, Pt. B. D., Sharma PGIMS, Rohtak, Haryana, India - 124001
Corresponding Author
Menaka. K, PG Student, Department of Biochemistry, Plot No. 9, Kamarajan Street, Pappanchavady, Odiumpattu Post, Puducherry 605110, India, Tel: 8059344030; E-mail: kmenaka64@gmail.com
Citation
Menaka. K., et al. Comparison of Dehydroepiandrosterone Sulfate to Free Testosterone (DHEAS/FT) & Luteinizing Hormone to Follicular Stimulating Hormone (LH/FSH) Ratios in Polycystic Ovarian Syndrome Women. (2017) J Gynecol Neonatal Biol 3(1): 32-36.
Copy rights
© 2017 Menaka. K. This is an Open access article distributed under the terms of Creative Commons Attribution 4.0 International License.
Keywords
DHEAS/FT; LH/FSH; PolycysticOvarian Syndrome
Abstract
Objective: To compare Dehydroepiandrosterone Sulfate to Free Testosterone (DHEAS/FT) and Luteinizing Hormone to Follicular Stimulating Hormone (LH/FSH) ratios in Polycystic Ovarian Syndrome (PCOS) women.
Material and Methods: The present study was done in the Department of Biochemistry in collaboration with Department of Obstetrics and Gynaecology in which 30 PCOS cases and 30 ages matched healthy controls were enrolled. Fasting venous blood samples were collected from cases and controls for routine biochemical and hormone analysis after obtaining written consent & complete history.
Results: We found that free testosterone of cases (10.3 ± 17.1 pg/dL) showed significantly higher values than controls (1.84 ± 1.4 pg/dL) with p = 0.011 and had significantly positive correlation with Body Mass Index (BMI) with p = 0.014. DHEAS and FSH of cases had no significant raised value than controls (p > 0.05). LH of cases (12.7 ± 8.9 mIU/mL) had significantly higher than controls (7.02 ± 6.2 mIU/mL) with p = 0.006. DHEAS/FT of cases (0.815 ± 0.95) showed significantly lower than controls (1.922 ± 1.53) with p = 0.001. LH/FSH ratio (2.25 ± 2.3) of cases was significantly higher than controls (1.01 ± 0.72) with p = 0.008. LH/FSH ratio had 30% sensitivity and 93% specificity, but DHEAS/FT ratio had 16.7% sensitivity and 100% specificity for PCOS.
Conclusion: In conclusion, DHEAS/FT ratio can be considered as a specific marker than LH/FSH ratio and LH/FSH ratio as a better sensitive marker than DHEAS/FT ratio in PCOS women.
Introduction
Polycystic Ovary Syndrome (PCOS) is a multisystem endocrinopathy in reproductive women with clinical features such as obesity, menstrual abnormalities and hyperandrogenism leading to various metabolic disturbances with current incidence of PCOS (5 - 6%) in women[1]. The pathophysiologic defect is not clearly known exactly in PCOS. But this disorder tends to cluster in families, a genetic cause is likely[2]. In PCOS, due to various causes, the pulsatile GnRH secretion gets disturbed which leads to inadequate Follicle Stimulating Hormone (FSH) which can cause anovulation and high LH level which stimulates the ovarian theca cells to produce more androgens. There by, LH/FSH ratio is high in PCOS women. Persistently low FSH secretion leads to inadequate stimulation of numerous follicles in both ovaries and accounts for increased estrogen levels. There is also defective estrogen clearance and metabolism in PCOS women. There is an increased aromatisation of androgens to estrogens in adipose tissue. This increased estrogen concentration can cause an inhibition of FSH secretion and increased LH secretion rather than LH surge. Ultimately the ovaries fail to ovulate because of inadequately stimulated immature follicles and absence of LH surge[3].
The androgens are produced by the adrenal glands and the ovaries. Dehydroepiandrosterone Sulfate (DHEAS) is specific for adrenal androgen. In PCOS, the androgens are secreted primarily by the ovaries than the adrenals[3]. The PCOS women who have raised both adrenal and ovarian androgens have less chance of having metabolic disturbances than PCOS women who have only raised ovarian androgens[4].
Materials and Methods
The present study was conducted in the Department of Biochemistry in collaboration with the Department of Obstetrics and Gynaecology, Pt. B.D. Sharma PGIMS, Rohtak.
Thirty newly diagnosed cases of PCOS and thirty healthy age matched women as controls were enrolled in this study. Formula used to calculate sample size (n)[5]:
n = (r + 1) (SD2) ( Zβ + Zα/2)²
-------------------------------------
r d2
r = ratio of control to cases
SD = Standard Deviation calculated from the previous studies
= (SDcases + SDcontrols)/ 2
d = difference in mean between cases and controls
Zβ = desired power (typically 0.84)
Zα/2 = level of statistical significance (typically 1.96)
Inclusion criteria
Females who were diagnosed as PCOS (as per Rotterdam definition: existence of any two of the following: 1) Oligo-ovulation or anovulation, 2) Clinical or biochemical signs of hyperandrogenism and 3) Polycystic ovaries by Ultrasonography2) in Gynaecology outpatient department.
Exclusion criteria
Other potential causes of hyperandrogenism /oligo / amenorrhea such as congenital adrenal hyperplasia, androgen secreting tumor, hypothyroidism, Cushing’s syndrome, hyperprolactinemia, other pituitary / adrenal disorders, other insulin resistance conditions (acromegaly), drug intake and pregnancy.
Methodology
After getting written consent and detailed history, the cases and controls were subjected for physical examination, anthropometric measurements (as per protocol). Urine pregnancy test was done to rule out pregnancy. Ultrasonogram abdomen and pelvis findings were noted.
Sample Collection And Processing
Six ml of venous fasting blood sample was taken from the antecubital vein aseptically in which four ml of blood was collected in plain red vacutainer (plastic red capped tubes) for routine and hormone analysis and remaining two ml was collected in sodium fluoride vacutainer (plastic grey capped tubes) for fasting blood glucose estimation. Sera were separated by centrifugation at 2000 rpm for 5 minutes after clotting and subjected to routine biochemical analytes and hormonal estimation.
Routine Biochemical Investigations
The assays were performed on the RANDOX (Randox Laboratories Limited, UK) using standard kit reference methods. Total testosterone, LH & FSH were estimated on the Advia Centaur’CP immunoassay system by chemiluminescence method[6,7]. TSH was quantitated by immunoradiometric assay by IRMA kit (IRMAK – 9)[8]. DHEAS & FT levels were estimated by enzyme linked immunosorbent assay by using DBC quantitative ELISA kits[9,10].
Statistical Analysis
All the analyses were performed by using the statistical package (IBM SPSS). Unpaired ‘t’ test applied to calculate significance value between the variables of PCOS cases and controls. The correlation between variables was tested using the two-tailed Pearson correlation test. Data were considered to be significant if p < 0.05 and highly significant with p < 0.001.
Results
From this case control study, we found that the teenaged PCOS girls were in higher proportion in our study. We noted that the Waist Circumference (WC) and Hip Circumference (HC) of PCOS cases were significantly higher than healthy controls with p = 0.001 & 0.019 respectively. (Chart I and Table I)
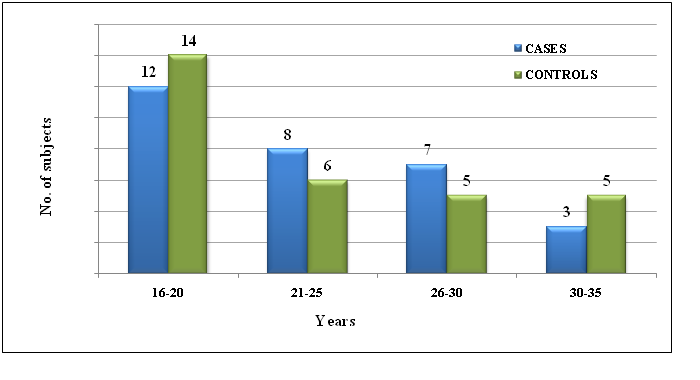
Chart I: The age distribution of the cases and controls (in years).
Table I: Clinical parameters of the cases and controls.
| S.No. | PARAMETERS | MEAN | ‘t’ value | p value | |
|---|---|---|---|---|---|
| CASES (n = 30) | CONTROLS (n = 30) | ||||
| 1. | Age | 23.26 ± 5.65 | 23.6 ± 6.45 | -0.213 | 0.832 |
| 2 | BMI | 26.09 ± 4.2 | 22.9 ± 3.3 | 3.245 | 0.002* |
| 3 | WC | 78.08 ± 9.8 | 70.06 ± 8.5 | 3.360 | 0.001** |
| 4 | HC | 97.41 ± 9.4 | 92 ± 7.8 | 2.416 | 0.019* |
| 5 | WC / HC | 0.799 ± 0.56 | 0.762 ± 0.9 | 1.940 | 0.057 |
BMI - Body mass index is calculated by formula [weight(kg) / height(m)²] (kg/m²), WC - Waist Circumference (in cm), HC - Hip Circumference (in cm), * - significant difference, ** - highly significant difference.
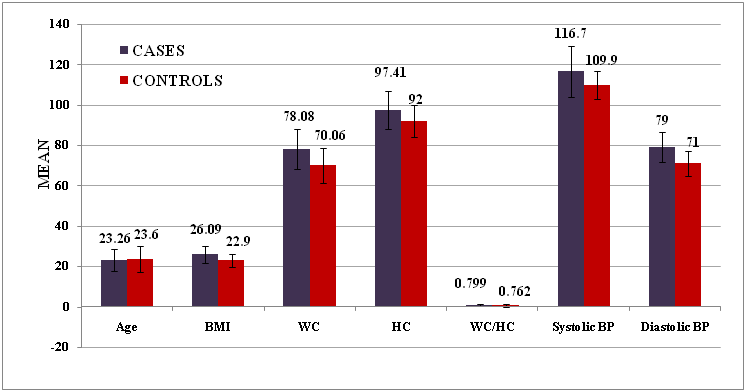
Chart II: Comparison of the mean values of age, BMI, WC & HC of the cases and controls.
The mean value of cases and controls for the following parameters.
Table II: Routine metabolic parameters of the cases and controls.
| S.No. | PARAMETERS | MEAN | ‘t’ value | p value | |
|---|---|---|---|---|---|
| CASES (n = 30) | CONTROLS (n = 30) | ||||
| 1 | FBS | 89.23 ± 13.92 | 88.47 ± 7.66 | 0.264 | 0.792 |
| 2 | TGL | 134.53 ± 58.15 | 106.8 ± 36.31 | 2.216 | 0.031* |
| 3 | T-C | 180.6 ± 35.1 | 174.2 ± 31.82 | 0.740 | 0.462 |
| 4 | HDL-C | 46.17 ± 9.6 | 44.87 ± 6.4 | 0.615 | 0.541 |
| 5 | LDL- C | 106 ± 27.8 | 109.47 ± 25.7 | -0.501 | 0.619 |
| 6 | VLDL-C | 27.67 ± 11.6 | 20.20 ± 8.0 | 2.881 | 0.006* |
FBS- Fasting Blood Sugar (mg/dL), TGL- Triglycerides (mg/dL), T-C- Total Cholesterol (mg/dL), HDL-C- High Density Lipoprotein Cholesterol (mg/dL), LDLC- Low Density Lipoprotein Cholesterol (mg/dL) & VLDL-C- Very Low Density Lipoprotein Cholesterol (mg/dL). * - significant difference, **- highly significant difference.
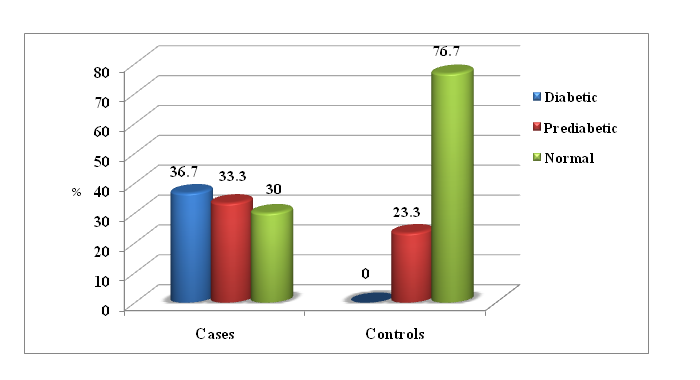
Chart III: Comparison of the mean values of FBS, lipid profile of the cases & controls.
Table III: Hormonal parameters of the cases and controls.
| S.No. | PARAMETERS | MEAN | ‘t’ value | p value | |
|---|---|---|---|---|---|
| CASES (n = 30) | CONTROLS (n = 30) | ||||
| 1 | FSH | 6.79 ± 2.9 | 11.31 ± 26.1 | -0.942 | 0.350 |
| 2 | LH | 12.72 ± 8.99 | 7.02 ± 6.2 | 2.828 | 0.006* |
| 3 | LH / FSH ratio | 2.25 ± 2.3 | 1.01 ± 0.72 | 2.751 | 0.008* |
| 4 | T.Testo | 47.85 ± 23.55 | 22.5 ± 11.93 | 5.256 | 0.000** |
| 5 | FT | 10.298 ± 17.08 | 1.842 ± 1.39 | 2.702 | 0.011* |
| 6 | DHEAS | 2.272 ± 1.4 | 2.074 ± 0.58 | 0.716 | 0.477 |
| 7 | DHEAS / FT ratio | 0.815 ± 0.95 | 1.922 ± 1.53 | -3.347 | 0.001** |
| 8 | TSH | 2.2 ± 0.9 | 2.35 ± 0.7 | -0.657 | 0.514 |
FSH – Follicular Stimulating Hormone (2.5-10.2 mIU/mL), LH - Luteinizing Hormone (1.9 -12.5 mIU/mL), T.Testo- Total Testosterone (14- 76 ng/mL), FT- Free Testosterone (0.01-7.01pg/dL), DHEAS- dehydroepiandrosterone sulfate (0.46-2.75μg/mL) & TSH- Thyroid Stimulating Hormone (mIU/mL) * - significant difference, ** - highly significant difference
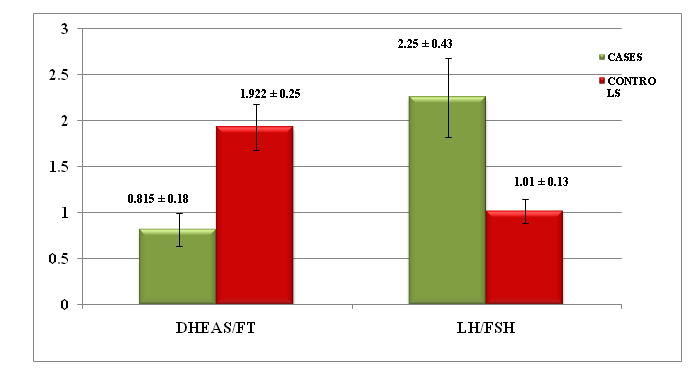
Chart IV: The comparison of the mean value ± SE of DHEAS/FT & LH/FSH ratios of the cases and controls.
23% of PCOS cases (89.2 ± 13.9 mg/dL) and 6.5% of control group (88.5 ± 2.7 mg/dL) had fasting blood glucose ≥ 100 mg/dL with no significant difference (p > 0.05). We noted that triglycerides and VLDL cholesterol were significantly higher in PCOS women than in controls with p = 0.031 & 0.006 respectively.
Total testosterone, FT & LH were in significantly higher levels than in controls with p = 0.000, 0.011 & 0.006 respectively. 50% of cases showed raised FT levels than controls (0%). Among cases, 30% had raised LH and 3.3% had raised FSH than controls (3%).
DHEAS, FSH of PCOS women did not show any significant difference when compared to healthy controls (p > 0.05). DHEAS/FT ratio was within the reference range (0.14 - .89)[4]. In 53.3%, decreased in 20% and increased in 26.6% of cases. 53.3% had increased and 46.7% had normal range of this ratio among controls. We noted that DHEAS/FT and LH/FSH ratios of cases had significantly higher values than the controls with p = 0.001 & 0.008 respectively.
BMI had positive correlation with total testosterone (r = 0.290 & p = 0.025), free testosterone (r = 0.316 & p = 0.014). We found that LH/FSH and DHEAS/FT ratios were not significantly correlated (r = -0.221 & p = 0.090). DHEAS/FT ratio had negative correlation with total testosterone with r = -0.266 & p = 0.040.
We estimated that LH/FSH ratio had 30% sensitivity and 93% specificity, but DHEAS/FT ratio had 16.7% sensitivity and 100% specificity for PCOS. (Chart V)
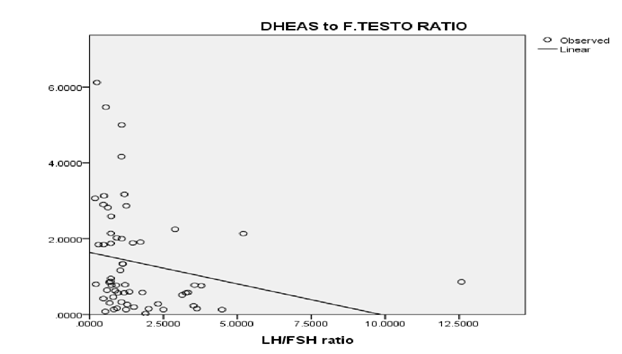
Chart V: Comparison of the mean values of DHEAS, WC/HC, LH/FSH & DHEAS/FT ratios of the cases & controls. Regression analysis of DHEAS/FT & LH/FSH ratios.
Discussion
Polycystic Ovary Syndrome (PCOS) is the most prevalent endocrinopathy in reproductive women with ovulatory dysfunction, hyperandrogenism and Insulin Resistance (IR) with high potential for diabetes mellitus (T2DM), obesity and cardiovascular disease and Metabolic Syndrome (MS). Increased circulating LH in PCOS women stimulates ovarian the cal cells to produce more androgens which lead to hyperandrogenemia in turn leads to increased male pattern (top/apple shaped upper abdomen) of fat accumulation both subcutaneously and around viscera which in turn leads to obesity, increased waist circumference, body mass index (BMI) and waist hip circumference ratio.11
Raised triglycerides and VLDL level in the circulation which can modulate plasma membrane composition resulting in decreased insulin sensitivity of insulin receptors by increased serine phosphorylation or decreased tyrosine acetylphosphorylation of insulin receptor. Triglycerides enter into cells and activate protein kinase C-ε and C-θ, ultimately reducing the glucose uptake and cause IR. In healthy women, 80% of testosterone is bound to Sex Hormone Binding Globulin (SHBG), 19% is bound to albumin, and 1% circulates freely in the blood stream. But in PCOS women the concentration of SHBG decreased resulting in increased unbound fraction of testosterone. The FT is biologically active androgen and responsible for yperandrogenemia signs in PCOS. Thus FT can be considered as one of the highly sensitive and specific endocrine biomarkers for PCOS[11].
In our study, FT in PCOS cases was found to be significantly higher than the controls (p = 0.011). 50% of cases showed raised FT and 13% of cases had increased total testosterone levels than controls (0%) which were consistent with studies by Barbieri., et al[12] and Kumar., et al[13].
Wehr., et al stated that serum testosterone levels were positively related with fat mass, not with abdominal adiposity. They suggested that testosterone is a predictor of overall adiposity[14]. We noted that BMI had positive correlation with total testosterone (r = 0.290 & p = 0.025), free testosterone (r = 0.316 & p = 0.014) as BMI is a predictor of overall adiposity.
In our study, DHEAS level of PCOS women did not show any significant difference when compared to healthy controls which was consistent with Barbieri., et al[12] and Robinson., et al[15] studies in which they noted no significant difference in DHEAS between the cases and controls. Our results were also showed DHEAS had negative correlation with BMI (r = -0.065) as BMI correlates with adiposity in the body which were in line with the results of studies by Swellam., et al and others[14,16].
DHEAS has opposing effect of FT against IR, obesity and other metabolic changes. PCOS women who have raised both adrenal and ovarian androgens have less chance of having metabolic disturbances than PCOS women who have only raised ovarian androgens. This shows that DHEAS has beneficial effect against IR and glucose metabolism.4
LH/FSH ratio of cases was significantly higher than the controls (cut off ≥ 2.5) with p = 0.008. Our results were consistent with result by Dipankar., et al[17] who reported increased LH/FSH ratio. Robinson., et al concluded that using LH/FSH ratio as a biochemical criterion for diagnosis of PCOS should be abandoned because of its low sensitivity[15].
We noticed that DHEAS/FT ratio had significant negative correlation with waist circumference (r = -0.366 & p = 0.004) and W/H ratio (r = -0.264 & p = 0.041) and total testosterone (r = -0.266 & p = 0.040). Thus raised DHEAS/FT has protective role against metabolic alterations in PCOS. Our results had lower DHEAS/FT ratio in cases but not in controls. LH/FSH ratio had positive significant correlation with W/H ratio (r = 0.309 & p = 0.016) and no correlation with waist circumference and total testosterone. We could not find that both ratios were not correlated with lipid profile and BMI.
Conclusion
In conclusion, DHEAS/FT ratio can be considered as a specific marker than LH/FSH ratio and LH/FSH ratio as a better sensitive marker than DHEAS/FT ratio in PCOS women.
References
- 1. Padubidri, V.G., Daftary, S.N. Howkins & Bourne Shaw’s Textbook of Gynaecology. 15th edition. Disorders of the ovary and benign tumours. (2011) Elsevier Pg No: 369-371.
Pubmed || Crossref || Others - 2. Marjan Attaran. Polycystic ovary syndrome [internet].(2010) Disease management project clinical decisions.
Pubmed || Crossref || Others - 3. Clinical management guidelines for Obstetrician - Gynaecologists. ACOG Practice Bulletin No. 108: Polycystic ovary syndrome. (2009) Obstet Gynecol 114(4): 936-946.
Pubmed || Crossref || Others - 4. Lerchbaum, E., Schwetz, V., Giuliani, A., et al. Opposing effects of dehydroepiandrosterone sulfate and free testosterone on metabolic phenotype in women with polycystic ovary syndrome. (2012) Fertil Steril 98(5): 1318-1325.
Pubmed || Crossref || Others - 5. Ravi, B.V., Gokaldas, S.R., Savithri, D.R. Assessment of prolactin and insulin resistance in women with polycystic ovarian syndrome. (2014) IJBAR 5(11): 556-558.
Pubmed || Crossref || Others - 6. Iamail, A.A., Cawood, A.M., Short, F., et al. Testosterone assay: Guideline for the provision of a clinical biochemistry service. (1986) Ann Clin Biochem 23(Pt 2): 135-145.
Pubmed || Crossref || Others - 7. Fanchin, R., SchonaÈuer, L.M., Righini, C., et al. Serum anti-MuÈllerian hormone is more strongly related to ovarian follicular status than serum inhibin B, estradiol, FSH and LH on day 3. (2003) Hum Reprod 18(2): 323-327.
Pubmed || Crossref || Others - 8. Kazerouni, F., Amirrasouli, H. Performance characteristics of three automated immunoassays for thyroid hormones. (2012) Caspian J Intern Med 3(2): 400-404.
Pubmed || Crossref || Others - 9. Garde, A.H., Hanse, A.M., Skovgaard, L.T., et al. Seasonal and Biological Variation of Blood Concentrations of Total Cholesterol, Dehydroepiandrosterone Sulfate, Hemoglobin A1c, IgA, Prolactin, and Free Testosterone in Healthy Women. (2000) Clin Chem 46(4): 551-559.
Pubmed || Crossref || Others - 10. Winter, S.J., Kelley, D.E., Goodpaster, B. The Analog free testosterone assay: Are the results in men clinically useful. (1998) Clin Chem 44(10): 2178-2182.
Pubmed || Crossref || Others - 11. Grasmo, I. Estrone, free testosterone levels accurate biomarkers for PCOS [Advance online publication]. (2010).
Pubmed || Crossref || Others - 12. Barbieri RL. Steroid hormone metabolism in polycystic ovary syndrome. (2012) UpToDate.
Pubmed || Crossref || Others - 13. Kumar, A., Woods, K.S., Bartolucci, A.A., et al. Prevalence of adrenal androgen excess in patients with the polycystic ovary syndrome (PCOS). (2005) Clinical Endocrinology 62(6): 644-649.
Pubmed || Crossref || Others - 14. Wehr, E., Moller, R., Horejsi, R., et al. Subcutaneous adipose tissue topography and metabolic disturbances in polycystic ovary syndrome. (2009) Wien Klin Wochenschr 121(7-8): 262-269.
Pubmed || Crossref || Others - 15. Robinson, S., Rodin, D.A., Deacon, A., et al. Which hormone tests for the diagnosis of polycystic ovary syndrome? (1992) Br J Obstet Gynaecol 99(3): 232-238.
Pubmed || Crossref || Others - 16. Swellam, M., Khaial, A., Mosa, T., et al. Anti-mullerian and androgens hormones in women with polycystic ovary syndrome undergoing IVF/ICSI. (2013) Iran J Reprod Med 11(11): 883-890.
Pubmed || Crossref || Others - 17. Dipankar, B., Kumar, M.S., Satinath, M., et al. Clinical correlation with biochemical status in polycystic ovarian syndrome. (2005) J Obstet Gynecol India 55(1): 67-71.
Pubmed || Crossref || Others


