
Comparison of the Efficiency of Different Extraction Methods on Antioxidants of Maltease Orange Peel
M’hiri N1,2, Ioannou I2, Paris C2, Ghoul M2 and Mihoubi Boudhrioua N1*
Affiliation
- 1UR11ES44, Ecophysiology and Agri Processes, Higher Institute of Biotechnology of Sidi Thabet, University of Manouba, BP-66, 2020 Ariana-Tunis,Tunisie
- 2Lorraine University, ENSAIA- Biomolecular Engineering Laboratory (LIBio), 2 avenue de la Forêt de Haye, TSA 40602 Vandoeu vre Cedex 54518, France
Corresponding Author
Nourhene Boudhrioua, UR11ES44, Ecophysiology and Agri Processes, Higher Institute of Biotechnology of Sidi Thabet, University of Manouba, BP-66, 2020 Ariana-Tunis, Tunisie, Tel: +216-71-537040; E-mail: nourhene.boudhrioua@gmail.com
Citation
Boudhrioua, M.N., et al. Comparison of the Efficiency of Different Extraction Methods on Antioxidants of Maltease Orange Peel. (2016) Int J Food Nutr Sci 3(1): 239-251.
Copy rights
© 2016 Boudhrioua, M.N. This is an Open access article distributed under the terms of Creative Commons Attribution 4.0 International License.
Keywords
Orange peel; Phenolic compounds; Vitamine C; Extraction methods; Antioxidant activity
Abstract
The effect of conventional solvent extraction, CSE, ultrasound assisted extraction, UAE, microwave assisted extraction, MAE and supercritical CO2 extraction, SC-CO2 on the total phenols content, total flavonoids, individual flavonoids and antioxidant activity of orange peel were compared. Neohesperidin (from 0.624 ± 0.013 for SC-CO2 extraction to 1.045 ± 0.001 g100 g orange peel powder for MAE) and hesperidin (from 0.407 ± 0.008 for SC-CO2 extraction to 0.836 ± 0.029 g/100 g orange peel powder for UAE) are the major flavonoids (80% of total flavonoids by MAE and 87% by CSE) of orange peel whatever the used extraction method. The method giving the highest total phenol and flavonoid contents is microwave assisted extraction (2.363 ± 0.014 g GAE/100g orange peel powder), followed by ultrasound assisted extraction, conventional solvent extraction, and supercritical CO2 extraction. However, antioxidant activity (DPPH method) cannot be correlated to TPC, TFC or individual flavonoids. Orange peel extracted by CSE (ethanol (80%), m/v: 5 g: 50 ml, 30 min, 35°C, mechanical stirring at darkness, 3 successive extractions) presents the higher radical scavenging capacity compared to the other extracts obtained by MAE (Ethanol (80%), m/v: 5 g: 50 ml, 10s, 35°C, 170 W, 3 successive extractions) and UAE (ethanol (80%), m/v: 5g: 50 ml, 30 min, 35°C, magnetic stirring at darkness, 3 successive extractions, 125 W), SC-CO2 extraction (ethanol (80%), m/v:5 g: 50 ml, 30 min, 35°C, 22 MPa, 3 successive extractions). Besides, no additivity on the antioxidant activity is found with the DPPH method.
Introduction
Citrus is the most important fruit crop in the world with a production estimated at 89 million tons in 2014[1]. Approximately 26% of Citrus fruits are industrially processed into juice. The amount of industrial Citrus waste is estimated at more than 15×106 tons[2] and it consists essentially in seeds, peels and pulp residue[3]. Numerous potential of Citrus peel valorisation are recently reported in literature. Citrus peel can be used in functional foods and even as a dietary supplement for human or animal feed[4]. Citrus peel is also used in biochemical engineering such as the production of biodegradable plastics by the copolymerization of limonene extracted from Citrus peel and carbon dioxide[5], but also to produce bio fuels (ethanol) and biogas[6]. Pectin can be extracted from Citrus peel to use it in food industries through its thickening, texturizing, a gelling agent (making jams, jellies, fruit preparations, frozen creams and emulsified products[7], but also in pharmaceutical industry as an ingredient for preparation of anti-diarrheal and detoxifying drugs[8,9]. Extraction of essential oils remains, actually, the main industrial valorisation of Citrus peel[10,11]. Moreover, citrus peel represents a rich source of natural phenolic compounds unique to Citrus. Total phenol contents of the peel varied from 0.67 to 7.30 g/100g dry weight[12]. Phenolic compounds of citrus peel exhibit anti-carcinogenic, anti-inflammatory, antioxidant and anti-atherogenic properties[13] due to the presence of phenolic acids and flavonoids[3]. Antioxidants capacity of phenols could have promoting application in chemical engineering such as corrosion inhibitor in shipbuilding materials, in crude oil refining industry, in the acid pickling, industrial cleaning, descaling acid, and also in the petrochemical processes[14]. However, its extraction constitutes a difficult step because of their sensitivity to extraction conditions such a temperature, light or food matrix, which could lead to their degradation and alteration of their antioxidant activities[15].
There are several methods of extraction of phenolic compounds in citrus peel as conventional solvent extraction[16-18]. These methods can cause degradation of phenolic compounds due to the high temperature and the extraction time. Some other methods were used to increase the efficiency of the extraction such as microwave assisted extraction, ultrasound assisted extraction, high pressure extraction and supercritical fluid extraction or subcritical water[19,20]. Some authors suggest a sequential use of two processes such as instant controlled pressure drop technology and ultrasound-assisted extraction (DIC-UAE) or combined approaches like enzyme assisted extraction in order to intensify the extraction operation and to enhance the extraction kinetic and yield[12]. Boukroufa et al.[21] combine ultrasound and microwave techniques to extract phenolics from orange peel waste, using only recycled water as solvent. This concept allowed also the recuperation of essential oils and pectin. Some comparisons of the efficiency of different extraction methods were carried out in the literature but they are incomplete because only two or three methods were compared in the same workj[22-24] and of extraction and preservation of phenolics activities should help to choose the appropriate extraction method.
So, the purpose of this paper is to compare the performances of Conventional Solvent Extraction (CSE), Ultrasound Assisted Extraction (UAE), Microwave Assisted Extraction (MAE), High Pressure Extraction (HPE), and Supercritical CO2 extraction (SC-CO2) on the selectivity, the total phenol content, the total and individual flavonoids and the antioxidant activity of Maltese orange peel. To reach this goal, High Performance Liquid Chromatography (HPLC), Mass Spectrometry (MS), spectrophotometer and DDPH methods were used to evaluate the criteria of the performance of these extraction methods.
Materials and Methods
Plant Material and Sample Preparation
About 20 kg of fresh oranges (Citrus sinensis) of the Maltese cultivar were collected in March 2012 from Manzel Bouzelfa (Nabeul, Tunisia) in their commercial maturity. All fruits were of eating quality and without blemishes or damage. On arrival at the laboratory, the orange fruits were immediately washed using tap water and peeled. The remaining orange peel accounts for approximately 40% of the total fruit.
The peels were stored at -80°C before any further treatments. They were then dehydrated by using a freeze dryer (CHRIST Alpha 1-2 LD, France) for 72h (at -50°C and 0.001 mbar) and then finely ground using a coffee grinder (Moulinex®, France) and sieving to achieve a standard size of particles of ~0.315 mm. The orange peel powder was placed in vacuum packaging bags and stored in a freezer maintained at -18°C before the experiments.
Chemicals and Reagents
All chemicals used in the experiments carried out during this work are shown in Table 1. All chemicals were of analytical or HPLC grade purity
Table 1: Chemicals and reagents used in experiments.
| Product | Provider | Purity (%) |
|---|---|---|
| Phenolics standards: eriocitrin, narirutin, naringin, hesperidin, neohesperidin, didymin, sinensetin, tangeretin, nobiletin et 3’,4’, 5,5’6,7, hexamethoxyflavone | Extrasynthese®(Lyon, France) | ≥ 95 - 99.0 |
| Potassium persulfate | Fluka (Switzerland) | |
| Rutin | Sigma-Aldrich (Allemagne) | ≥ 94,0 |
| Sodium nitrite (NaNO2) | ≥ 97 | |
| Aluminium chloride (AlCl3) | 99,99 | |
| 2,2-diphenyl-1-picrylhydrazyl (DPPH) | - | |
| 6-hydroxy-2,5,7,8-tetramethylchroman-2-carboxylic acid (Trolox) | ≥ 97,0 | |
| Folin-Ciocalteu’s phenol reagent | - | |
| Sodium Carbonate (Na2CO3) | - | |
| gallic acid monohydrate | ≥ 98,0 | |
| Ascorbic acid | ≥ 99,0 | |
| Acide chlorhydrique | - | |
| Sodium Hydroxide (NaOH) | Carlo Erba-SDS, (France) | - |
| Methanol | - | |
| Ethanol | VWR (Belgique) | ≥ 95,0 |
| Acetic acid | ≥ 99,7 |
Extraction Methods
For all extraction methods, the temperature was set at 35°C to prevent thermal degradation of antioxidant molecules. The parameters of extraction methods were summarized in Table 2.
Table 2: Extraction conditions of CSE, UAE, MAE and SC-CO2 methods.
| Extraction method | Conditions of extraction | Characteristics |
|---|---|---|
| CSE | Ethanol (80%), m/v: 5g: 50 ml, 30 min, 35°C, mechanical stirring at darkness, 3 successive extractions. | - |
| UAE | Ethanol (80%), m/v: 5g: 50 ml, 30 min, 35°C, magnetic stirring at darkness, 3 successive extractions, 125 W. | Ultrasound sonicator (VibraCell 75115, Bioblock-Fisher, Illkirch, France) |
| MAE | Ethanol (80%), m/v: 5g: 50 ml, 10 s, 35°C, 170 W, 3 successive extractions. | Microwave oven (WAVEDOM LG, France) |
| SC-CO2 | Ethanol (80%), m/v: 5g:50 ml, 30 min, 35°C, 22 MPa, 3 successive extractions. | Pilot scale extractor (ENSIC, LRGP, Nancy, France) |
The crude extract provided by each technique was cooled at room temperature, centrifuged at 8000 g for 10 min and the supernatant was filtered through a Millipore paper (0.22 μm). The residue was further extracted two times with 50 ml of the same solvent under the same extraction conditions. A combination of the three extracts was collected and stored at 4°C.
Analytical Methods
Determination of Total Phenols and Flavonoids Contents (TFCSP, TPCFC)
Total phenols content was determined by Folin-Ciocalteu meth od, according to the method described by Singleton et al.[25]. The samples were added to Folin-Ciocalteu reagent and Na2CO3 solution and placed in a water bath at 40°C for 30 min. Spectrophotometric analysis (spectrophotometer Genesys 10 uv screening, Thermo Electron Corporation, France) was carried out at 765 nm. Total phenol content determined by Folin-Ciocalteu method was designed as TPCFC and was expressed as g of gallic acid equivalent (GAE) per 100 g orange peel powder. Total flavonoids content was determined by spectrophotometeric method, according to the modified procedure of Zhishen et al.[26]. 0.5 ml of aqueous extract was placed in a 5 ml volumetric flask, and then 2.5 ml of distilled water were added, followed by 0.15 ml of 5% NaNO2.
After 5 min, 0.15 ml of 10% AlCl3 were added. 5 min later, 1 ml of 1M NaOH were added and the volume made up with distilled water. The solution was mixed and absorbance was measured at 510 nm using a spectrophotometer (Genesys 10 uv screening, Thermo Electron Corporation, France). Total flavonoids content measured by spectrophotometeric method was designed as TFCSP and was expressed as rutin equivalent per 100 g orange peel powder.
Determination of Vitamin C Content
Vitamin C content was titrated by a modified method described by Tabart et al.[27] using dichlorophenolindophenol 2,6 (DCPIP). 2 ml of orange peel extract was added to 23 ml of metaphosphoric acid solution (HPO3) 5%. 5 ml was taken to which was added 5 ml of a solution of trichloroacetic acid in 20% HPO3. The solution obtained is then filtered and 2 ml of the filtrate was mixed with 5 ml of a buffer solution at pH 7.1 and 1 ml of 2,6 dichloro phenol indophenol (DCPIP). The absorbance was measured at 530 nm. A standard range was performed using ascorbic acid at concentrations of 0, 5, 10, 15, 20 mg/l (R2 = 0.9995). The vitamin C content is expressed in g per 100 g of orange peel powder.
Determination of antioxidant activity
The determination of the antioxidant activity was realized on the five extracts obtained by the different extraction methods and the results were expressed as micromoles of Trolox equivalent for one micromole of phenolic compounds[28]. The free radical scavenging activities of orange peel extracts were determined by DPPH radical cation decolorization assay, following the method of Burda & Oleszerk[29]. A 46.7 mg/l of 1.1-diphenyl-2-picrylhydrazyl (DPPH) was prepared by dilution of 11.7 mg of DPPH with 250 ml of methanol incubated in dark. 80 μl of sample extract was added to 220 μl of DPPH solution. The absorbance reading was taken at 25°C, exactly 1 min after initial mixing (A0) and again at 30 min (At). The control solution was prepared by adding 80 μl of methanol to the DPPH solution and methanol was used as blank. The inhibition percentage of absorbance at 515 nm, using a spectro fluorometer (SAFAS flx Xenius, Monaco) was calculated between OD0 and ODt, according to the following equation 1. Appropriate solvent blanks were run in each assay.
(ODO - ODt)
Equation 1: Percentage of inhibition = ------------------ x 100
ODO
with OD0 as initial optical density and ODt as final optical density.
Then, Trolox equivalent antioxidant capacity (TEAC) was determined according equation 2.
aS
Equation 2: TEAC = ---
aT
aS: line slope for sample of percentage of inhibition (%) plotted vs. concentration (μM). aT: line slope for Trolox reference (6-hydroxy-2,5,7,8-tetramethylchroman-2-carboxylic acid) of percentage of inhibition (%) plotted vs. concentration (μM).
Additivity of antioxidant capacity
To check the additivity of the antioxidant activity, a mixture containing the ten flavonoids identified in orange peel was prepared. The values obtained were compared to that predicted from the values of each compound corrected by their molar fraction (equation 3).
10
Equation 3: TEAC predict = ∑ ΠMi x TEACi
i = 1
Mi: molar fraction of each phenolic compound i
TEACi: Antioxidant activity of each phenolic compound i
Analysis of flavonoids by HPLC
Identification of phenolic compounds in orange peel was carried out in two steps: identification by mass spectrometry and confirmation by HPLC analysis with the injection of standards.
Identification of phenolic compounds using HPLC-MS
Qualitative analysis of orange peel phenolic compounds was performed using a HPLC-MS system (Thermo Fisher Scientific, San Jose, CA, USA) equipped with an LTQ XL ion trap as mass analyzer (Linear Trap Quadripole). Chromatographic separation was performed on a C18 Alltima reverse phase column (150 × 2.1 mm, 5 μm porosity – Grace/Alltech, Darmstadt, Germany) equipped with a C18 Alltima pre-column (7.5 × 2.1 mm, 5 μm porosity- Grace/Alltech) at 25°C and mobile phases consisted of water modified with formic acid (0.1%) for A, and methanol modified with formic acid (0.1%) for B. Phenolics were eluted using a linear gradient from 10% to 100% of B in 78 min at a flow rate of 0.2 mL min-1. Photodiode array (PDA) and mass spectrometry (MS) detections were performed during the time of the run. The mass spectrometry operating parameters were set as follows: electro spray positive ionization mode (ESI+) was used; spray voltage was set at 5 kV; source gases were set (in arbitrary units min-1) for sheath gas, auxiliary gas and sweep gas at 40, 10 and 10, respectively; capillary temperature was set at 300°C; capillary voltage was set at 48 V; tube lens, split lens and front lens voltages were set at 138 V, -38 V and -4.25 V, respectively. The ion optic parameters were optimized by automatic tuning using a standard solution of rutin (M = 610 g.mol-1) at 0.1 g.L-1 infused in the mobile phase (A/B: 50/50) at a flow rate of 5 μL.min-1. Full scan MS spectra were acquired from 100 to 2000 m/z.
Analysis of flavonoids by HPLC
The quantitative analysis was performed by using an HPLC analytical system (Elite LaChrom, VWR-Hitachi, France) consisting of a Spectra System P4000 pump, a Spectra System UV 6000LP diode array detector, a Spectra System SCM 1000 degasser and a Spectra System AS3000 auto-sampler. Controlled by software (THERMO CHROMQUEST). After filtration on Millipore paper (0.22 μm), 20 μl of ethanolic extract was injected on reverse-phase C18 column (150 × 4.6 mm, 5 μm particle size, Apollo, Grace, Belgium). The mobile phase consisted of solvent A, water-acetic acid (2%) and solvent B, methanol-acetic acid (2%). A gradient program was carried: out as follows: 5 min, 10% B ; 78 min, 100% B ; 88 min, 100% B ; 90 min, 10% B ; 100 min, 10% B.
The flow rate was 1 ml/min, and the temperature of the column oven was 40°C. The UV spectra were recorded at 280 nm for the quantitative determination of flavanones and at 340 nm for flavones. The limits of detection of the HPLC used for the flavonoid analysis are 9000 u.a. for the detection at 290 nm and 50 u.a. for the detection at 340 nm. The limits of quantification were calculated according to each standard curve.
The standards eriocitrin, naringin, narirutin, neohesperidin, didymin, sinensetin, tangeretin, nobiletin and 3’, 4’, 5, 5’6, 7,-hexamethoxyflavone were prepared at a stock concentration of 250 mg/L. For hesperidin, the concentration was 20 mg/L because of its low solubility. Calibration standard samples were prepared by appropriate dilutions with a mixture of ethanol/DMSO from the stock solutions and filtered on Millipore paper (0.22 μm) before use. Calibration curves obtained showed determination coefficients superior to 0.98. Total flavonoids content determined by calculation of the sum of individual flavonoids measured by HPLC was designed as TFCHPLC and was expressed as g/100g of orange peel powder.
Statistical analysis
All experiments were repeated 3 times; average and standard deviations were calculated. Statistical analysis was carried out using the software package IBM. SPSS 20.0 and the comparison of averages of each treatment were based on the analysis of variance (ANOVA) at significance level 5%. Values followed by the same letter are not statistically significant according to Duncan’s multiple range test at significance level p < 0.05.
Principal component analysis (PCA) was performed on the correlation matrix of the measured parameters: TFHPLC, sum of glycosylated flavanones, sum GF (neohesperidin, hesperidin, narirutin, naringin, didymin, eriocitrin), sum of polymethoxylated flavones, sum MF (sinensetin, tangeretin, nobiletin, hexamethoxyflavone) and TEAC. A measure of association between each measurement and the obtained principal components was provided.
Results and Discussion
Effect of extraction methods on total phenols and flavonoids contents
As reported in Figure 1, the TPCFC obtained by CSE was 1,968 ± 0,003 g GAE/100 g of citrus peel powder. This value is higher than that reported by Kammoun et al.[30] for the same cultivar analyzed at its commercial ripening stage (1.130 ± 0.040 g). This difference is due to different used extraction conditions. In fact, Kammoun et al.[30] have applied a single extraction with filtration of the extract, evaporation of solvent and lyophilization of the residue. Whereas, in this study three successive extractions were applied and were followed by filtration of the extract without evaporation or lyophilization of the residue. The same solvent and plant material/solvent ratio were used in both studies.
If total phenol content was compared to that of other Citrus cultivars, significant variability could be noticed. In fact, the TPCFC of Maltease orange peel remains lower than that obtained by Ghanem et al.[31] for fresh thompson peel (1.899 ± 0.012 g caffeic acid/100 g dry matter), Chen et al.[32] (3.945 ± 0.100 g GAE/100g DW for Citrus Sinensis Osbeck peel and Ghasemi et al.[13] (16.03 g GAE/100g of citrus peel powder for Citrus Sinensis Washington Navel variety).
These differences can be attributed to many factors such as citrus cultivar and its stage of ripening, pedoclimatic factors (soil type, sun exposure, and rainfall), agronomic factors (biological culture, fruit yield per tree, and type of irrigation) and extraction methods used for phenolic analysis. The flavonoids content represents almost 50% of total phenolic of Maltese orange peel. This result is in accordance with results reported by Wang et al.[33]. Other studies mentioned that the total flavonoids content can varies in a wide range: from 1.4%[34] to 80%[35]. These variations can be explained by the interference of other compounds (sugars, organic acids like vitamin C) on the Folin-Ciocalteu analysis[36].
Figure 1 showed also that TPCFC (2.363 ± 0.014 g GAE/100 g) and TFCSP (1.265 ± 0.023 g rutin/100 g) provided by the MAE method were higher than those obtained by UAE followed by CSE, and SC-CO2 extraction method. Conventional solvent extraction gives low yields in comparison with UAE, and MAE. In fact, this method is accelerated by using ultrasound and microwave energy. The intensification of extraction efficacy using ultrasound has been attributed to the propagation of ultrasound pressure waves through the solvent and resulting cavitation phenomena[37]. A cavitation bubble can be generated close to the plant material surface, then during a compression cycle, this bubble collapses and a micro jet directed toward the plant matrix is created. The high pressure and temperature involved in this process will destroy the cell walls of the plant matrix and its content can be released into the medium. This phenomenon seems responsible for cell wall destruction and further release of the cellular content into the surrounding media[37,38].
However, microwave irradiation accelerates the rupture of cells by causing a sudden temperature rise and internal pressure increase in the plant or fruit cell walls[39]. During microwave processing, heating causes the disruption of weak hydrogen bonds caused by the dipole rotation of the molecules. A considerable amount of pressure builds up inside the biomaterial which modifies the physical properties of the biological tissues.
This modification improve the porosity of the biological matrix, allowing better penetration of extracting solvent through the matrix, and facilitating the collection of the phenolic compounds[40]. Besides, the increase of TPCFC in extract obtained by MAE can be explained by the breakdown of bigger phenolic compounds into smaller ones with their intact properties of the original molecules and which can react with Folin-Ciocalteu assay[41]. In our study, Figure 1 show that vitamin C contents measured in the different extracts remains constant whatever the used extraction method.
Figure 1 indicates also that supercritical CO2 extraction method gives the lowest TPCFC and TFCSP (1.204 ± 0.019 g GAE/100 g, 0.589 ± 0.036 g rutin/100 g respectively) compared to others methods. This result can be explained by the fact that orange peel is richer in polar flavonoids (flavanones) than non-polar ones (polymethoxylated flavones), while supercritical CO2 extraction is more adapted to non-polar compounds[42,43]. Toledo-Guillen et al.[44] reported that CSE is more efficient than SC-CO2 for the extraction of glycosylated flavanones. This result is attributed to the high molecular weight and polarity of flavonoids.
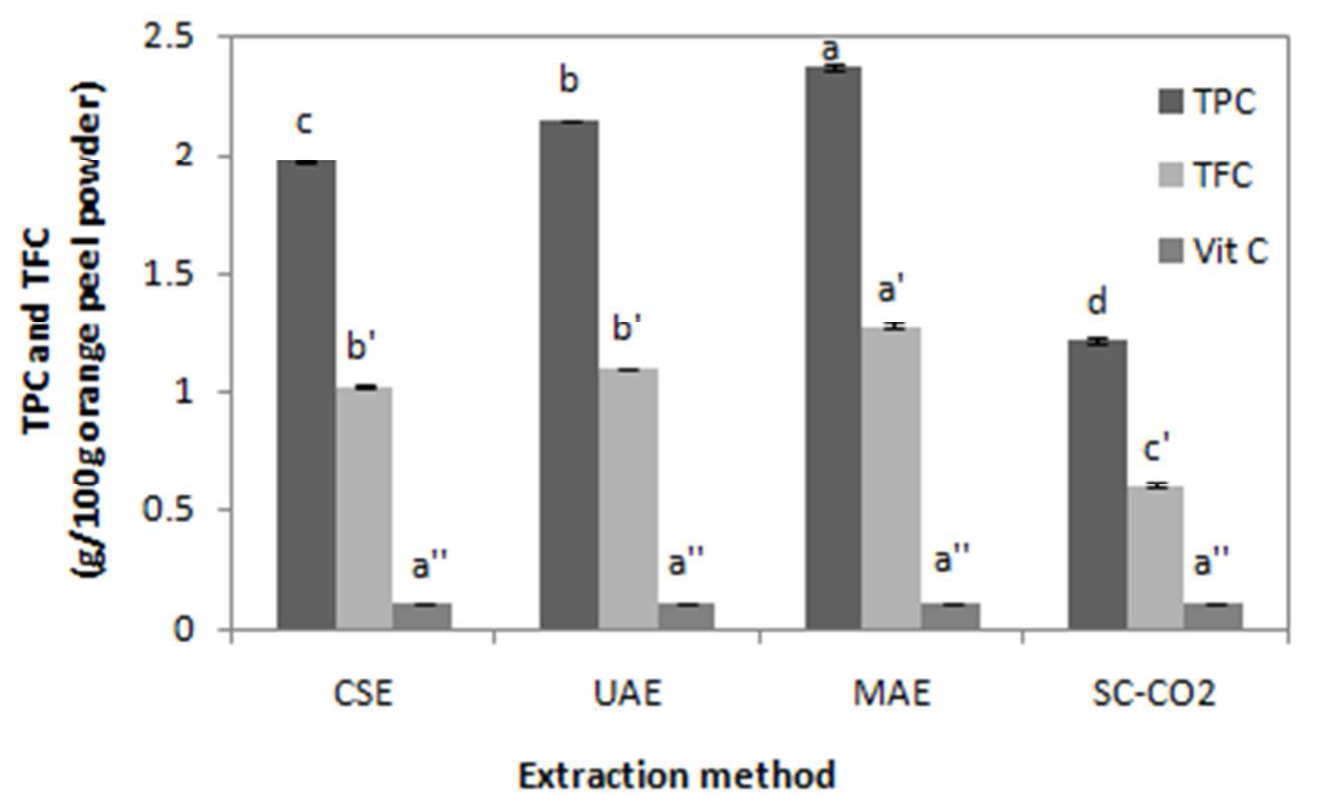
Figure 1: TPCFC and TFCSP of Maltease orange peel obtained by CSE (conventional solvent extraction), UAE (ultrasound assisted extraction), MAE (microwave assisted extraction), and SC-CO2 (supercritical CO2 extraction) methods.
Results are present as means ± S.D. for triplicate analysis. Values with the same letter are not significantly different at p < 0.05.
According to these results, the classification of the various extraction methods taking phenolic and flavonoid contents as criteria of method efficiency is: the most efficient is microwaving assisted extraction followed by ultrasound assisted extraction then conventional solvent extraction and the least efficient is supercritical CO2 extraction.
These results are in accordance with those found by others authors. Dahmoune et al.[45] compared three methods of extraction of lemon peel phenolic compounds: CSE, UAE and MAE. The authors reported that ultrasound cause disruption of plant cells by cavitation. The particles of the powder of lemon peel are resistant to ultrasound energy[46]. The rise of pressure in the cellular pores causes a faster break compared with the control. However, MAE causes more intense tissue degradation under the action of microwaves. Indeed, MAE dehydrated cellulose and reduces its mechanical strength, which allows an easy penetration of the solvent into the cellular channels[40]. Heating by microwave causes cellular damage and a weakened microstructure that helps to quickly release the solute in the solvent.
Identification and quantification of orange peel flavonoids in different extracts
Identification: Ten phenolic compounds were identified in Maltease orange peel extracts. Results obtained by HPLC-DAD-MS were presented in Table 3.
Table 3: Rt, pseudomolecular ions, adduct ions with Na+ , and UVmax of orange peel phenolic compounds identified by HPLC-DADMS.
Conventional solvent extraction: m/v:5g:50 ml, 30 min, 35°C, ethanol 80%, mechanical agitation at darkness and 3 extraction cycles.
| Order of appearance | Rt (min) |
[M+H]+ (m/z) |
[M+Na]+ (m/z) |
UV ƛmax (nm) | Identification |
|---|---|---|---|---|---|
| 1 | 22.80 | 597 | 619 | 284, 327 | Eriocitrin |
| 2 | 31.85 | 581 | 603 | 284, 329 | Narirutin |
| 3 | 31.97 | 581 | 603 | 280, 328 | Naringin |
| 4 | 33.10 | 611 | 633 | 284, 328 | Hesperidin |
| 5 | 33.95 | 611 | 633 | 285,327 | Neohesperidin |
| 6 | 40.77 | 595 | 617 | 226, 284, 332 | Didymin |
| 7 | 51.58 | 373 | 395 | 240, 264, 328 | Sinensetin |
| 8 | 52.37 | 403 | 425 | 237, 268,320 | 3’,4’, 5,5’6,7, Hexamethoxyflavone |
| 9 | 55.29 | 402 | 425 | 249, 271, 334 | Nobiletin |
| 10 | 58.54 | 372 | 395 | 271, 324 | Tangeretin |
These results showed that flavanones (eriocitrin, narirutin, naringin, hesperidin, neohesperidin, didymin) and polymethoxylated flavones (sinensetin, 3’,4’,5,5’6,7,-Hexamethoxyflavone, tangeretin, nobiletin) are the main compounds in the ethanoic extract. Except for narirutin and eriocitrin, a similar composition was reported by Anagnostopoulou et al.[47] in Greek Navel sweet orange peel. However, this variety also contains pentamethoxyflavone. Whereas, Kanaze et al.[48] found in Navel orange peel five flavanones (hesperidin, neohesperidin, naringin, didymin), three glycosylated flavones (leuteolin- 7-O-rutinoside, chrysoeriol-7-O-rutinoside diosmin),polymethoxylated flavones (sinensetin, nobiletin, hexamethoxyflavone heptamethoxyflavone). Moreover, Toledo-Guillén et al.[44] identified in orange peel extracts glycosylated flavanones (hesperidin, narirutin) and the polymethoxyflavones (sinensetin, nobiletin, tetramethylscutellarein and tangeretin).
Quantification: HPLC analysis showed that whatever the method used for extraction, the orange peel contains the following individual flavonoids: hesperidin, neohesperidin, eriocitrin, narirutin, naringin, didymin, sinensetin, 3’,4’,5,5’,6’,7’-Hexamethoxyflavone, tangeretin and nobiletin. The percentages of these compounds reported to total flavonoids content, TFCHPLC (corresponding to the sum of individual flavonoids determined by HPLC) are summarized table 4.
Table 4: Contents of individual flavonoid compounds (as g/100g of orange peel powder) of Maltease orange peel extracted by CSE, UAE, MAE and SC-CO2.
Results are presented as means ± S.D. for triplicate analysis. Values with the same letter are not significantly different at p < 0.05.
| Compound | CSE | UAE | MAE | SC-CO2 |
|---|---|---|---|---|
| Hesperidin | 0.551 ± 0.001c | 0.836 ± 0.029a | 0.781 ± 0.074b | 0.407 ± 0.008d |
| Neohesperidin | 0.860 ± 0.003c | 0.986 ± 0.006b | 1.045 ± 0.001a | 0.624 ± 0.013d |
| Eriocitrin | 0.019 ± 0.001a | 0.019 ± 0.001a | 0.016 ± 0.000a | 0.007 ± 0.001b |
| Narirutin | 0.038 ± 0.001a | 0.017 ± 0.001c | 0.002 ± 0.001e | 0.008 ± 0.001d |
| Naringin | 0.042 ± 0.001c | 0.081 ± 0.009b | 0.218 ± 0.001a | 0.043 ± 0.005c |
| Didymin | 0.026 ± 0.001c | 0.041 ± 0.003b | 0.062 ± 0.001a | 0.018 ± 0.001d |
| Sinensetin | 0.020 ± 0.001d | 0.040 ± 0.002ab | 0.040 ± 0.001b | 0.045 ± 0.002a |
| Hexamethoxyflavone | 0.006 ± 0.001c | 0.010 ± 0.013b | 0.016 ± 0.002a | 0.010 ± 0.006b |
| Tangeretin | 0.005 ± 0.001a | 0.009 ± 0.003a | 0.011 ± 0.000a | 0.008 ± 0.001a |
| Nobiletin | 0.042 ± 0.002e | 0.074 ± 0.003b | 0.084 ± 0.001a | 0.068 ± 0.001c |
| TFCHPLC | 1.609 ± 0.013b | 2.113 ± 0.017a | 2.275 ± 0.082a | 1.238 ± 0.090c |
CSE: conventional solvent extraction, UAE: ultrasound assisted extraction, MAE: microwave assisted extraction, and SC-CO2: supercritical CO2 extraction.
The total phenols content of Maltese orange peel extract (CSE) determined by the Folin test is equal to 1.968 ± 0.003 g EAG/100 g of orange peel powder, whereas, the sum of individual flavonoids determined by HPLC and cited previously (Table 4) is equal to 1,609 g/100g orange peel powder. This difference (~18.2%) between spectrophotometric and chromatographic methods was acceptable and (18.2%) is can be explained by the fact that the Folin test overestimate the content of total phenols due to interference of the reagent with other reducing compounds which may exist in the extract[25] as reducing sugars (fructose, glucose ...) and organic acids (Vitamin C, citric acid malonic acid ...). Furthermore, the content of total flavonoids determined by HPLC (1.609 g/100 g of orange peel powder) is higher than the total flavonoids content determined by spectrometric method (1.012 ± 0.003 g rutin/100g of orange peel powder).
The spectrometric method of determination of total flavonoids underestimates the actual content of total flavonoids and this can be explained by the fact that some phenolic compounds cannot react with aluminum trichloride (AlCl3) as hesperidin which is present in large quantities in the Maltease orange peel (34.24%). The spectrometric method was the main common method used by many authors for total flavonoid estimation[13,35]. Chromatographic analysis is more appropriate and thus should be recommended for phenols determination in citrus.
Table 4 shows the individual flavonoids content of Citrus Maltese peel expressed at g/100g orange peel powder. The results obtained indicate that the efficiency of the extraction for a given method depends upon the structure of the flavonoid. The highest quantities of neohesperidin, hesperidin, didymin, naringinn nobiletin, tangeretin and hexamethoxyflavone were obtained respectively by using MAE. The eriocitrin content is achieved with a maximum content by UAE, SC-CO2 (difference not significant) while it is CSE and SC-CO2 for the highest levels of sinensetin and narirutin. This result coincides with those found in the literature. Indeed, Hayat et al.[22] compared CSE, MAE and UAE for the extraction of phenolic acids of mandarin peel. The MAE provides the highest level of ferulic acid (0.239 g/100 g dry matter) compared to UAE (0,235 g/100 g dry matter) and CSE (0.205 g/100 g dry matter). Khan et al.[23] reported that the contents of hesperidin and naringin of orange peel Valencia cultivar, obtained by UAE were significantly higher (0.250 and 0.070 g/100 g dry matter, respectively) than those obtained by CSE (0.145 and 0.051 g/100 g dry matter, respectively).
Effect of extraction methods on radical scavenging activity
As has been previously reported, the amount of total and individual flavonoids of orange peel extracts depends on the used method. This variation should affect the antioxidant activity of the different extracts. To evaluate this effect, the antioxidant activity was measured by DPPH methods (Figure 2). Vitamin C contents were measured in the different extracts; it appears that this content remains constant (200 μM) whatever the extraction method used. So the variations observed cannot be attributed to this molecule.
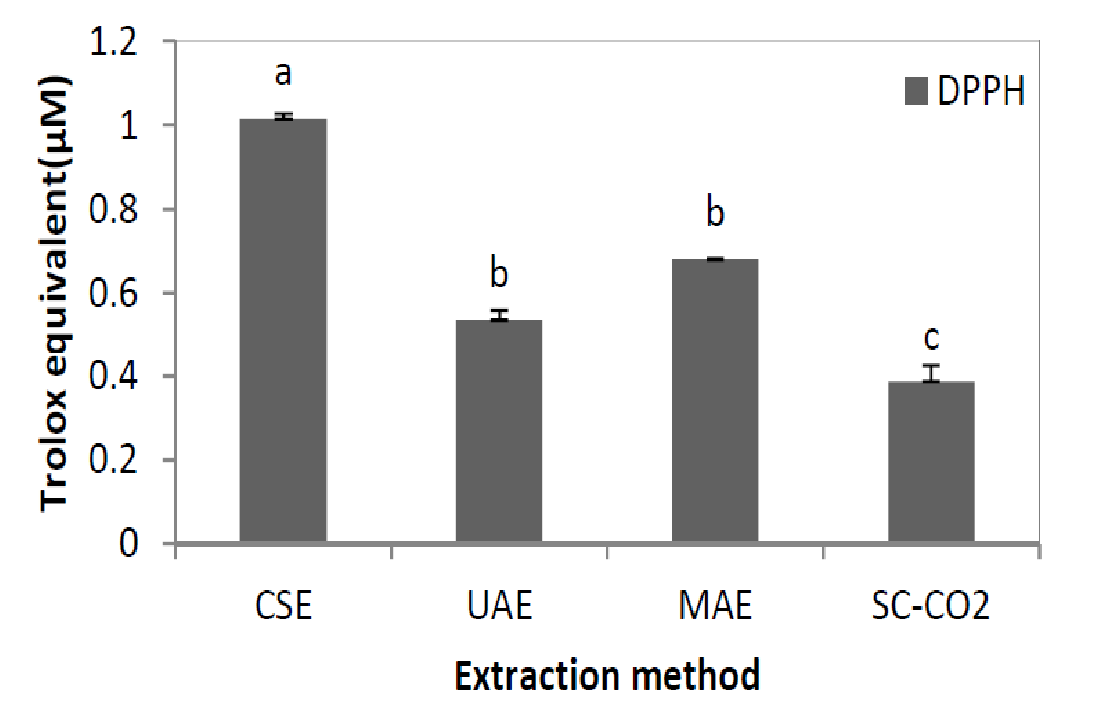
Figure 2: Antioxidant activity (μM Trolox equivalent, DPPH test) measured for Maltease orange peel extracts obtained by CSE, UAE, MAE and SC-CO2 methods.
Results are presented as means ± S.D. for triplicate analysis. Results are present as means ± S.D. for different at p < 0.05.
These data show that orange peel extracted obtained by CSE presents higher radical scavenging capacity compared to extracts obtained by other extraction methods. Moreover, it can be noticed a significant decrease of the antioxidant activity measured by the DPPH method in the following order: CSE, SC-CO2, MAE and UAE. These results are not in accordance with those previously reported for TPCFC and TFCSP (Figure 1).
Indeed, a decrease of 15.44% was observed for antioxidant activity of MAE extract compared to CSE although that MAE extract contains the highest phenolics content (TPCFC, TFCsp and TFCHPLC). This result could be explained by (i) a slow reaction between citrus flavonids with the stable DPPH and / or (ii) a different quantitative flavonoids composition of the extracts (Table 4), the appearance of new formed compounds during MAE and interactions different compounds thus resulting in positive or negative synergies of antioxidant activity[49]. According to literature, compounds newly formed during the Maillard and thermo-oxidation reactions could be explaining the increase of antioxidant activity of MAE extract. In our case, after the MAE, a change of extract colour from orange to brown and an odor of caramelization were noticed, but we can’t identify new compounds in HPLC chromatogram. The products of the Maillard reaction (PRM) could be divided into different groups. During the first phase of the PRM training, small molecules such as glyoxyl, methyloxyl and others are trained dicarbonyls[50,51]. Since these compounds have a high oxidative potential and chemical activity, PRM trained at this stage tend to be pro-oxidant. The high chemical activity of these products between them then leads to higher molecular weight products and a brown colour through a series of condensation and polymerization reaction[52]. PRM complexes are at the later stage antioxidant and were named collectively melanoidins[53,54]. These compounds can interact during extraction to form other compounds that could present different structures and properties from the original[55]. Accordingly, it is necessary to identify, in further explorations, the structure of other antioxidants such as polymerization products and their individual contributions to the total antioxidant capacity of the extract.
Figure 2 showed also that the antioxidant activity of the extract obtained by UAE is lower than the CSE extract (29.27%). This result is similar to that reported by Dahmoune et al.[45]. The authors have shown that the antioxidant activity of the extract of lemon peel obtained by CSE is higher than that achieved by the UAE. This can be explained by the fact that ultrasound may induce the formation offree radicals in the liquid medium and improves the sonochemical reactions and polymerization/depolymerisation reactions, thus causing oxidation, degradation of bioactive compounds and appearance of off-flavours of the products[56-58].
Table 5 shows the antioxidant activity of the ten individual flavonoids of orange peel extract and the vitamin C, measured by DPPH. Results are given in table 5.
Table 5: Antioxidant activity of individual flavonoids and vitamin C (μM Trolox equivalent, DPPH test) of Maltease orange peel extract.
| Compound | DPPH (μM Trolox) | Concentration in the extract (μM) | |
|---|---|---|---|
| Glycosylated flavanones | Neohesperidin | 0.095 ± 0.012 | 467 |
| Hesperidin | 0.054 ± 0.002 | 300 | |
| Vitamin C | 1.224 ± 0.027 | 200 | |
| Eriocitrin | 1.009 ± 0.012 | 11 | |
| Narirutin | ND at 344 μM | 22 | |
| Didymin | 0.083 ± 0.019 | 15 | |
| Naringin | 0.056 ± 0.021 | 24 | |
| Polymethoxylated flavones | Hexamethoxyflavone | 0.038 ± 0.009 | 5 |
| Tangeretin | 0.115 ± 0.022 | 4 | |
| Nobiletin | ND at 932 μM | 35 | |
| Sinensetin | ND at 1 μM | 18 | |
| TEAC predicted (Equation 3) | 0.332 ± 0.001 | - | |
| TEAC measured (Equation 2) | 0.100 ± 0.013 | - |
These results indicate that the highest activities were observed for neohesperidin, eriocitrin and vitamin C respectively with DPPH method. However, nobiletin, sinensetin and narirutin do not present any activity. The results were confirmed by Khan et al.[23] who reported that the flavanones of orange peel react very slowly with the stable DPPH radical, making, therefore, a minor contribution[23]. To check the assumption of negative or positive synergic effects of flavonoids on the antioxidant activity, the antioxidant activity of a mixture prepared from the ten flavonoids was compared to that predicted from the values of each compound corrected by their molar fraction (Table 5). The results showed that we have a clear synergic effect. Thus, a value of 0.100 ± 0.013 was obtained by DPPH against 0.332 ± 0.001 for the predicted one. These results coincide with those found by Hidalgo et al.[49] which concluded that it is impossible to predict the antioxidant activity of a sample just by studying one type of flavonoid or other types of antioxidants in the extract such as vitamin C or E. In some cases, synergistic or antagonistic effects may occur resulting in the increase or decrease in the total antioxidant activity of the extract[59].
This study showed also that there isn’t a correlation between radical scavenging activity (TEAC) and total flavonoids contents (TFHPLC) or glycosylated flavanones (sum GF) but significant negative correlation was observed for TEAC – and polymethoxylated flavones (Sum MF) (Table 6). This result is in agreement with those reported by Ghasemi et al.[13]. The authors explain the absence of correlation by the fact that flavonoids can act as proton donating and show radical scavenging activity, but, orange peel extract is a mix of compounds with distinct activities.
Table 6: Correlation matrix between variables
| Variables | TFHPLC | Sum GF | Sum MF | TEAC |
|---|---|---|---|---|
| TFHPLC | 1.000 | 0.988 | 0.431 | 0.140 |
| Sum GF | 0.988 | 1.000 | 0.339 | 0.213 |
| Sum MF | 0.431 | 0.339 | 1.000 | -0.768 |
| TEAC | 0.140 | 0.213 | -0.768 | 1.000 |
Comparison off the efficiency of the different extraction methods
Results of PCA (Figure 3) revealed that 98.19% of the variation among the measured parameters (TFHPLC, Sum GF, Sum MF, TEAC) was attributed to the first two principal components (Table 7). The first principal component (TFHPLC) explained 55.99 % of the variance and the second component explain 42.20% of the variance.
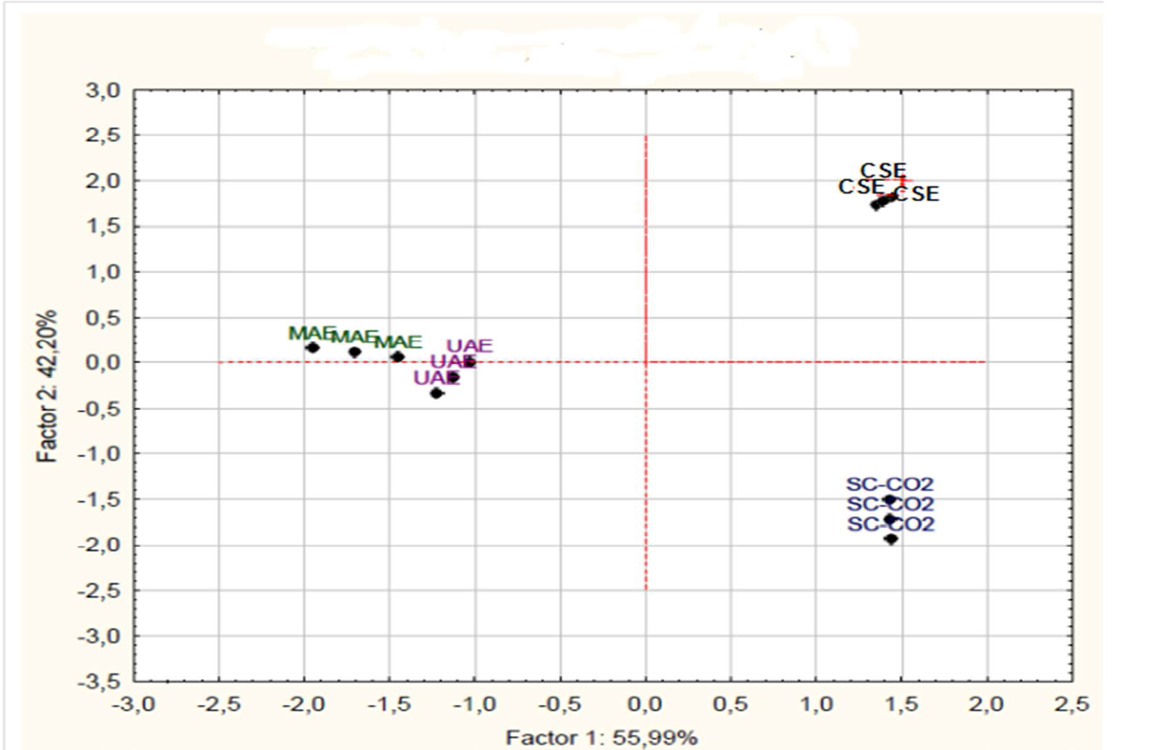
Figure 3: Projection of the extraction methods on the factor plane
Table 7: Eigenvalues of correlation matrix and related statistics.
| Variables | Eigenvalue | % Total variance | Cumulative Eigenvalue | Cumulative % |
|---|---|---|---|---|
| TFHPLC | 2.239 | 55.991 | 2.239 | 55.991 |
| Sum GF | 1.688 | 42.203 | 3.927 | 98.194 |
| Sum MF | 0.067 | 1.685 | 3.995 | 99.880 |
| TEAC | 0.005 | 0.119 | 4.000 | 100.000 |
Based on the PCA analysis, three different extraction methods could be distinguished according to the first principal component (TFHPLC) and the second principal component (Sum GF): The first group was formed by CSE, the second group corresponds to SC-CO2. Whereas, the MAE and UAE could be gathered in a homogenous group. Our study showed that supercritical CO2 extraction gives the lowest flavonids content compared with the others methods of extraction. But, this technique of extraction allows the obtaining of extracts without remaining solvent traces and without having to use a cleaner. In addition, CO2 is inexpensive and can easily be obtained at a high purity and is food-grade[60]. The use of supercritical fluid provides pure final extract devoid of undesirable compounds such as organic pollutants, toxins and pesticides. The selectivity of supercritical fluid is higher than liquid solvent as its solvation power can be tuned either by changing temperature and/or pressure. Separation of solute from solvent in conventional extraction process can easily be passed by depressurization of supercritical fluid, which will save time[55,61]. It also allows avoiding thermal degradation and decomposition of thermolabile compounds, due to the operation at reduced temperature[42]. However, the non-polar characteristic of CO2 has limited its application for the extraction of polar compounds, major phenolics of orange peel. Nevertheless, the polarity of CO2 can be enhanced by adding modifiers such as ethanol which decrease extraction selectivity[62]. The cost of SC-CO2 extraction process has restricted the applications to certain specialized fields such as decaffeinated coffee preparation industries[63]. The main drawbacks remain its high initial investment and difficulties to perform continuous extractions[64].
However, ultrasonic and microwave extraction gave the higher phenolic content. Ultrasound assisted extraction is also an upcoming extraction technique which allows the extraction of thermolabile components since the operating temperature can remain low during the process, thus maintaining extract quality[65,66]. The main advantages of UAE are: improvement of mass transfer, breakdown of plant cells, improvement of solvent penetration and capillary effects of ultrasound[67]. However, it should be noted that since ultrasound generates heat, it is important to accurately control the extraction temperature. The sonication time should also be considered carefully as excess of sonication can damage the quality of extracts by the formation of free radicals[68]. Ultrasound as an extraction technique has the potential to be upscaled, at low cost and industrial potential may exist, because of possible lower operational costs[60].
However, microwave assisted extraction showed obvious advantages in terms of high extraction efficiency and antioxidant activity of extract within the shortest extraction time. These results are in agreement with the findings of other researchers[39,69]. Several advantages of MAE have been described such as quicker heating for the extraction of bioactive substances from plant materials; reduced thermal gradients; reduced equipment size and increased extract yield. MAE can extract bioactive compounds more rapidly and a better recovery is possible than conventional extraction processes. It is a selective technique to extract organic and organometallic compounds that are more intact. MAE is also recognized as a green technology because it reduces the use of organic solvent[61]. Whereas, it is necessary to avoid high microwave power to prevent the degradation of phenolic compounds and the formation of new products that can be toxic. These results are consistent with the findings of other researchers[39,69].
Conclusion
The main flavonoids of Maltease citrus peel are glycosylated flavanones (neohesperidin, hesperidin, narirutin, naringin, didymin, eriocitrin) and polymethoxylated flavones (sinensetin, tangeretin, nobiletin, hexamethoxyflavone). Interestingly, neohesperidin and hesperidin were the main flavonoids constituent in the peel. This study is the first report comparing the efficiency of four extraction methods of orange peel phenolic compounds in terms of total and individual flavonoids and their antioxidant activities. MAE (80% ethanol, m/v: 5 g, 50 ml, 170 W for 10 s, and 3 successive extractions) was found to be a better approach than ultrasound assisted extraction, conventional solvent extraction, and supercritical CO2 extraction in criteria of phenols, flavonoids contents and individual flavonoids but antioxidant activity is less than that of the CSE. MAE showed many advantages, such as shorter time, higher extraction rate, the saving of energy and better products with lower cost compared to supercritical CO2 extraction, which need high investments. The results demonstrated that MAE can substitute the traditional CSE, which time-consuming techniques for efficient extraction of orange peel phenolic compounds. Despite a low TPC and TFC, CSE allows the obtaining of the extract with the highest antioxidant activity.
This study showed also that there is no addictivity on antioxidant activity. Consequently, the antioxidant activity of orange peel extract can be due to the synergic effect between flavonoids but also with others compounds of the extract such as vitamin C. Moreover, interactions between flavonoids or degradation products occur and can lead to positive or negative synergies on the antioxidant activity. Therefore, an identification of degradation products must be done to confirm our hypothesis and to check that these molecules are not toxic.
Although the MAE was considered the best method of extraction of phenolic compounds orange peel of the Maltease variety, more research is needed to better optimize the MAE. Indeed, in our study, a fixed temperature of 35°C was chosen to avoid degradation of phenolic compounds and to compare all extraction methods including those requiring a moderate temperature as UAE and SC-CO2.
Acknowledgement:
This work was financially supported by the Tunisian Ministry of Higher Education and Scientific Research. The authors thank Pr. Danielle BARTH (ENSIC, LRGP, Nancy, France).
Conflict of Interest:
No conflict of interest.
References
- 1. USDA (United Sates Department of Agriculture) 2014 Citrus: World Markets and Trade.
- 2. Marin, F.A., Soler-Rivas, C., Benavente-Garcio., et al. By-products from different citrus processes as a source of customized functional fibres. (2007) Food Chem 100(2): 736-741.
- 3. Bocco, A., Cuvelier, M.E., Richard, H., et al. Antioxidant activity and phenolic composition of citrus peel and seed extracts. (1998) J Agric Food Chem (46) 6: 2123-2129.
- 4. Bampidis, V.A., Robinson, P.H. Citrus by-products as ruminant feeds: a review. (2006) Anim Feed Sci Tech 128(3-4): 175-217.
- 5. Byrne, C.M, Allen, S.D., Lobkovsky, E.B., et al. Alternating Copolymerization of Limonene Oxide and Carbon Dioxide. (2004) J Am Chem Soc 126(37): 11404-11405.
- 6. Pourbafrani, M., Forgacs, G., Horváth, I.S., et al. Production of biofuels, limonene and pectin from citrus wastes. (2010) Bioresource Technol 101(11): 4246-4250.
- 7. Hawthorne, S.B., Grabanski, C.B., Martin, E., et al. Comparisons of Soxhlet extraction, pressurized liquid extraction, supercritical fluid extraction and subcritical water extraction for environmental solids: recovery, selectivity and effects on sample matrix. (2000) J Chromatogr A 892(1-2): 421-433.
- 8. Liu, L., Fishman, M. L., Kost, J., et al. Pectin-based systems for colon-specific drug delivery via oral route. (2003) Biomaterials 24(19): 3333-3343.
- 9. Piriyaprasarth, S., Sriamornsak, P. Flocculating and suspending properties of commercial citrus pectin and pectin extracted from pomelo (Citrus maxima) peel. (2011) Carbohydr Polym 83(2): 561-568.
- 10. Fisher, K., Phillips, C. The effect of lemon, orange and bergamot essential oils and their components on the survival of Campylobacter jejuni, Escherichia coli O157, Listeria monocytogenes, Bacillus cereus and Staphylococcus aureus in vitro and in food systems. (2006) J Appl Microbiol 101(6): 1232-1240.
- 11. Singh, P., Shukla, R., Prakash, B., et al. Chemical profile, antifungal, antiaflatoxigenic and antioxidant activity of Citrus maxima Burm. and Citrus sinensis (L.) Osbeck essential oils and their cyclic monoterpene, DL-limonene. (2010) Food Chem Toxicol 48(6): 1734-1740.
- 12. Mihiri, N., Ioannou, I., Ghoul, M., et al. Extraction methods of citrus peel phenolic compounds: a review. (2014) Food Rev Int 30(4): 265-290.
- 13. Ghasemi, K., Ghasemi, Y., EbrahimZadeh, M.A. Antioxidant activity, phenol and flavonoid contents of 13 citrus species peels and tissues. (2009) Pak J Pharm Sci 22(3): 277-281.
- 14. Hussin, M. H., Kassim, M. J. The corrosion inhibition and adsorption behavior of Uncaria Gambir extract on mild steel in 1M HCl. (2011) Mater Chem Phys 125(3): 461-468.
- 15. Ioannou, I., Hafsa, I., Hamdi, S., et al . Review of the effects of food processing and formulation on flavonol and anthocyanin behavior. (2012) J Food Eng 111(2):208-217.
- 16. Manthey, J.A., Grohmann, K. Concentrations of hesperidin and other orange peel flavonoids in citrus processing byproducts. (1996) J Agric Food Chem 44(3): 811-814.
- 17. Anagnostopoulou, M.A., Kefalas, P., Papageorgiou, V.P., et al. Radical scavenging activity of various extracts and fractions of sweet orange peel (Citrus sinensis). (2006) Food Chem 94(1): 19-25.
- 18. Li, B. B., Smith, B., Hossain, M. M. Extraction of phenolics from citrus peels. I. Solvent extraction method. (2006) Sep Purif Technol 48(2): 182-188.
- 19. Chemat, F., Abert-Vian, M., Zill-e-Huma. Microwave assisted-separations: green chemistry in action. In: Pearlman, J.T. (Ed.), Green Chemistry Research Trends. (2009) Nova Science Publishers Inc United States 130.
- 20. Rawson, A., Patras, A., Tiwari, B.K., et al. Effect of thermal and non thermal processing technologies on the bioactive content of exotic fruits and their products: Review of recent advances. (2011) Food Res Int 44(7): 1875-1887.
- 21. Boukroufa, M., Boutekedjiret, C., Petigny, L., et al. Bio-refinery of orange peels waste: A new concept based on integrated green and solvent free extraction processes using ultrasound and microwave techniques to obtain essential oil, polyphenols and pectin. (2015) Ultrason. Sonochem 24: 72-79.
- 22. Hayat, K., Hussain, S., Abbas, S., et al. Optimized microwave-assisted extraction of phenolic acids from citrus mandarin peels and evaluation of antioxidant activity in vitro. (2009) Sep Purif Technol 70(1): 63-70.
- 23. Khan, M.K., Abert-Vian, M., Fabiano-Tixier, A.S., et al. Ultrasound-assisted extraction of polyphenols (flavanone glycosides) from orange (Citrus sinensis L.) peel. (2010) Food Chem 119(2): 851-858.
- 24. Li, W., Wang, Z., Wang, Y.P., et al. Pressurised liquid extractioncombining LC–DAD–ESI/MS analysis as an alternative method to extract three major flavones in Citrus reticulata ‘Chachi’ (Guangchenpi). (2012) Food Chem 130(4): 1044-1049.
- 25. Singleton, V.L., Orthofer, R., Lamuela-Raventos, R.M. Analysis of total phenols and other oxidation substrates and antioxidants by means of folin-ciocalteu reagent. (1988) Methods Enzymol 299: 152-178.
- 26. Zhishen, J., Mengcheng, T., Jiamming, W. The determination of flavonoid contents in mulberry and their scavenging effecs on superoxide radicals. (1999) Food chem 64(4): 555-559.
- 27. Tabart, J., Kevers, C., Pincemail, J., et al. Evaluation of spectrometric methods for antioxidant compound measurement in relation to total antioxidant capacity in beverages. (2010) Food Chem 120(2): 607- 614.
- 28. Rice-Evans C., Miller, N., Paganga, G. Structure-antioxidant activity relationships between flavonoids and phenolic acids. (1996) Free Radic Biol Med 20(7): 933-956.
- 29. Burda, S., Oleszek, W. Antioxidant and antiradical activities of flavonoids. (2001) J Agric Food Chem 49(6): 2774-2779.
- 30. Kammoun, B. A., Ghanem, N., Mihoubi, D., et al. Effect of Infrared Drying on Drying Kinetics, Color, Total Phenols and Water and Oil Holding Capacities of Orange (Citrus Sinensis) Peel and Leaves. (2011) J Food Eng 7(5): 1-25.
- 31. Ghanem, N., Mihoubi, D., Kechaoua, N., et al. Microwave dehydration of three citrus peel cultivars: Effect on water and oil retention capacities, color, shrinkage and total phenols content. (2012) Ind Crops Prod (40): 167-177.
- 32. Chen, M.L, Yang, D.J, Liu, S.C. Effects of drying temperature on the flavonoid, phenolic acid and antioxidative capacities of the methanol extract of citrus fruit (Citrus sinensis (L.) Osbeck) peels. (2011) Int J Food Sci Tech 46(6): 1179-1185.
- 33. Wang, A.Y., Zhou, M.Y., Lin, W.C. Antioxidative and anti-inflammatory properties of Citrus sulcata extracts. (2011) Food Chem 124(3): 958-963.
- 34. Goulas V., Manganaris, G.A. Exploring the phytochemical content and the antioxidant potential of Citrus fruits grown in Cyprus. (2012) Food Chem 131(1): 39-47.
- 35. Sultana, B., Anwar, F., Asi, M.R., et al. Antioxidant potential of extracts from different agro wastes: Stabilization of corn oil. (2008) Grasas y Aceites 59(3): 205-217.
- 36. Neveu, V., Perez-Jimenez, J., Vos, F., et al. Phenol-Explorer: an online comprehensive database on polyphenol contents in foods. (2010) Database (Oxford).
- 37. Rombaut, N., Tixier, A.S., Bily, A., et al. Green extraction processes of natural products as tools for biorefinery. (2014) Biofuels, Bioprod Biorefin 8(4): 530-544.
- 38. Chemat, F., Huma, Z., Khan, M.K. Applications of ultrasound in food technology: Processing, preservation and extraction. (2011) Ultrason. Sonochem 18(4): 813-835.
- 39. Jawad, A., Langrish, T.A.G. Optimisation of total phenolic acids extraction from mandarin peels using microwave energy: The importance of the Maillard reaction. (2012) J Food Eng 109(1): 162-174.
- 40. Mandal, V., Mohan, Y., Hemalatha, S. Microwave assisted extraction-An innovative and promising extraction tool for medicinal plant research. (2007) Pharmacogn Rev 1(1): 7-18.
- 41. Nayak, B., Liu, R.H., Tang, J. Effect of Processing on Phenolic Antioxidants of Fruits, Vegetables, and Grains-A Review. (2015) Crit Rev Food Sci Nutr 55(7): 887-918.
- 42. Diaaz-Reinoso, B., Moure, S., Domianguez, H., et al. Supercritical CO2 extraction and purification of compounds with antioxidant activity. (2006) J Agric Food Chem 54(7): 2441-2469.
- 43. Pereira, C.G., Meireles, M.A.A. Supercritical Fluid Extraction of Bioactive Compounds: Fundamentals, Applications and Economic Perspectives. (2010) Food Bioprocess Tech 3(3): 340-372.
- 44. Toledo-Guillén, A.R., Higuera-Ciapara, I., García-Navarrete, G., et al. Extractionof bioactive flavonoid compounds from orange (Citrus sinensis) peel using supercritical CO2. (2010) J Biotechnol 150: 576.
- 45. Dahmoune, F., Boulekbache, L., Moussi, K., et al. Valorization of citrus limon residues for the recovery of antioxidants: evaluation and optimization of microwave and ultrasound application to solvent extraction. (2013) Ind Crops Prod 50: 77-87.
- 46. Aspé, E., Fernández, K. The effect of different extraction techniques on extraction yield, total phenolic, and anti-radical capacity of extracts from Pinus radiate Bark. (2011) Ind Crops Prod 34(1): 838-844.
- 47. Anagnostopoulou, M.A., Kefalas, P., Kokkalou, E., et al. Analysis of antioxidant compounds in sweet orange peel by HPLC–diode array detection– electrospray ionization mass spectrometry. (2005) Biomed Chromatogr 19(2): 138-148.
- 48. Kanaze, F.I., Termentzi, A., Gabrieli, C., et al. Thephytochemical analysis and antioxidant activity assessment of orange peel (Citrus sinensis) cultivated in Greece–Crete indicates a new commercial source of hesperidin. (2008) Biomed Chromatogr 23(3): 239-249.
- 49. Hidalgo, M., Sánchez-Moreno, C., De Pascual-Teresa, S. Flavonoid interaction and its effect on their antioxidant activity. (2010) Food Chem 121(3): 691-696.
- 50. Hodge, J.E. Dehydrated foods-chemistry of browning reactions in model systems. (1953) J Agric Food Chem. 1 (15): 928-943.
- 51. Yaylayan, V.A., Haffenden, L.J.W. Mechanism of imidazole and oxazole formation in c-13-2- labelled glycine and alanine model systems. (2003) Food Chem 81(3): 403-409.
- 52. Nicoli, M.C., Anese, M., Severini, C. Combined effects in preventing enzymatic bowning reactions in minimally processed fruit. (1994) J Food Qual 17(3): 221-229.
- 53. Wagner, K.H., Derkits, S., Herr, M., et al. Antioxidative potential of melanoidins isolated from a roasted glucose–glycine model. (2002) Food Chem 78(3): 375-382.
- 54. Liu, S.C., Yang, D.J., Jin, S.Y., et al. Kinetics of color development, pH decreasing, and anti-oxidative activity reduction of Maillard reaction in galactose/glycine model systems. (2008) Food Chem 108(2): 533–541.
- 55. Villa, J.A., Ayala-Zavala, J.F, Heredia, J.B, et al. Technologies for Extraction and Production of Bioactive Compounds to be used as Nutraceuticals and Food Ingredients: An Overview. (2013) Compr Rev Food Sci F 12(1): 5-23.
- 56. Pingret, D., Fabiano-Tixier, A.S., Chemat, F. Degradation during application of ultrasound in food processing: A review. (2013) Food Control 31(2): 593-606.
- 57. Pingret, D., Fabiano-Tixier, A.S., Petitcolas, E., et al. First investigation on ultrasound-assisted preparation of food products: sensory and physicochemical characteristics. (2011) J Food Sci 76(2): 287-292.
- 58. Nayak, B., Dahmoune, F., Moussi, K., et al. Comparison of microwave, ultrasound and accelerated-assisted solvent extraction for recovery of polyphenols from Citrus sinensis peels. (2015) Food Chem 187: 507-516.
- 59. Reber, J.D., Eggett, D.L., Parker, T.L. Antioxidant capacity interactions and a chemical/structural model of phenolic compounds found in strawberries. (2011) Int J Food Sci Nutr 62(5): 445- 452.
- 60. Boonkird, S., Phisalaphong, C., Phisalaphong, M. Ultrasound-assisted extraction of capsaicinoids from Capsicum frutescens on a lab- and pilot-plant scale. (2008) Ultrason. Sonochem 15(6): 1075-1079.
- 61. Azmir, J., Zaidul, I.S.M, Rahman, M.M., et al. Techniques for extraction of bioactive compounds from plant materials: A review. (2013) J Food Eng 117(4): 426-436.
- 62. Lee, Y.H., Charles, A.L., Kung, H.F., et al. Extraction of nobiletin and tangeretin from Citrus depressa Hayata by supercritical carbon dioxide with ethanol as modifier. (2010) Ind. Crops Prod 31(1): 59-64.
- 63. Galanakis, C.M. Recovery of high added-value components from food wastes: Conventional, emerging technologies and commercialized applications. (2012) Trends in Food Sci Tech 26(2): 68-87.
- 64. Chemat, F., Abert Vian, M., Cravotto, G. Green Extraction of Natural Products: Concept and Principles. (2012) Int J Mol. Sci 13(7): 8615-8627.
- 65. Chemat, F., Tomao, V., Virot, M. Ultrasound-assisted extraction in food analysis. In Handbook of Food Analysis Instruments by Semih Ötles, Boca Raton, FL (2008) CRC Press: 85-103.
- 66. Routray, W., Orsat, V. Microwave-assisted extraction of flavonoids: A review. (2012) Food Bioprocess Technol 5(2): 409-424.
- 67. Mason, T., Chemat, F., Vinatoru, M. The extraction of natural products using ultrasound and microwaves. (2011) Curr Org. Chem 15(2): 237–247.
- 68. Wang, L., Weller, C.L. Recent advances in extraction of nutraceuticals from plants. (2006) Trends Sci Technol 17(6): 300-312.
- 69. Hayat, K., Zhang, X., Chen, H., et al. Liberation and separation of phenolic compounds from citrus mandarin peels by microwave heating and its effect on antioxidant activity. (2010) Sep Purif Technol 73(3): 371-376.


