
Consumption Trends of Processed Foods Among Rural Population Selected from South India
Affiliation
Department of Studies in Food Science and Nutrition, University of Mysore, Manasagangotri, Mysore Karnataka, India
Corresponding Author
Jamuna Prakash, Professor, Department of Studies in Food Science and Nutrition, University of Mysore, Manasagangotri, Mysore-570 006, Karnataka, India, Tel: 0821-2419634; E-mail: jampr55@hotmail.com
Citation
Prakash, J. Consumption Trends of Processed Foods among Rural Population Selected From South India. (2015) Int J Food Nutr Sci 2(2): 162-167.
Copy rights
© 2015 Prakash, J. This is an Open access article distributed under the terms of Creative Commons Attribution 4.0 International License.
Keywords
Literacy Level; Drivers of Purchase; Reasons for Purchase; Food Frequency; Fried Snacks; Baked Products
Abstract
Nutrition transition is said to be one of the major causes of rising incidences of non-communicable diseases in Indian population. One of the major changes observed in dietary patterns is consumption of processed foods and eating away from home. This has impacted the nutritional status of populations across many regions. The objective of the study was to map out the consumption trends of processed and catered foods among selected rural population from South India. The study population were 500 respondents from five different villages of Mysore district, which answered a structured questionnaire regarding general background information, major driving forces for purchase of processed foods, and types and frequency of consumption of such foods. The data were collected and classified age wise. The results revealed that the study population mostly belonged to Hindu religion, the literacy and income levels were very low, and majority were non-vegetarians. The primary driving force for purchase of processed foods were mothers followed by media influence. Price and quality of foods were influencing factors for purchase whereas saving of time was major reason for selection of such foods. Snack foods were major items of daily purchase by majority of respondents. The study shows that dietary transition in terms of purchase of processed foods was also observed in rural population.
Introduction
India is considered to be in the midst of a demographic, epidemiological and nutrition transition. Several facts such as growing population, increasing urbanization and changes in life style are thought to be responsible for the occurrence of nutrition transition[1] . India’s economic growth during the 1990s was relatively faster. During the post economic reforms period, a substantial change in various dimensions took place including dietary pattern along with rapid economic transformation[2-6] . It has been reported that there was a greater decline in cereal consumption, particularly coarse cereals and a minor increase in the consumption of other foods seen among rural population which was mainly attributed to increased economic growth. These changes in dietary pattern were not uniform and varied with various socio economic groups[7]. Cereals and cereal products are good source of energy and other vital nutrients, though the process of refining can decrease vital nutrients. Declined consumption of whole grains has been linked with the increased incidences of cardiovascular diseases, cerebrovascular diseases, obesity, metabolic syndrome, diabetes mellitus and cancer. These are known to be positively associated with changes in dietary and lifestyle pattern[8-12].
The nutrition transition is particularly characterized by a drastic change in the dietary pattern i.e. shifting away from a less varied and indigenous traditional form of diet to a varied diet. This type of diet mainly includes more of processed foods, animal foods, more fats and sugary products[13]. A major change has taken place in dietaries of populace all round not only in the composition of meals, but also in the structure as well, which is characterized by extensive consumption of foods of non-traditional origin[1,14,15]. There has been a rapid increase in the consumption of carbonated drinks, fast foods and pre-packaged meals in Latin America, Asia and parts of Europe. A study carried out in India reported that, fast food and soft drink consumption was observed to be too high among the younger segment of the society[16].
Rapid urbanization has been shown to be positively linked to increased adaptation to western foods in many developing societies. In India, marked regional differences with respect to the dietary pattern are observed in both urban as well as rural areas. Rural to urban migration is also known to be a major contributing factor for provoking change in the existing dietary pattern[17]. Historically it is believed that, Indian consumers have had higher priority for fresh foods rather than paying attention to the purchase of convenience food[18]. Marketing and research group conducted a survey in India in which the respondents were asked to rank the activities based on their priority. The results showed that cooking was given seventh rank out of the list of various activities as a leisure and personal interest. With increase in the number of working women a gradual change has taken place in the traditional lifestyle. This is known to have stimulated the demand for processed food products since they can be prepared easily and quickly[19]. It has been demonstrated through research that, younger Indian consumers are more open to novel food products and they have an innate tendency of perceiving imported foods to have high quality in comparison to locally produced products[18,20].
Processed is relatively a new concept to the Indian consumers due to the cultural and personal attitudes about the food as priority is being given to only fresh food and not for prepared and stored food. Hence processed food among Indian population is generally viewed as a new product and an innovation. With respect to innate innovativeness, adoption behavior showed only partial accountability in individual differences[21]. There exists a vast variation between rural and urban population in adoption behavior to process and convenience foods which could further lead to dietary changes. There is a general belief that acceptance of processed foods in urban population is much easier and accounts for a higher proportion of food expenditure. Though, of late, there is an increase in purchase of processed foods even in rural sector. Hence the present study was undertaken with an objective of exploring the consumption trends of processed foods among selected rural population from Mysore.
Methodology
A total of 500 healthy female subjects aged between 20 - 60 years were recruited from five villages coming under Mysore district in South India, namely; Sosale, Karohatti, Alagudu, Nilasoge and Vatalu situated in a 50 - 60km radius around Mysore. From each village about 100 households were selected using purposive random selection for obtaining the responses. The required information about various aspects proposed to study was obtained by constructing a structured questionnaire which was then pre-tested with a small population. After introducing suitable modifications it was administered to the respondents to obtain required information. The questionnaire consisted of a general information schedule which carried questions about age, religion, education, marital status, personal habits, frequency of purchasing processed foods and major driving force for purchasing processed foods, etc.
The dietary assessment schedule consisted question to assess frequency of eating outside food and type of diet. The collected information was compiled and categorized age wise. The obtained results were subjected to suitable statistical treatment. Mean with the respective standard deviation and percentages were used wherever necessary. Chi-square test was performed to know the level of significance.
Results and Discussion
Demographic Characteristics
Table 1 indicates demographic characteristics of the study population. The results showed that the study population consisted of a highest percentage (99.8%) of individuals belonging to Hindu religion and only 0.2% was Christians. Educational status indicated that a vast majority were illiterates (53.4%) followed by 19% of the subjects who had studied up to high school. Subjects who had studied up to PUC were about 16%. A very smaller proportion of the subjects obtained an undergraduate degree (7.4%) or master’s degree (2.4%). Marital status revealed that 93.6% of the subjects were married and only 6.4% were unmarried. Information on the economic status indicated that a highest proportion of individuals belonged to low income group (46.6%) followed by slightly lower percentage (32.8%) of subjects falling into higher income category and middle income groups (20.7%) respectively. Majority (95.8%) of subjects were following non-vegetarian pattern of diet and only 4.2% were vegetarians. Details about the structure of family revealed that, a highest proportion of subjects (64.2%) were living in nuclear families. Subjects belonging to extended family were 30.4% while the percentage of population living in joint family was extremely low (5.4).
Table 1: Demographic characteristics of the subjects (Number of subjects).
| Particulars | Age (years) | |||
|---|---|---|---|---|
| 20 - 30 | 31 - 40 | 41 - 50 | 51 - 60 | |
| Religion | ||||
| Hindu | 138 (27.6) | 168 (33.6) | 112 (22.4) | 82 (16.4) |
| Christian | - | - | - | 1 (0.2) |
| Educational level | ||||
| Illiterate | 32 (6.4) | 116 (23.2) | 59 (11.8) | 60 (12) |
| 10th Grade | 40 (8) | 26(5.2) | 26 (5.2) | 3 (0.6) |
| 12th Grade | 50 (10) | 23 (4.6) | 10 (2) | 2 (0.4) |
| Undergraduate | 21 (4.2) | 14 (2.8) | 5 (1) | 1 (0.2) |
| Postgraduate | 7 (1.4) | 4 (0.8) | 1 (0.2) | - |
| Marital status | ||||
| Married | 117 (23.4) | 157 (31.4) | 103 (20.6) | 91 (18.2) |
| Unmarried | 24 (4.8) | 8 (1.6) | - | - |
| Economic status (Income group) | ||||
| 5000 | 59 (11.8) | 60 (12) | 68 (13.6) | 46 (9.2) |
| >5000-10000 | 21 (4.2) | 66 (13.2) | 11 (2.2) | 5 (1) |
| 15000-20000 | 44 (8.8) | 50 (10) | 45 (9) | 25 (5) |
| Type of diet | ||||
| Vegetarian | 13 (2.6) | 4 (0.8) | 3 (0.6) | 1 (0.2) |
| Non-vegetarian | 125 (25) | 164 (32.8) | 109 (21.8) | 81 (16.2) |
(Figures in parenthesis refer to percent of subjects.)
Primary Drivers of Purchase
The respondents were asked a question to identify primary drives for purchase of processed foods and results are given in Table 2. Out of the total, 27% and 32.4% of the subjects in the age group of 20 - 30 years and 31 - 40 years considered mother as the major stimulating force for buying outside food. The influence of father as a driving force was seemed to be very low, which are aged between 1.6 - 3.6% for the various age groups. As evident from the table, the media was observed to have greater impact on the purchase of outside food. A total of 23% of the subjects in the age group of 31 - 40 years opined that they get influenced through television advertisements. A considerably higher percentage of subjects (16.6%) in the younger age group (20 - 30 years) were also found to be influenced by television viewing. Peer group influence on purchasing of outside food was noticed to be very small.
Table 2: Primary driver for purchasing outside food (Number of subjects).
| Driver | Age (years) | |||
|---|---|---|---|---|
| 20 - 30 | 31 - 40 | 41 - 50 | 51 - 60 | |
| Mother | 135(27) | 162(32.4) | 82(16.4) | 21(4.2) |
| Father | 10(2) | 17(3.4) | 18(3.6) | 8(1.6) |
| Others | 16(3.2) | 17(3.4) | 11(2.2) | 3(0.6) |
| Media | 83(16.6) | 115(23) | 39(7.8) | 43(8.6) |
| Family members/relatives | 41(8.2) | 49 (9.8) | 34 (6.8) | 33 (6.6) |
| Peer group | 18 (3.6) | 16 (3.2) | 16 (3.2) | 13 (2.6) |
| X² | < 0.0001*** | |||
| Factors | ||||
| Price | 44 (8.8) | 69 (13.8) | 63 (12.6) | 108 (21.6) |
| Taste | 15 (3) | 13 (2.6) | 10 (2) | 10 (2) |
| Quality | 85 (17) | 10 (2) | 5 (1) | 1 (0.2) |
| Brand and packaging | 50 (10) | 10 (2) | 5 (1) | 2 (0.4) |
| X² | < 0.0001*** | |||
| Reason for purchasing processed foods | ||||
| Saves time | 98 (19.6) | 143 (28.6) | 59 (11.8) | 10 (2) |
| Taste | 98 (19.6) | 20 (4) | 12 (2.4) | 5 (1) |
| Convenience | 22 (4.4) | 21 (4.2) | 10 (2) | 2 (0.4) |
| X² | 0.000*** | |||
(Figures in parenthesis refer to percent of subjects.)
The major factors which were considered while purchasing processed food were price, taste, quality, brand and packaging. The influence of price was said to be higher in older age group, where 21.6% of subjects stated that price was a major factor. Food price is one of the most important factors which are suggested to have greater impact on individuals’ food choice. Consequently, it is been estimated to greatly affect energy intake and nutritional quality of the diets. Investigation by Bowman[22] has suggested that about 46.8% of women considered food price as a significant factor which was given prime importance in the process of purchasing and meal planning. About 2/3rd of women from families below poverty line and 1/3rd from above poverty line households considered food price as very important. It was also observed that, the women who considered food price to be very important exhibited a reduced intake of energy, carbohydrate and dietary fiber. Subjects buying processed foods because of the unique taste profile were very low and were in the range of only 2 - 3%. About 17% of the subjects in the age group of 20 - 30 years considered quality of the product as one of the criteria before purchasing. The preference given to brand and packaging was also recorded and was found to be quite high for 20 - 30 years age group (17%) than others.
Majority of the respondents (28.6%) in the age group of 31 - 40 years opined that buying processed food would save considerable time which needs to be devoted in traditional food preparation. Since the female members of households were also frequently engaged in agricultural activities they did not have sufficient time for preparation of food. Hence, most of the time they depended on ready to eat or any other type of convenience food. Subjects who were buying processed foods mainly due to its taste profile were higher in the age group of 20 - 30 years (19.6%), whereas for others it was comparatively low. A very few percentage of subjects reported that they would want to buy processed foods mainly for its convenience. In older age groups the taste quality of processed foods was given least importance. This could be because, during old age food preferences are relatively static and new tastes are not appreciated. Even though they have increased income food preferences would tend to remain within traditional boundaries. Preferences are shown for consuming traditionally prepared foods rather than processed or westernized diets. Younger generation is more attracted towards the purchase and use of processed foods. Further, such products are mainly introduced through a commercial advertisement which targets particular age group. This leads to an increased acceptability of processed foods. Eating habits are learned behaviors and are known to be formed at younger age and are difficult to reverse with advancing age[23].
The global dietary patterns are known to be influenced by a complex web of socio economic trends and various driving forces. People who reside in cities would be performing relatively sedentary occupations often with a high disposable income. In general, a faster economic growth, regulatory liberalization, foreign direct investment and globalization has been considered as the key factor in allowing speedy establishment of fast food and super market sectors. This could be advantageous with respect to employment generation and investment opportunities. Increased manufacturing and availability of foods rich in fat and sugar are considered to have important health implications since more of the processed foods would have a fat content of 30% or more. This might lead to increased prevalence of obesity and other associated disorders[24]. Divergence in dietary pattern is the result of increased economic growth which brings about changes not only in socio economic groups but also across the various age groups.
Purchase Behaviour
Table 3 provides information about alternative sources and places of purchasing processed foods. A proportionately higher percentage (26%) of subjects from 31 - 40 years age group said that they buy another brand if a regular brand was not available. Similar attitude was also prevalent among 20 – 30 years and 51 - 60 years groups. About 13% of the subjects in the age group of 31 - 40 years informed that they go to other shop in search of the regular branded product. Whereas among other age groups this trend was observed to be less prevalent. Ten percent of the subjects in the age group of 20 - 30 years said that they postpone the purchase if the product is not available. Subjects who were purchasing processed foods from a locally available shop were about 32.4% in the age group of 31 - 40 years. Subjects who use to travel to a town grocery shop were observed to be extremely low which ranged from 0.8 - 2.6%.
Table 3: Alternative Sources for Purchasing Processed Foods (Number of subjects).
| Sources | Age (years) | |||
|---|---|---|---|---|
| 20-30 | 31-40 | 41-50 | 51-60 | |
| Buying another brand | 55(11) | 130 (26) | 122 (24.4) | 65(13) |
| Go to other shop | 15 (3) | 65(13) | 20(4) | 12(2.4) |
| Postpone the purchase | 10(2) | 3(0.6) | 2(0.4) | 1(0.2) |
| X² | 0.000*** | |||
| Places of purchasing processed foods | ||||
| Locally available shop | 129(25.8) | 162(32.4) | 103(20.6) | 75(15) |
| Town grocery shop | 13 (2.6) | 7(1.4) | 7(1.4) | 4(0.8) |
| X² | 0.315NS | |||
Food Frequency
The food frequency data of subjects computed as average intake per day is given in Table 4 and a brief description of foods in provided as a footnote, since many foods are typically of Indian origin. The foods were divided as ‘Chat’ items [‘Chats’ are varieties of highly spiced local snacks sold by street vendors], Chinese food, Beverages, Fried foods, Bakery items and processed cereals. The results revealed that, among the Chat items ‘Churmuri’ was consumed more frequently followed by ‘Pani-Poori’. ‘Masala-poori’ which were consumed at a lesser frequency. Among Chinese food, use of noodles was very common. Others such as ‘Gobhi manchoorian’ and fried rice were eaten at lesser frequencies. Beverages like coffee and tea were reported to be used by almost all the subjects. Cola beverages were rarely used by the study subjects. Cereal snacks like puffed rice was also shown to be commonly used by large number of subjects. Fried foods such as ‘Kharasev’ indicated the highest consumption rate followed by ‘vada’, chips and ‘bajji’. ‘Kodubale’ and ‘chakli’ which were used in moderation. Among the bakery products only bread and bun were used by almost all the subjects. Puffs, rusk and cake fell in the average use category.
Table 4: Food Frequency Categorized as Mean Number of Subjects Using Daily.
| Type of processed food | Average intake | Type of processed food | Average intake |
|---|---|---|---|
| Chat items | Fried foods | ||
| Masala puri | 66.3 | Kharasev | 375.5 |
| Churmuri | 223.6 | Kodubale | 160.1 |
| Panipoori | 213 | Chakli | 130.7 |
| Chinese food | Bajji | 267.7 | |
| Noodles | 253.5 | Bonda | 235.8 |
| Gobi manchoorian | 58.03 | Vada | 291.8 |
| Fried rice | 93.3 | Chips | 287.6 |
| Beverages | Bakery Items | ||
| Coffee | 406.5 | Puffs | 29.8 |
| Tea | 403.7 | Cake | 66.2 |
| Cola beverages | 51 | Bread | 306 |
| Fruit beverages | 246.3 | Rusk | 36 |
| Cereal snack | Bun | 308.3 | |
| Puffed rice | 400.6 | - | - |
| Description of ethnic snacks | |||
| Masala puri | Fried small wheat poories eaten with finely cut tomatoes, onions and spiced chutneys | ||
| Churmuri | Puffed rice eaten with finely cut tomatoes, onions, fresh coriander, roasted peanuts and spiced chutneys | ||
| Panipoori | Fried small wheat poories stuffed with boiled potatoes and eaten with finely cut tomatoes, onions and spiced water | ||
| Gobi manchoorian | Fried cauliflower seasoned with highly spiced onions, ginger, garlic and soy sauce | ||
| Kharasev | Deep fried extruded snack prepared with chick pea flour | ||
| Kodubale | Deep fried snack prepared with rice flour, coconut and spices | ||
| Chakli | Deep fried extruded snack prepared with rice and black gram flour, and spices | ||
| Bajji | Deep fried vegetables dipped in chick pea flour | ||
| Bonda | Boiled spiced potato balls dipped in chick pea flour batter and deep fried. | ||
| Vada | Deep fried savory snack prepared with soaked and ground decorticated legumes. | ||
The frequency of eating outside food is depicted in Figure 1. As can be seen from the graph, daily consumption of outside food was found to be comparatively higher among 20-30 years group (11.4%). Between 31 - 40 years and 41 - 50 years, equal percentage of individuals was found to consume outside food on daily basis. For 50 - 60 years group, relatively few individuals were reported to consume on daily basis (4.2%). Individuals who reported to consume processed foods on weekly (14.6%), monthly (3.2%) and fortnightly basis (6%) were higher among 41 - 50 years group in comparison to other age group. For 20 - 30, 31 - 40 and 51 - 60 years group, the various frequencies for consumption of processed foods were similar.
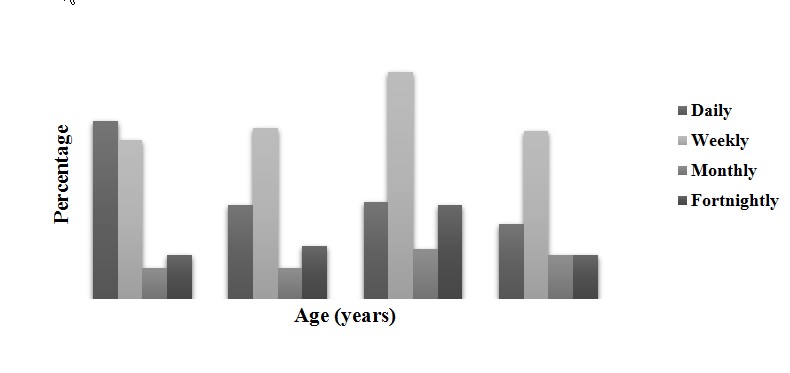
Figure 1: Frequency of eating outside food
Data pertaining to the consumption of fast food among Indians is scarce. Goyal and Singh[25] undertook a study to explore the food preferences of young adults. The results revealed that all subjects preferred home cooked food over fast food. Occasional visits to fast food establishments were also reported. The reason being to have fun, to have change in the environment and for socializing purposes. Another study was by Farhana and Islam[26] who surveyed 106 Bangladeshi’s to evaluate the trends of fast food consumption and various factors which are considered while eating in fast food establishments. The results indicated that consumers had a higher preference for buying lunch or mid-day snack at a western style fast food restaurant. The respondents reported that, they consider cost, mood of the restaurant, variety in menu, convenience and location as the governing factors for buying fast food. In a recent report on Global Nutrition by IFRI, on analysis of food consumption pattern by food typology, the change in processed food retail sales by food system types for savory products alone was said to be 10% between 200 - 2014 for rural populations [data derived from India and Indonesia]. The other changes reported were an increase of 6% in all packaged foods, 3% for bakery products and 8% for dried processed products. This data is very significant and supported our results where an increase in consumption of processed foods was observed even in rural population[27].
A cross sectional study was conducted in Chandigarh by Aloia, et al.[28] to estimate the differences in fast food consumption among Indian adults (35 - 65 years) who belonged to high and low income group. The study also aimed to explore whether income difference has any impact on the patronage of fast food consumption and their perception. The results showed a significant association between income and whether or not people enjoy eating a fast food (p = 0.0002). Participants from higher income group were reported to prefer eating at fast food restaurants compared to participants from low income group. Frequency of eating outside showed that, participants of high income group reported a more frequent consumption of breakfast, lunch and dinner than that of low income participants (5.9 Vs. 2.3 times). More frequent visits to larger restaurants were also noted among participants from high income group (3.5 Vs. 1.4 times/year). On the contrary low income participants were reported to buy food from street vendors compared to high income participants (6.5 versus 2.7 times/year). Hence, income can be considered as one of the major factor determining the place of choice for eating.
Details about the commonly purchased processed foods is presented in Figure 2. As evident from the table, a highest percentage of individuals i.e. 27.6 and 18.4% between 20 - 30 and 31 - 40 years of age reported purchasing various types of biscuits which were available in economy packs. Just about 1 and 2% of individuals in the age group of 41 - 50 and 51 - 60 years purchased fruit juices. Purchasing of both potato chips and ice-cream was markedly higher for subjects in the age group of 20 - 30 years (13.6% and 7%), whereas for other age groups the trend of purchasing these products was relatively low.
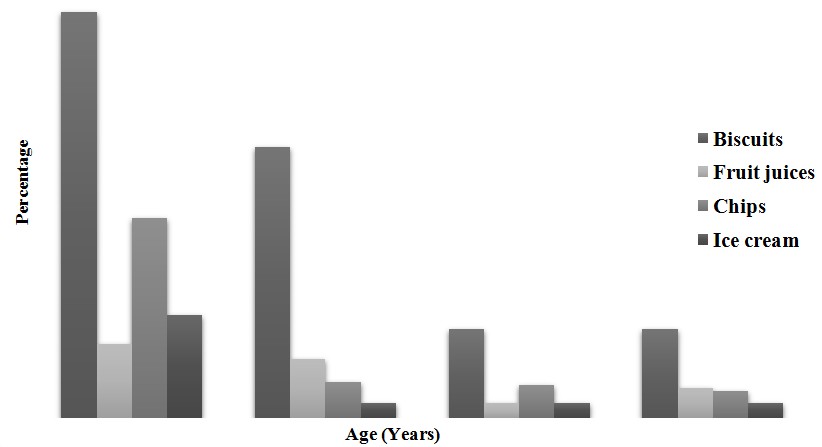
Figure 2: Commonly purchased processed foods
Conclusion
The study results reveal that a majority of respondents purchased processed foods. The types of foods purchased were both branded and packaged products from organized sector and ready to eat snack items from street vendors. Despite low income, the frequency of dependence on outside foods was very high. Most of the purchased products belonged to categories of energy rich spicy snacks. It can be concluded that even in rural population, transition from home cooked traditional meals to processed foods was evident, which could compromise the nutrient intakes.
Funding: The authors received no funding for this research.
Conflict of interest
Authors have no conflict of interest with anyone regarding research reported in this paper.
References
- 1. Shetty, P.S. Nutrition transition in India.(2002)Public Health Nutr 5(1A): 175-182.
- 2. Atibudhi, H.N. A comparative analysis of food consumption and monthly per capita expenditure of Orissa vis-a-vis all India level. (2006) IndJn ofAgri Econ 61(3): 309-316.
- 3. Giri, A.K. Cereal Consumption over time in the country and across the states. (2006) IndJnof Agri Econ 61(3): 389-398.
- 4. Golait, R, Pradhan, N.C. Changing food consumption pattern in rural India: Implication on food and nutrition security. (2006) IndJn ofAgri Econ 61(3): 375-388.
- 5. Nasurudeen, P., Kuruvila, A., Sendhil, R., et al. The dynamics and inequality of nutrient consumption in India. (2006) IndJnAgri Econ 61(3): 362-373.
- 6. Radhakrishna, R. Food Consumption and Nutritional Status in India: Emerging Trends and Perspectives. (2006) WP: 1-18.
- 7. Gupta, A., Mishra, D.K. Poverty and calorie deprivation across socio-economic groups in rural India: a disaggregated analysis. (2013) J RegDevt Plan 2(1): 15-33.
- 8. Deshmukh-Taskar, P., Nicklas, T.A., Yang, S.J., et al. Does food group consumption vary by differences in socioeconomic, demographic, and lifestyle factors in young adults? The Bogalusa Heart Study. (2007) JADA 107(2): 223-234.
- 9. Groth, M.V., Fajt, S., Brøndsted, L. Social determinants of dietary habits in Denmark. (2001) Euro J Clin Nut 55(11): 959–966.
- 10. Neumark-Sztainer, D.N., Story, M., Resnick, M.D., et al. Correlates of Inadequate Fruit and Vegetable Consumption among Adolescents. (1996) Prev Med 25(5): 497-505.
- 11. Ruel, M.T., Minot, N., Smith, L. Patterns and determinants of fruits and vegetable consumption in Sub Saharan Africa: a multi-country comparison. (2004) International Food Policy Research Institute 3-41.
- 12. Yang, X., Hsu-Hage, B.H.H., Tian, H., et al. The role of income and education in food consumption and nutrient intake in a Chinese population. (1998) Asia Pacific J ClinNutr 7(3): 217-223.
- 13. Popkin, B.M., Horton, S., Kim, S. The Nutritional Transition and Diet-related Chronic Diseases in Asia: Implications for Prevention. (2001) Food Consumption and Nutrition Division Discussion, International Food Policy Research Institute 3-12.
- 14. Ali, J. Structural Changes in Food Consumption and Nutritional Intake from Livestock Products in India. (2007) South Asia Res 27(2): 137-151.
- 15. Popkin, B.M. Nutrition in transition: the changing global nutrition challenge. (2001) Asia Pac J ClinNutr 10: S13–S18.
- 16. Tiwari, P., Sankhala, A. Prevalence of obesity, weight perception and dietary behaviour of urban college going girls. (2007) J Hum Ecol 21(3): 181-183.
- 17. Lyngdoh, T., Kinra, S., Shlomo, Y.B. Sib-recruitment for studying migration and its impact on obesity and diabetes. (2006). Emerg Themes Epidemiol 3:2.
- 18. Pysarchik, D., Chung, J., Plank, L. Western style prepared foods blaze trail in Indian market. (1999) Marketing News 33(17):14.
- 19. Bullis, D. Selling to India’s consumer market. (1997) Quorum books 145-210.
- 20. Prystay, C., Sanjay, K. Asia bites back. (1997) Asian Business 33(1): 58-60.
- 21. Hirschman, E. Innovationess, novelty seeking and consumer creativity. (1980) J Cons Res 7(3): 283-295.
- 22. Bowman, S.A. A comparison of the socioeconomic characteristics, dietary practices and health status of women food shoppers with different food price attitudes. (2006) Nut Res 26(7): 318-324.
- 23. Creative strategy and development. (2002) Food Standards Agency 4-7
- 24. Kennedy, G, Nantel, G, Shetty P. Globalization of food systems in developing countries: a synthesis of country case studies. (2004)Food and Nutrition Paper-83 1-24.
- 25. Goyal, A., Singh, N.P. Consumer perception about fast food in India: an exploratory study. (2007) Brit Food J 109(2): 182-195.
- 26. Farhana, N., Islam, S. Exploring consumer behavior in the context of fat food industry in Dhaka city. (2011) J Soc Sc 1(1): 107-124.
- 27. Nugent, R., Levin, C., Grafton, D., et al. Indicators for nutrition friendly and sustainable food systems. (2015) Global Nutrition Report, International Food Policy Research Institute
- 28. Aloia, C.R., Gasevic, D., Yusuf, S., et al. Differences in perceptions and fast food eating behaviours between Indians living in high and low income neighborhoods of Chandigarh, India. (2013) Nutr Journal 12(4): 1-9.


