
Cranberry Quercetin-3-Galactoside in Postprandial Human Plasma
Ajay P Singh2,3, Nicholi Vorsa2,3 and Ted Wilson1*
Affiliation
- 1Department of Biology, Winona State University, Winona, MN, USA
- 2Philip E. Marucci Center for Blueberry and Cranberry Research and Extension, Rutgers-The State University of New Jersey, 125A Lake Oswego Rd., Chatsworth, NJ, 08019, USA
- 3Department of Plant Biology and Pathology, Rutgers-The State University of New Jersey ,59 Dudley Road, New Brunswick, NJ, 08901, USA
Corresponding Author
Ted Wilson, Department of Biology, 232 Pasteur Hall, Winona State University, Winona, MN 55987; Phone: 507-457-2485; Fax: 507-457-2599; E-mail: twilson@winona.edu
Citation
Wilson, T. et al. Cranberry Quercetin-3-Galactoside in Postprandial Human Plasma (2014) Int J Food Nutr Sci 1(1): 17-19.
Copy rights
© 2014 Ted Wilson. This is an Open access article distributed under the terms of Creative Commons Attribution 4.0 International License.
Abstract
Flavonoid glycoside bioavailability may be important for determining the health benefits of cranberry consumption. Human quercetin-3-galactoside bioavailability of raw cranberries (RC; 55g), sweetened dried cranberries(SDC; 40g) and sweetened dried cranberries containing less sugar (SDCLS; 40g) was measured using a liquid chromatography-mass spectrometry system before consumption and for 240 minutes postprandially. Peak plasma concentrations (ng/ml) for RV, SDC and SDCLS were 15.5 ± 3.0, 14.0 ± 2.9, and 9.8 ± 2.9, with observed peak times of 60, 60 and 120 minutes respectively. This study suggests that quercetin-3-galactoside in the blood stream could be used as a phenolic marker of cranberry consumption.
Introduction
Phenolic compounds unique to the cranberry may be beneficial for reducing urinary tract infections[1], providing antioxidant protection[2,3], improving the lipid profile[4,5], and improving vasodilation to reduce cardiovascular disease (CVD) risk[6]. Our previous study[7] determined that sweetened dried cranberries (SDC)s and SDCs with less sugar (SDCLS) produced using polydextrose to reduce the sugar and caloric content may have a glycemic profile making them useful for improving fruit consumption by type 2 diabetics. Our recent metabolic study in mice suggests that cranberry flavonoids may be responsible for adiponectin-AMPK beneficial health effects (Shabrova et al, 2011).
Sweetened dried cranberries, SDCLS, and RC have phenolic profiles that are rich in several flavonols especially quercetin-3-galactoside (Q-3-gal) (Figure 1), anthocyanidins, and A-type PACs (e.g. epicatech in dimers and trimers) in our previous studies[7,8], however the human postprandial bioavailability of Q-3-gal from either product has not been explored. Glycosidic flavonoids such as Q-3-gal could be responsible for cranberry health benefits and the presence of Q-3-gal in human blood could be an excellent marker for validating cranberry consumption. This study represents a follow-up of our previous study of glycemic response in human type 2 diabetics who consumed SDC, low calorie-SDC, raw cranberries or white bread in single-cross-over fashion[7]. The present study determined that following cranberry consumption, Q-3-gal is effectively absorbed into the blood plasma reaching peak concentrations within 90 minutes or less.
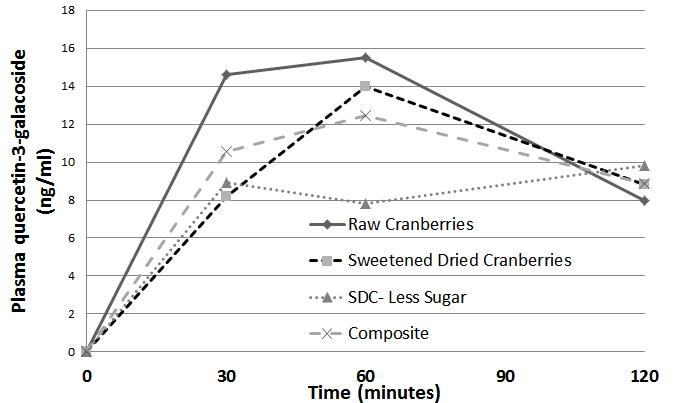
Figure 1: Appearance of quercetin-3-galactoside in the plasma of human diabetics following consumption of raw cranberries (55g; 21 Cal), sweetened dried cranberries (40g, 138 Cal), or low sugar sweetened dried cranberries (40g; 113 Cal).
Materials and Methods
Subjects and study design
The subject population and study design has been described in greater detail previously (Wilson et al 2010). The Winona State University Institutional Review Board approved the study prior to recruitment of non-insulin dependent type-2 diabetics (six female and seven male), 61.6 ± 2.3 yrs old, withHbA1C values of 6.25 ± 0.16 and a BMI of 33.25 ± 1.22. In single cross-over fashion on alternate weeks subjects received RC (55g; 21 Cal; 1 g fiber) that were stored frozen and thawed just before use; SDC (40g, 138 Cal; 2.1g fiber), SDC with less added sugar (SDC-LS; 40g; 113 Cal; 1.8g fiber + 10g polydextrose) or white bread as a control (57g; 160 Cal; 1 g fiber; Sara Lee Soft & Smooth Classic White, Downers Grove, Illinois, USA). The cranberry products used in this study were obtained from Ocean Spray Inc. Lakeville-Middleboro, MA, USA.
Prior to laboratory presentation, subjects completed a 10-hour fast from all food and beverages except water prior to each weekly laboratory visit. Upon arrival in the lab subjects sat quietly for 30 minutes prior to study initiation before a baseline-fasting venous blood sample was collected (0-minutes). Treatments were then consumed within five minutes and additional blood collections repeated 30, 60 and 120 minutes. Subjects returned to the laboratory on a weekly basis until each subject had completed each of the four treatments. Subjects agreed to consume no cranberry or blueberry containing products, fruits, onions, or chocolate to reduce the effect of background dietary phenolics during the course of the study.
Collected plasma samples were frozen at -80°C until analysis in single blind fashion on a single day using freshly thawed samples. Separation and quantification of flavonols were performed on RSLC (Dionex Corporation) ESI-MS-MS conditions: Mass Spectrometer: API-3000 triple quadrupole (Applied Biosystems). Ion source: ESI in negative and positive ion mode; m/z range: 50 to 1200; source temperature: 350°C. Mobile phase: Eluent A: 90 % water + 10 % methanol + 0.001 % formic acid; Eluent B: 20 % water + 20 % methanol + 60 % ACN + 0.001 % formic acid. Flow rate: 0.25 ml min-1 and injection volume: 5μl for LC-MS-MS. Column: Pursuit C18 (3 μm particle size; 150 mm length x 3.0 mm ID; Varian). LC-MS-MS in MRM mode were used to identify and quantify the plasma flavonols.
Statistical analysis
Data was analyzed using the SASS program (SAS Inst. Inc., Cary, N.C., U.S.A.): Plasma Q-3-gal (ng/ml) is expressed as least squared means ± standard error. SASS was used to generate calculated predicted peak plasma Q-3-gal times for each subject and the trapezoidal method was used to calculate area under the curve (AUC) values. A repeated measures analysis of variance was used to identify significant differences among treatments, among time points, and the interaction between treatment and time. Significant differences among least squares means (P < 0.05) were determined using the Tukey-Kramer adjustment.
Results and Discussion
Cranberry Q-3-gal was absorbed from the gut and appeared in blood plasma 30 minute post-prandially in all subjects with a calculated plasma peak occurring at one hour for raw cranberries and SDCs and at one and half hours for SDCs containing less sugar (Table 1a & 1b). Peak plasma concentrations of Q-3-gal were 15.5 ± 3.0, 14.0 ± 2.9, and 9.8 ± 2.9 ng/ml for raw cranberries, SDC and SDC-LS. Plasma Q-3-gal was statistically higher than baseline at 30, 60 and 120 minutes, but no statistically significant differences between the three cranberry treatments were observed at 30, 60 or 120 minutes. The reduced AUC for SDC-LS was less than that of raw cranberries or SDC, although the difference was not statically significant. SDC actually contained less G-3-gal than SDC-LS[7], this difference was not statistically significant. SDC-LS contained polydextrose fiber which could have slowed gastric emptying and contributed to the slight difference[9].
Table 1(a): Nutritional content of glycemic challenges
| White Bread | Raw Cranberry | Sweetened Dried Cranberry | SDC- Less Sugar | |
|---|---|---|---|---|
| Serving Size | 57g | 55g | 40g | 40g |
| Total (Cal) | 160.0 | 21.0 | 138.0 | 113.2 |
| Protein (Cal) | 20.0 | 0.6 | 0.4 | 0.6 |
| Fat (Cal) | 20.0 | 0.4 | 2.7 | 2.5 |
| Carbohydrates (Cal) | 120.0 | 20.0 | 134.9 | 100.0 |
| Polydextrose (g or Cal) | 0 | 0 | 0 | 10.1 |
| Total Dietary Fiber (g) | 1.0 | 1.2 | 2.2 | 11.3 |
Table 1(b): Pharmacokinetics of cranberry plasma quercetin-3-galactosidefollowing consumption by human type 2 diabetics (Least Mean Squares ± Standard Error).
| Treatment | Plasma Quercetin-3-Galactoside (ng/ml) | Calculated Peak Time | Final Mean Body Weight (g) | |||
|---|---|---|---|---|---|---|
| 0-minutes | 30-minutes | 60-minutes | 120-minutes | minutes | ||
| Raw Cranberries | 0.0 ± 3.0 | 14.6 ± 3.0* | 15.5 ± 3.0* | 8.0 ± 3.1* | 57 ± 13 | 1388 ± 280 |
| Sweetened Dried Cranberries | 0.0 ± 2.9 | 8.2 ± 3.1* | 14.0 ± 2.9* | 8.8 ± 2.9* | 60 ± 13 | 1254 ± 280 |
| SDC-less sugar | 0 ± 2.8 | 8.9 ± 3.0* | 7.8 ± 2.8* | 9.8 ± 2.9* | 88 ± 12 | 792 ± 281 |
| White Bread | 0 | 0 | 0 | 0 | 0 | 0 |
| *Statistically significant vs 0-minutes within group (P < 0.05) | ||||||
It has been suggested that quercetin glucosides are largely hydrolyzed prior to absorption in the intestine[10]. Our observations and those of others have observed that Q-3-gal is indeed absorbed into the blood from the intestine. The peak plasma Q-3-gal concentration of 8.2 to 15.5 ng/ml was comparable with that associated with robust in vitro protection of LDL from oxidation in our previous study of cranberry products[8]. We have also observed that Q-3-gal may accumulate in mouse tissues at levels far higher than that observe in the plasma (Shabrova et al, 2011).
Biological relevance of glycosidic flavoinins in the nanomolar concentration range, Urine excretion and UTI potential, Q-3-gal and other glycosidic flavonoids has possible factors responsible for UTI and other health benefits.
When I run some comparative math looking at Q-3-gal loads in the four treatments I get some funky numbers based on our Antioxidant manuscript (2009) and our Diabetic JFS manuscript (2010):
In the Diabetes manuscript, Eurofinns used a vacuum oven to calculate the percent moisture of raw CB, SDC and SDC-LS at 86.6%, 14.5% and 11% respectively.
From the 2010 diabetes manuscript-only publication with SDC phenolic measurements (no standard deviations)
SDC: 14.5% moisture so 40 grams is 34.2 g dry wt, at 605 ug/ gdrywt = 20.7 mg Q3g load
SDC-LS: 11% moisture, so 40 grams is 35.6 g dry wt, at 732 ug/g drywt = 26.1 mg Q3g load
For raw cranberry Q-3-gal content from our antioxidant manuscript in Food Chem
This would put the raw cranberry Q-3-gal load at just 13.4 g dry wt X 100ug/g drywt = 1340 ug load or 1.34 mg of q-3-gal. I think it might be tough to convince someone that raw cranberries had a peak Q-3-gal that was similar (maybe higher) than SDC and SDC-LS (Table 2) even though the raw cranberries had 1/10 the load of q-3-gal.
Table 2: Flavonol content of sweetened dried cranberries
| Name of compound | λmax(nm) | [M-H]- fragments in ESI-MS-MS | Sweetened Dried Cranberry(μg/g) | SDC–Less Sugar (μg/g) |
|---|---|---|---|---|
| 3-caffeoylquinic acid | 218.4, 236.0, 293.3, 316.6 | 353, 191, 178.9, 127, 111 | 46 | 50 |
| 5-caffeoylquinic acida,b,c | 217.2, 241.9, 297.68, 326.1 | 353, 191, 178.9, 127, 111 | 1046 | 1290 |
| 4-caffeoylquinic acida,b,c | 217.8, 242.9, 297.1, 327.1 | 353, 191, 173.1, 127, 111 | 321 | 335 |
| Myricetin-3-galactosidea,b,c | 200, 251, 351 | 479, 317 | 235 | 262 |
| Quercetin-3-galactosidea,b,c | 203, 254, 351 | 463, 301 | 605 | 732 |
| Quercetin-3-arabinopyranosidea,b,c | 204, 253, 355 | 433, 301 | 103 | 132 |
| Quercetin-3-arabinofuranosidea,b,c | 204, 253, 355 | 433, 301 | 73 | 96 |
| Quercetin-3-rhamnosidea,b,c | 204, 253, 355 | 447, 301 | 658 | 807 |
| Quercetina,b,c | 207, 266, 357 | 301, 151 | 74 | 94 |
| Quercetin-3-benzoylgalactosidea,b,c | 207, 266, 357 | 567, 301 | 38 | 47 |
aBased on full scan and product ion scan
bBased on Singh and others 2009
bBased on Wilson and others 2009.
Conclusion
This is the first human metabolic study to demonstrate that cranberry Q-3-gal can be absorbed from the human gut with a peak plasma concentration reached in one to one and a half hours depending on the cranberry product. While raw cranberries and SDCs are popular with consumers, the bulk of cranberry consumption comes in the form of cranberry juice. Future studies are needed to characterize cranberry juice Q-3-gal pharmacokinetics in the period after 120 minutes in order to better understand how this glycosidic flavonoid may be responsible for the human health benefits of cranberry product consumption.
Acknowledgements
This study was funded by an unrestricted grant from Ocean Spray Cranberries Inc. and the Winona State University Office of Academic Affairs and statistical support from Tisha L. Hooks, Winona State University Statistical Consulting Center. The authors are grateful to Graham Gibson (Applied Biosystems) for the gift of the API-3000 LC-MS-MS instrument used for phenolic analysis.
References
- 1. Avorn, J., Monanane, M., Gurtitz, J.H., et al. Reduction of bacteriuria and pyruria after ingestion of cranberry juice. (1994) JAMA 271(10): 751-754.
- 2. Wilson, T., Porcari, J.P., Harbin, D. Cranberry extract inhibits low density lipoprotein oxidation. (1998) Life Sci 62(24): 381-186.
- 3. Wilson, T., Porcari, J.P., Maher, M.A. Cranberry juice inhibits metal- and non-metal initiated oxidation of low density lipoprotein. (1999) J Med Food 2(2): 5-14.
- 4. Abdul-Ghani, M., DeFronzo, R.A. Fasting hyperglycemia impairs glucose- but not insulin-mediated suppression of glucagon secretion. (2007) J Clin Endocrinol Metab 92(5): 1778-1784.
- 5. Accurso, A., Bernstein, R.K., Dahlqvist, A., et al. Dietary carbohydrate restriction in type 2 diabetes mellitus and metabolis syndrome: time for a critical appraisal. (2008) Nutr Metab (Lond) 5: 9.
- 6. American Diabetes Association. Standards of medical care in diabetes-2006. (2006) Diabetes Care 29: S4-42.
- 7. Auerbach, M.H., Craig, S.A., Howlett, J.F., et al. Caloric availability of polydextrose. (2007) Nutr Rev 65(12): 544-549.
- 8. Bonnefont-Rousselot, D., Bastard, D., Jaudon, M.C. Consequences of the diabetic status on the oxidant/antioxidant status. (2000) Diabet Metab 26: 163-176.
- 9. Booth, G.L., Fung, K., Kapral, M.K., et al. Recent trends in cardiovascular complications among men and women with and without diabetes. (2006) Diabetes Care 29(1): 32-37.
- 10. Boyer, J., Brown, D., Liu, R.H. Uptake of quercetin and quercetin 3-glucoside from whole onion and apple peel extracts by Caco-2 cell monolayers. (2004) J Agric Food Chem 52(23): 7172-7179.


