
CuO nanoparticles synthesis and characterization for humiditysensor application
K. Jhansi1, S. Chandralingam1, N. Manohar Reddy2, Padma Suvarna3, Ch. Ashok4, K. Venkateswara Rao4*
Affiliation
- 1Department of Physics, Jawaharlal Nehru Technological University College of Engineering Hyderabad, Kukatpally, Hyderabad, Telangana-500085, India
- 2Department of S Science & Humanities, Sri Venkateswara College of Engineering, Tirupathi
- 3Department of Physics, JNTU College of Engineering, Ananthapuramu
- 4Centre for Nano Science and Technology, Institute of Science and Technology, Jawaharlal Nehru Technological University Hyderabad, Kukatpally, Telangana-500085, India
Corresponding Author
Dr. K. Venkateswara Rao, Associate Professor of Nanotechnology & ACE, Centre for NanoScience and Technology, Institute of Science and Technology, Jawaharlal Nehru Technological University Hyderabad, Kukatpally, Hyderabad-500085, Telangana, India, Tel: +91-9440858664; E-mail: kalagadda2003@gmail.com
Citation
Venkateswara, R.K., et al. CuO nanoparticles Synthesis and Characterization for Humidity Sensor Application. (2016) J Nanotech Mater Sci 3(1): 10- 14.
Copy rights
© 2016 Venkateswara, R.K This is an Open access article distributed under the terms of Creative Commons Attribution 4.0 International License.
Keywords
CuO nanoparticles; Humidity sensing; XRD; SEM; TEM; TGDTA
Abstract
Copper oxide nanoparticles were prepared by chemical combustion and co-precipitation method and observed the humidity sensing property. The CuO nanoparticles were characterized under X-Ray Diffractometer (XRD), Particle Size Analyser (PSA), Thermo Gravimetric And Differential Thermal Analyser (TGDTA), Scanning Electron Microscope (SEM) and Transmission Electron Microscope (TEM). XRD results with JCPDS card numbers confirmed that obtained nanoparticles are CuO nanoparticles and the average crystallite size of CuO nanoparticles are in nano meter range. The weight losses of the sample and phase transformation details were obtained by TGA. SEM images inferred that the nanoparticles are in cubic shape, nearly uniform in size & crystallinity in nature. The humidity sensing property is exhibited by the copper nanoparticles.
Introduction
Nanotechnology is an emerging branch of science that interests in the materials among the size of 1-100 nm with different shapes of spherical nanoparticles, nanorods, nanoribbons, nanobelts and nanoplateletsz[1,2]. Generally the investigations are showing extensive interest towards metal oxide nanomaterials because of their potential use in wide range of applications like optoelectronic, information storage and sensors. CuO nanoparticles material is having high stability, chemical reactivity, photocatalytic activity, low cost and environmental friendly[3]. Due to its high surface to volume ratio comparing with micro or bulk-sized material they have unique physical and chemical properties. Nanotechnology works with materials in the solid state. In the applications of environmental observation like air quality detection, security, defence and health care chemical sensors are playing a very important role thus enhancing the nano structured metal oxide work in this filed where the nanostructures exhibit advanced properties in the area of chemical, magnetic, mechanical, optical, electronic and biomedical owing to its high surface to volume ratio and dimensionality. Nano metal oxides like ZnO, CuO, TiO2, SnO2, WO3 and In2O3 are available[4]. The humidity sensors applications haveattracted the Researchers. Adsorption and desorption caused by the water vapour on the morphology of the sensing element was explained by Debdulal and Kamalendu and Pandey[5-6]. For humidity sensor applications semiconductor nanomaterials are suitable. The available semiconductor materials were ZnO, CuO, TiO2, WO3, SnO2, CdS, GaN, CeO2 and also their composites which are possible like ZnO/TiO2, CuO/TiO2, SnO2/TiO2, CdS/TiO2, ZnO/CuO and so on[1,7-9]. The crucial is the synthesis procedure as it is the main part in controlling the size, shape of the nanostructure and different properties of the material. CuO nanoparticles could be prepared by many ways such as Wet-Chemistry Route[10] Sonochemical Preparation[11], Liquid Hydrolysis[12], Microwave-assisted method[13], Alkoxide based preparation[14], Hydrothermal Proces[15], Thermal Decomposition[16], Solid-state reaction in the presence of a surfactant[17,18] etc. Among all those synthesis methods, chemical co-precipitation method and solution combustion method has several advantages. In case of chemical co-precipitation method – it is low temperature, low cast method and not required any organic solvents in the reaction. In case of solution combustion method – it is easy and fast synthesis method, obtained particles showed that good homogeneity and high purity[19-20].
In the present study, we have synthesized CuO nanoparticles in two methods for the comparative study of copper nanoparticles using Cupric nitrate as oxidizer and Citric acid as fuel in the chemical combustion process and Cupric nitrate and Sodium hydroxide taken as initial precursors in the chemical co-precipitation method. The aim of the present paper is to synthesis andcharacterization of the nanoparticles for the humidity sensor application by hygrometer, sinometer (Digital Multi Meter-VC9808+) and controlled humidity chamber.
Materials and Methods
Experimental Details
The chemicals Cupric nitrate Cu(NO3)2, Sodium hydroxide NaOH and Citric acid C6H8O7 were purchased from Merck with purity 99.9%. The chemicals were used as purchased without further treatment.
Synthesis of copper oxide nanopowder by combustion method
4.3 gm of Cupric nitrate as oxidizer dissolved in 50 ml of distilled water and 2.1 gm of Citric acid as fuel dissolved in 50 ml of distilled water and both are separately magnetically stirred for 1 hour then both the solutions were poured in one beaker and the combined solution was magnetically stirred for 2 hours then the solution was placed in furnace for calcinations at 450°C then by the solution combustion process the Copper oxide nanoparticles were obtained.
Synthesis of copper oxide nanopowder by co-precipitation method
0.5M Cupric nitrate was added to 50 ml of distilled water and the solution was magnetically stirred for 15 min. Sodium Hydroxide solution was added drop wise to the above solution till the solution pH reached 12. The above solution was magnetically stirred for 3 hours till a precipitate brown for CuO was formed. The precipitate was washed by ethanol and distilled water and the precipitate was dried to powder form. The powder was annealed at 450°C for CuO Nanoparticles.
Characterization
X-ray diffractometer
X-ray Diffraction patterns were recorded from 20° to 80° using Cu Kα as the x-ray source (λ = 1.54 Å) using Bruker’s AXS Model D8 Advance System. The crystalline size was determined by Debye –Scherer’s formula. XRD pattern of CuO nanoparticles was as shown in Figure 1. The diffraction peaks were well defined and shown for CuO nanoparticles with JCPDS card number 89 - 5899 showing monoclinic structures. The sharp peaks indicated that the obtained nanoparticles contained high crystallinity nature. The below table showed that the position, d-spacing and miller indices
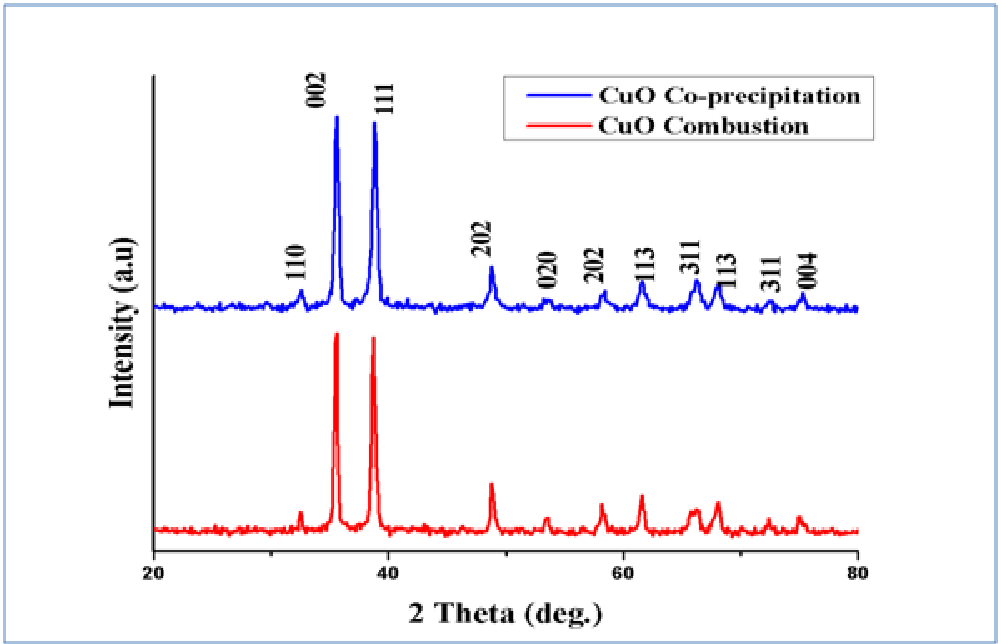
Figure 1: XRD Patterns of CuO nanoparticles.
The obtained results confirmed and showed that the as synthesized CuO nanoparticles were in monoclinic structure. Peaks were observed at 32.5°, 35.5°, 38.7°, 48.8°, 53.4°, 61.5°, 66°, 68°, 72.3° and 75.9° corresponding to the (hkl) values of (-1 1 0), (0 0 2), (1 1 1), (-2 0 2), (0 2 0), (-1 1 3), (-3 1 1), (-2 2 0), (3 1 1) and (-2 2 2) respectively. The lattice parameters were in good agreement with JCPDS card number 45 - 0937, having lattice parameters a = 0.4685 nm, b = 0.3889nm, c = 0.513 nm and angles α = γ = 90° and β = 99.549°.
The crystallite size was calculated from Scherer’s formula[21],
D = 0.94 λ / β cosθ
Where D is the average crystallite size of the particle, λ is the wavelength of the electron beam, β is the full width at half maximum (FWHM) of the peak and θ is the Bragg’s angle of diffraction. The below Table 1 showed that the 2θ position, d-spacing, FWHM and (hkl) values.
Table 1: Position, d-spacing and (hkl) values.
| Position (2θ) | d-spacing | FWHM | (hkl) |
|---|---|---|---|
| 32.52019 | 2.750018 | 0.21781 | (-1 1 0) |
| 35.52722 | 2.523841 | 0.32286 | (0 0 2) |
| 38.71173 | 2.323235 | 0.42435 | (1 1 1) |
| 48.83929 | 1.862528 | 0.39535 | (-2 0 2) |
| 53.47065 | 1.711607 | 0.43071 | (0 2 0) |
| 61.5749 | 1.504333 | 0.41713 | (-1 1 3) |
| 66.06123 | 1.412618 | 0.9399 | (-3 1 1) |
| 68.01412 | 1.376733 | 0.52064 | (-2 2 0) |
| 72.38463 | 1.303985 | 0.20584 | (3 1 1) |
| 75.9 | 1.264588 | 0.4 | (-2 2 2) |
The average crystallite size was measured as 22 nm and 28 nm for combustion method and co precipitation method respectively after the annealing the powder. Due to the agglomeration of the molecules the average crystallite sizes were increased[22].
Particle size analyser
The synthesized CuO nanoparticles were dispersed in ethanol and ultra-sonicated for 15 - 20 minutes separately. The sizes of the agglomerated crystals in the solution were estimated using particle size analyser. The particle distribution in the Particle Size Analyser was shown in Figures 2 and 3. This particle size analyser was working under the principle of Dynamic Light Scattering.
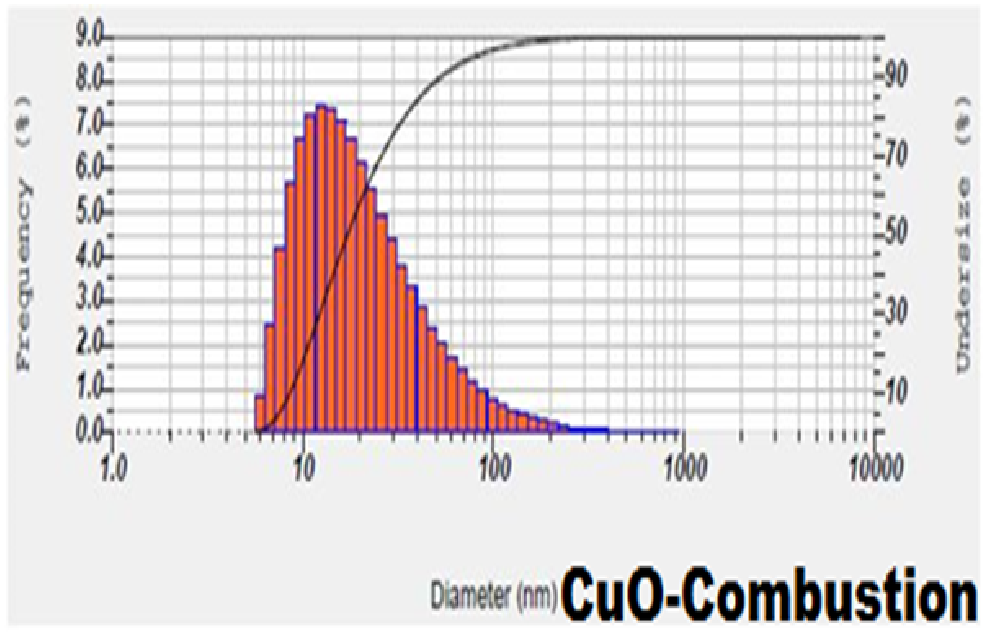
Figure 2: Particle size distribution and average particle Size of CuO nanoparticles by solution combustion method.
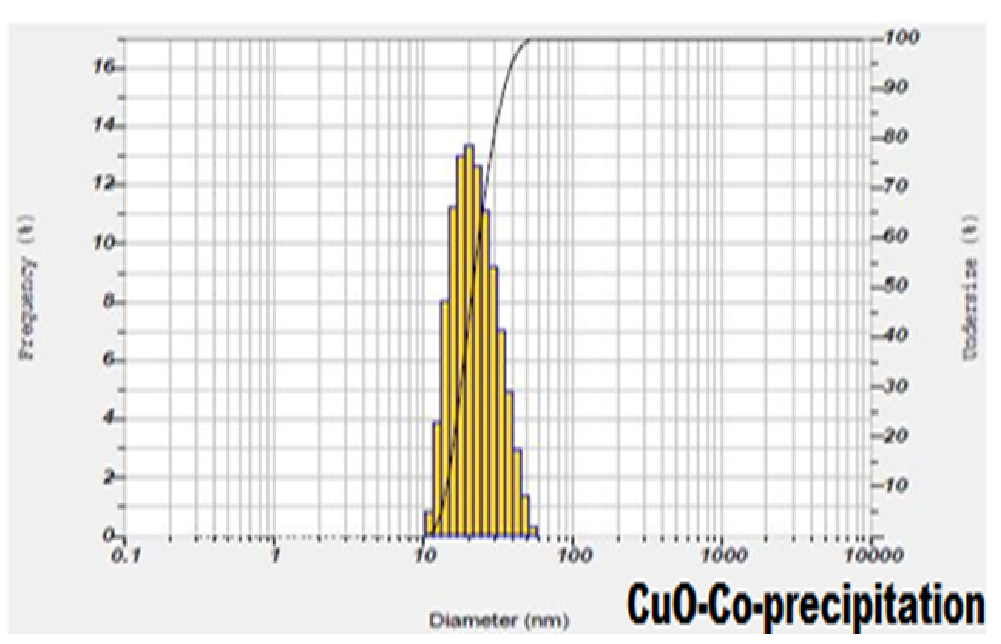
Figure 3: Particle size distribution and average particle Size of CuO nanoparticles synthesized by Co-precipitation method.
Dynamic Light Scattering (DLS)/PSA which is based on the laser diffraction method with multiple scattering techniques was employed to study the average particle size of nanoparticles. From the particle size analyzer we have obtained average(mean) particle size, standard deviation and most commonly found peak in the distribution(mode) for CuO nanoparticles. The observed value of mean, median and mode for CuO nanoparticles had less difference in mean and mode due to the uniform distribution of particles. From the analysis of histograms and average particle size of the samples, we could infer that the results were in coherence with XRD results, the average particle size was comparable to the average crystallite size[23].
Thermo gravimetric analysis
The thermal properties were attained for the sample using TGA and the results were shown in the Figure 4. The TG analysis was observed from room temperature to 800ºC. The weight loss of the sample observed at room temperature to 100ºC due to the evaporation of water molecules, whereas 100ºC to 400ºC the weight loss caused by evaporation of inorganic materials[24]. After 400ºC the weight loss was occurred due to the evaporation of un-reacted materials which was involved in the sample.
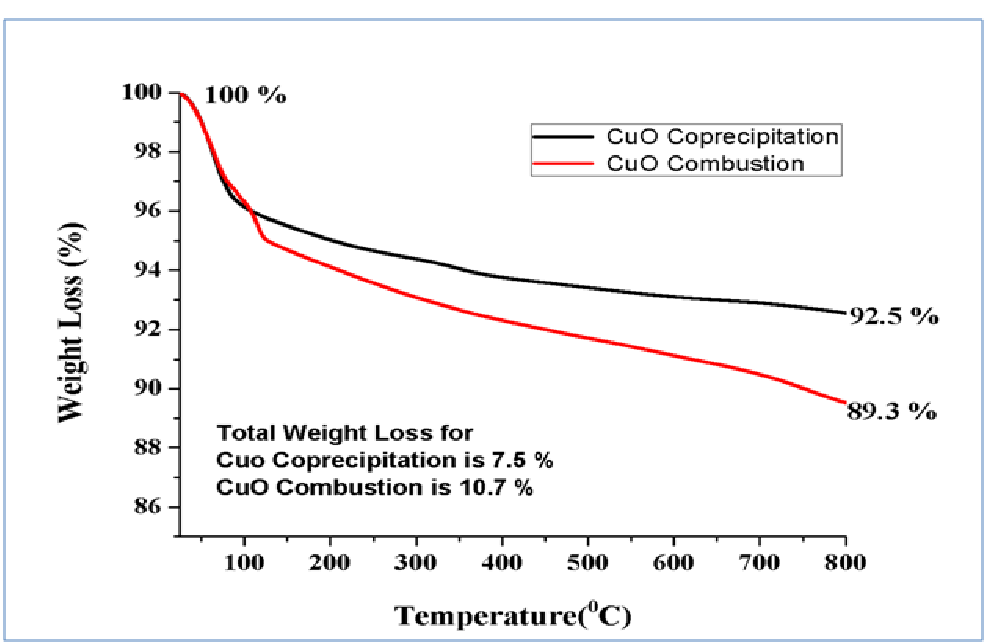
Figure 4: TG curve of CuOnanoparticles.
Scanning electron microscopy
The grain size, shape and surface properties like morphology were observed using SEM. The CuO nano particles were investigated with a magnification of 1 μm, which were clusters of cubic shape, nearly uniform in size & crystallinity in nature which are seen in the Figure 5. From the above SEM images we could infer that the synthesized method is suitable to homogeneity & uniform distribution of CuO nanoparticles is observed.
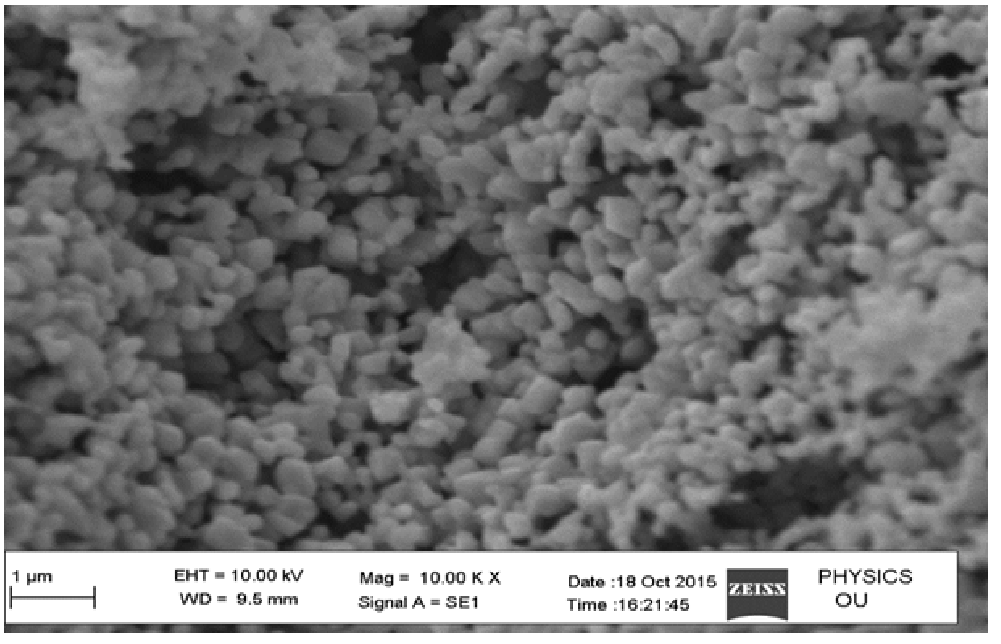
Figure 5: SEM images of CuO nanoparticles by Co-precipitation.
Transmission electron microscopy
Figure 6 showed the TEM micrographs of as synthesized CuO nanoparticles by Co-precipitation. The magnification of TEM is 100 nm. The shape was cubic in nature which was supported by SEM. The average particles sizes were around 30 - 50 nm range and agglomeration can be seen the positions of all diffraction rings/peaks may consist with standard CuO powder diffraction data from JCPDF card and indicates no other phases of CuO could be identified. The crystalline phases and size obtained from TEM matches well with the crystal size from the XRD data when calculated with the Debye-Scherer’s equation.
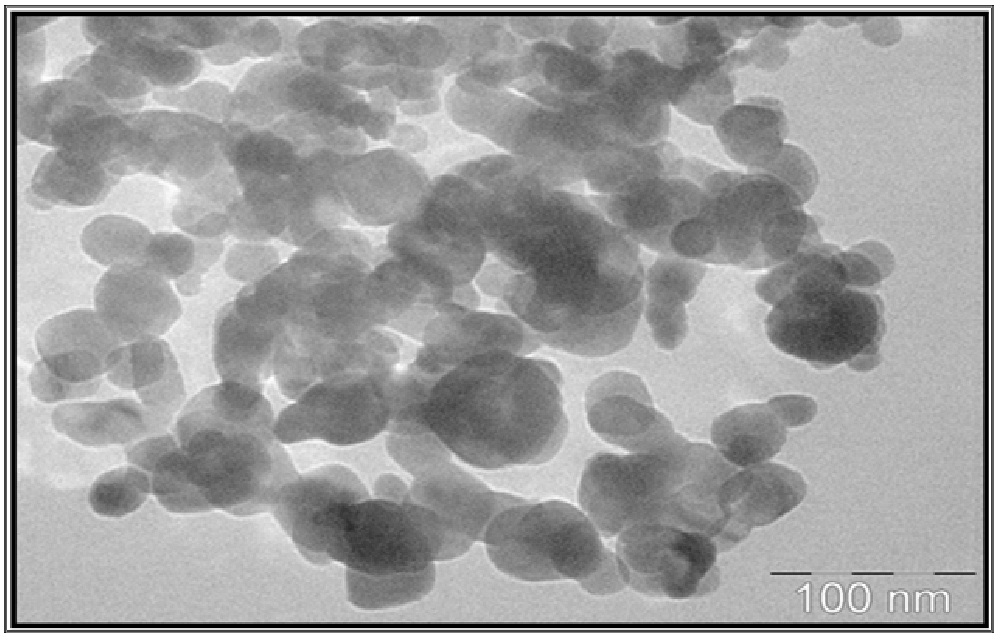
Figure 6: TEM micrographs of CuO nanoparticles.
Humidity sensor application
A change in resistance (ΔR) of a sensing element per unit change in relative humidity (ΔRH) is defined as the Sensitivity (S) of a humidity sensor. CuO nanoparticles were made into pellets and these pellets were placed in between two Cu-electrodes, and the digital multimeter was connected to the edges of the electrodes. This complete set-up was kept in controlled humidity chamber. The resistance studies were measured from RH 10% to RH 95%. The CuO nanoparticles showed the decreased of resistance value as RH% increase in all the cases. The increase of humidity (Presence of water vapour) resulted due to the decrements of resistance of humidity. The resistance value decreased from 780 MΩ to 615 MΩ for RH 10% to 95%. The resistance verses relative humidity (%) values shown in Table 2. The resistance measurement of CuO nanoparticles as a function of relative humidity (%) was shown in Figure 7.
Table 2: Resistance vs. RH (%) and Sensitivity vs. RH (%).
| RH (%) | Resistance (MΩ) | Error (±) (2%) | RH (%) | Sensitivity | Error (±) (2%) | |
|---|---|---|---|---|---|---|
| 10 | 780 | 15.6 | 15 | 0.8 | 0.016 | |
| 20 | 772 | 15.44 | 25 | 1.0 | 0.02 | |
| 30 | 762 | 15.24 | 35 | 1.3 | 0.026 | |
| 40 | 749 | 14.98 | 45 | 1.6 | 0.032 | |
| 50 | 733 | 14.66 | 55 | 1.8 | 0.036 | |
| 60 | 715 | 14.3 | 65 | 2.1 | 0.042 | |
| 70 | 694 | 13.88 | 75 | 2.3 | 0.046 | |
| 80 | 671 | 13.42 | 85 | 2.7 | 0.054 | |
| 90 | 644 | 12.88 | 95 | 2.9 | 0.058 | |
| 95 | 615 | 12.3 | Average | 1.83 |
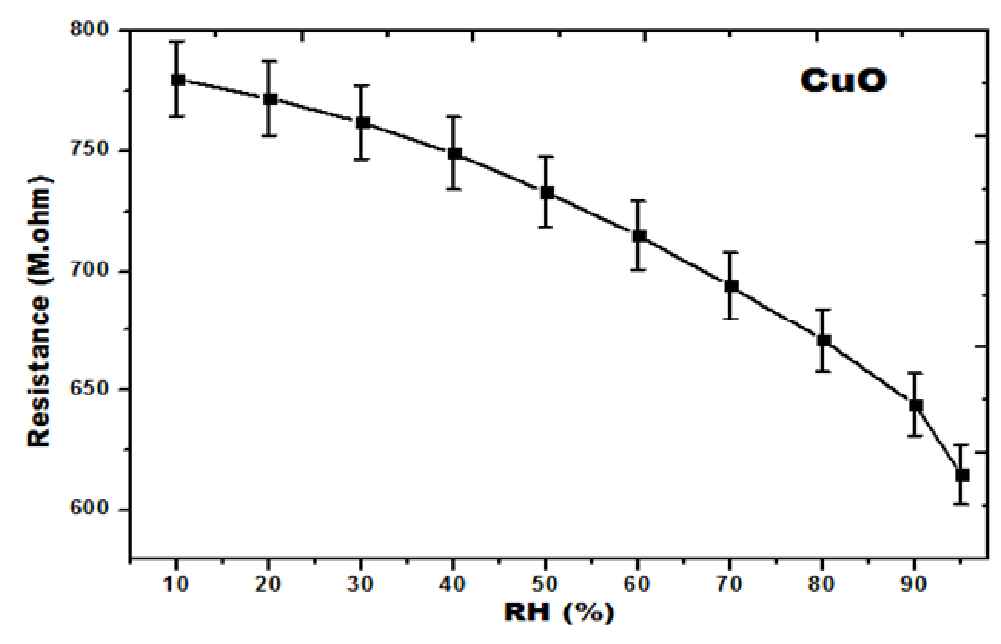
Figure 7: RH (%) vs. Resistance curves of CuO nanoparticles.
Using the formula (S = ΔR / ΔRH) the sensitivity of CuO nanoparticles is calculated. As the RH% increased the sensitivity also increased which is shown in the Table 2. The sensitivity measurement of CuO nanoparticles as a function of relative humidity (RH%) was shown in Figure 8[25]. Due to the high charge density in the sensing material the cations were actively participated in the adsorption. The reason for the increase in electrical conduction and the decrease in resistance was due to the cations eagerly associating with the hydroxyl group of adsorbed water[26].
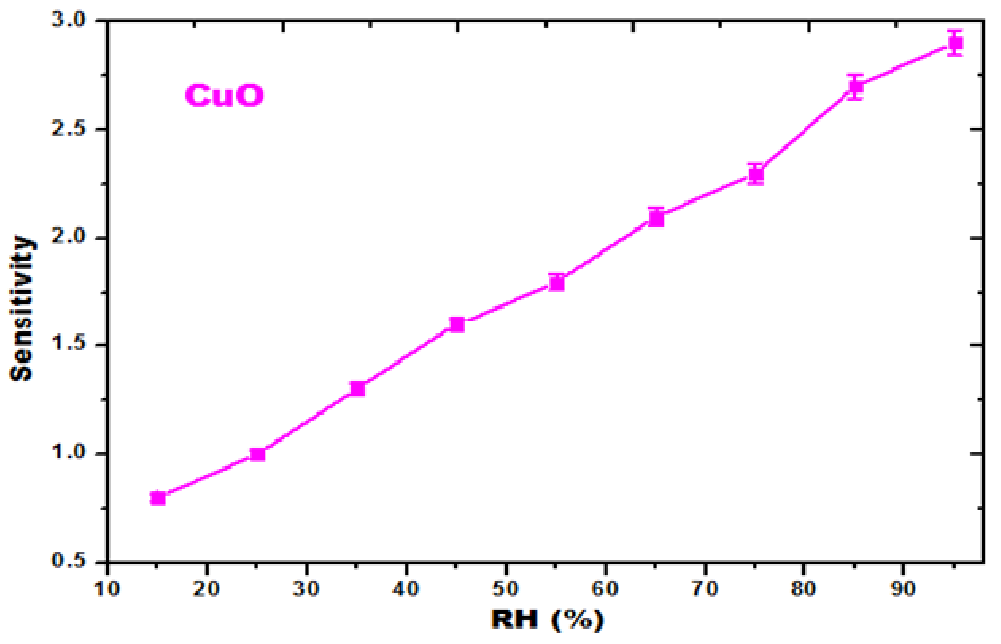
Figure 8: RH (%) vs. Sensitivity curves of CuO nanoparticles
Conclusion
Using Room Temperature Ionic Liquids CuO nanoparticles are successfully prepared by chemical Combustion and co-precipitation method. From the XRD calculations the average crystallite sizes were calculated as 22 nm and 28 nm for combustion and co precipitation methods respectively. The TGA results showed that the nanometal oxides were with low impurities and with lower weight loss indicating the high stability. In the same way the average particle sizes were obtained as 13 nm and 21 nm. SEM and TEM images confirmed that the obtained nanomaterials looked like cubic shape, nearly uniform in size and crystallinity. The sensitivity of the CuO nanoparticles showed that as RH% increased the sensitivity also increased.
References
- 1. Anandan, S., Lee, G.J., Wu, J.J. Sonochemical synthesis of CuO nanostructures with different morphology. (2012) Ultrason Sonochem 19(3): 682-686.
- 2. Zhou, K., Wang, R., Xu, B., et al. Synthesis, characterization and catalytic properties of CuO nanocrystals with various shapes. (2006) Nanotechnology 17(15): 3939-3943.
- 3. Wei, A., Xiong, Li., Sun, Li., et al. CuO Nanoparticle Modified ZnO Nanorods with Improved Photocatalytic Activity. (2013) Chin Phys Lett 30(4): 046202(1-5).
- 4. Qi, Qi., Zhang, T., Qingjiang, Y., et al. Properties of humidity sensing ZnO nanorods-base sensor fabricated by screen-printing. (2008) Sensors and Actuators B: Chemical 133(2): 638-643.
- 5. Debdulal, S., Kamalendu, S. High Temperature Humidity Sensor for Detection of Leak Through Slits and Cracks in Pressurized Nuclear Power Reactor Pipes. (2007) Sensors & Transducers J 77(3): 1025-1031.
- 6. Pandey, N.K., Anupam, T., Karunesh, T., et al. Morphological and Humidity Sensing Studies of WO3 Mixed with ZnO and TiO2 Powders. (2008) Sensors & Transducers J 96(9): 42-46.
- 7. Faheem, A., Shalendra, K., Nishat, A., et al. Growth and characterization of ZnO nanorods by microwave-assisted route: green chemistry approach. (2011) Adv Mat Lett 2(3): 183-187.
- 8. Cun, W., Bo-Qing, Xu., Xinming, W., et al. Preparation and photocatalytic activity of ZnO/TiO2/SnO2 mixture. (2005) J of Solid State Chem 178(11): 3500–3506.
- 9. Giuseppe, M., Vincenzo, A., Maria, J.Lopez-Munoz., et al. Preparation Characterization and Photocatalytic Activity of Polycrystalline ZnO/TiO2 Systems. 1. Surface and Bulk Characterization. (2001) J Phys Chem B 105(5): 1026-1032.
- 10. Gao, X.P., Bao, J.L., Pan, G.L., et al. Preparation and Electrochemical Performance of Polycrystalline and Single Crystalline CuO Nanorods as Anode Materials for Li Ion Battery (2004) J Phys Chem B 108(18): 5547-5551.
- 11. Vijaya Kumar, R., Elgamiel, R., Diamant, Y., et al. Sonochemical Preparation and Characterization of Nanocrystalline Copper Oxide Embedded in Poly(vinyl alcohol) and Its Effect on Crystal Growth of Copper Oxide. (2001) Langmuir 17(5): 1406-1410.
- 12. Junwu, Z., Haiqun, C., Hongbo, L., et al. Needle-shaped nanocrystalline CuO prepared by liquid hydrolysis of Cu(OAc)2. (2004) Mater Sci Eng A 384(1-2): 172-176.
- 13. Ashok, C.H., VenkateswaraRao, K., ShilpaChakra, C.H. Structural Analysis of Cuo Nanomaterials Prepared by Novel Microwave Assisted Method (2014) J Atoms and Molecules 4(5): 803-806.
- 14. Carnes, C.L., Stipp, J., Klabunde, K.J. Synthesis, Characterization, and Adsorption Studies of Nanocrystalline Copper Oxide and Nickel Oxide. (2002) Langmuir 18(4): 1352-1359.
- 15. Zhang, Y., Wang, S., Li, X., et al. CuO shuttle-like nanocrystals synthesized by oriented attachment. (2006) Journal of Crystal Growth 291(1): 196-201.
- 16. Salavati-Niasari, M., Fatemeh, D. Synthesis of copper and copper(I) oxide nanoparticles by thermal decomposition of a new precursor (2009) Mater Lett 63(3-4): 441-443.
- 17. Vidyasagar, C.C., ArthobaNaik, Y., Venkatesha, T.G., et al. Solid-State Synthesis and Effect of Temperature on Optical Properties of CuO Nanoparticles. (2012) Nano-Micro Lett 4(2): 73-77.
- 18. Wang, W., Zhan, Y., Wang, G. One-step, solid-state reaction to the synthesis of copper oxide nanorods in the presence of a suitable surfactant. (2001) Chem Commun 727-728.
- 19. Corr, S.A., Gun’ko, Y.K., Douvalis, A.P., et al. Magnetite nanocrystals from a single source metallorganic precursor: metallorganic chemistry vs. biogeneric bacteria. (2004) J Mater Chem 14: 944-946.
- 20. Biddlecombe, G.B., Gun’ko, Y.K., Kelly, J.M., et al. Preparation of magnetic nanoparticles and their assemblies using a new Fe(II) alkoxide precursor (2001) J Mater Chem 11: 2937-2939.
- 21. Cullity, B.D. Elements of X-ray diffraction, chap-6. (1978) Addison-Wesely Publishing Company Inc.
- 22. FaridJamali, Sheini., Singh, J., Srivasatva, O.N., et al. Electrochemical Synthesis of Cu/ZnO nanocomposite films and their efficient field emission behavior. (2010) Appl Surface Sci 256: 2110-2114.
- 23. Bhuiyan, M.H.U., Saidur, R., Amalina, M.A., et al. Effect of Nanoparticles Concentration and Their Sizes on Surface Tension of Nanofluids. (2015) Procedia Engineering 105: 431-437.
- 24. TarakaPrabhu, Y., VenkateswaraRao, K., SeshaSai K.V., et al. Synthesis of ZnO Nanoparticles by a Novel Surfactant Assisted Amine Combustion Method. (2013) Advances in Nanoparticles 2: 45-50.
- 25. Srivastava, A.K., Yadav, B.C. Humidity sensing properties of TiO2–Sb2O5 nanocomposite. (2010) Mater. Sci.-Poland 28(2): 491-502.
- 26. Pandey, N.K., Tiwari, K., Akash, R. ZnO–TiO2 nanocomposite: Characterization and moisture sensing studies. (2012) Bull Mater Sci 35(3): 347-352.


