
Determining the Development of Insulin Resistance in Older Adults of the NuAge cohort Using Trajectory Modeling of the Homeostatic Model Assessment of Insulin Resistance Score
Joane Matta1,4,7, Nancy Mayo1,6, Isabelle J. Dionne2, Pierrette Gaudreau3, Tamàs Fulop2, Daniel Tessier2, Katherine Gray-Donald4, Bryna Shatenstein5, Susan C. Scott6, José A. Morais1,4*
Affiliation
- 1MUHC – Division of Geriatric Medicine and McGill University, Quebec, Canada
- 2CIUSSS-IUGS and University of Sherbrooke,Quebec, Canada
- 3CUSM – Research Center and Faculty of Medicine, University of Montreal, Quebec, Canada
- 4School of Dietetics and Human Nutrition, McGill University, Quebec, Canada
- 5Department of Nutrition, Universityof Montréal, Quebec, Canada
- 6MUHC – Division of Clinical Epidemiology and McGill University, Quebec, Canada
- 7Department of Nutrition and Dietetics, Holy Spirit University, Jounieh, Lebanon
Corresponding Author
José A. Morais, MD, FRCPC, Division of Geriatric Medicine of McGill University Health Centre, Montreal General Hospital, 1650 Cedar Avenue, Room E16.124.1, Montréal, Quebec, Canada H3G 1A4, Tel: (514) 934-1934/ext. 34499; Fax: (514) 843-1400; E-mail: jose.morais@mcgill.ca
Citation
Morais, J.A., et al. Determining the Development of Insulin Resistance in Older Adults of the NuAge Cohort Using Trajectory Modeling of the Homeostatic Model Assessment of Insulin Resistance Score. (2016) J Diab Obes 3(2): 43- 50.
Copy rights
© 2016 Morais, J.A. This is an Open access article distributed under the terms of Creative Commons Attribution 4.0 International License.
Keywords
HOMA-IR; Aged; Trajectories; Insulin resistance; Body composition; Protein intake
Abstract
Background: Age-associated body composition changes increase the risk of developing insulin resistance. Identifying these subjects in epidemiological studies is challenging.
Objective: Identify insulin-resistant subjects over a 3-year period and determine predictors.
Methods: Data on 649 non-diabetic participants of the Quebec Longitudinal Study on Nutrition and Successful Aging (NuAge) Cohort were analyzed. Muscle mass index (kg/height in m²) and %body fat were derived from dual X-ray absorptiometry or bioimpedancemetry. Insulin resistance was based on the Homeostatic Model Assessment of insulin resistance HOMA-IR score. Physical activity was assessed by questionnaire. Protein and fat intake were obtained from three 24-h food recalls. Developmental trajectories over 4 time points were used to determine insulin sensitivity status. Logistic regression analyses serve to determine baseline variables affecting change over time.
Results: Seven group-based trajectories were identified from a model with good fit. Curve inspection allowed for the classification of insulin sensitive and resistant subjects. Predictors of insulin resistance were: muscle mass index [OR (95% CI): 1.72 (1.26 - 2.3)]; %body fat [1.18 (1.12 - 1.25)]; male sex [OR for women versus men: 0.145 (0.04 - 0.45)].
Conclusion: Greater muscle mass index and % body fat contribute to higher odds of insulin resistance with aging in man whereas being a woman decreases these odds. The relationship between muscle mass and the development of insulin resistance is counterintuitive and requires further exploration since it suggests that maintenance of muscle mass with aging is a contributor. Our probabilistic approach addresses one of the challenges in determining insulin-resistant subjects in epidemiological studies.
Introduction
Aging is associated with an increased risk of chronic diseases such as type 2 diabetes. Data from the Canadian Community Health Survey show that the population prevalence of diabetes increases from 4.4% at age 30 - 64 years to 13.5% at 65 years and over[1]. The prevalence in those > 75 y reaches 21.3% in males and 16.61% in females[2]. Insulin is an anti-catabolic hormone regulating different substrates that stimulates glucose uptake from the bloodstream into adipocytes and myocytes while suppressing glucose production from the liver[3]. Dysregulation of insulin action, a condition known as insulin resistance (IR), is responsible for elevations in blood glucose and lipid concentrations, hyperinsulinemia and eventually, overt type 2 diabetes[4,5].
Aging is also associated with changes in body composition, with an increase in fat mass and a decrease in fat-free mass[6]. Greater adiposity has been associated with a higher risk of IR development[7] since as visceral fat increases so does the risk of inflammation and the availability of free-fatty acids, both considered as mediators of IR[8]. In contrast, a decrease in fat-free mass, mainly muscle, could also be independently associated with IR since skeletal muscle is the major organ for insulin-mediated glucose disposal[9]. Muscle loss with aging is accompanied by a preferential loss of type I fiber as opposed to type II[10,11]. As the former contains most of the muscle mitochondria[12] and since aging affects skeletal mitochondrial function[13], it has been proposed that this dysfunction would lead to IR[14]. Furthermore, there is a link between muscle mass loss and markers of inflammation, which are implicated in IR[8]. Mitochondrial dysfunction in older adults can also lead to decreased fat oxidation in muscles[15]; as a consequence, there is an accumulation of intramyocellular lipid (IMCL), a recognized factor in IR development, independently from overall obesity[16]. Some studies have linked obesity to IMCL and to IR[17].
Although total protein intake, particularly from animal sources, could have a beneficial effect on muscle mass, itappears however, that a high animal protein intake could increase the risk of IR[18]. A number of studies have suggested that a diet high in protein of mainly animal origin may increase risk of IR development[19-21]. While dietary intake of total and animal proteins were shown to increase the risk of type 2 diabetes (taking in account fat intake and adiposity), plant protein intake was not associated with IR in a population of men and women aged 21 - 70 years[21].
Insulin resistance is often assessed in epidemiological studies using the Homeostatic Model Assessment of insulin resistance (HOMA-IR) score that requires only determination of fasting circulating glucose and insulin concentrations[5]. A higher HOMA-IR score indicates more IR. The HOMA-IR score correlates well (r = 0.69 - 0.83) with the gold standard, euglycemic hyperinsulinemic clamp, in different age groups[22]. Based on the above, we hypothesized that, 1) HOMA-IR score increases over time in older subjects; and 2) baseline greater skeletal muscle mass, independently from obesity and fat intake, would be negatively associated with an increase of HOMA-IR score observed over 4 years. Using longitudinal data from a generally healthy older individuals, our objectives were to assess the changes that occur with the HOMA-IR score over four annual time points and to compare insulin-sensitive versus non-sensitive subjects with regard to several baseline variables, including body composition and dietary protein intake, due to concerns linking high protein intake to impaired glucose metabolism and type 2 diabetes[19,20].
Methods
Study population
Data for this study come from the Quebec Longitudinal Study of Nutrition and Aging “NuAge” Cohort[23]. The NuAge Cohort is a four year observational study, with data collection spanning from 2003 - 2009 of 1793 community-dwelling men and women aged 68 - 82 years in general good physical and mental health, and functionally independent at recruitment, generating 600 people per sex and age stratum equally divided between sexes. Recruitment took place in the Montreal and Sherbrooke areas of Quebec, Canada. Methodology has been described in detail elsewhere[23]. Eligibility criteria required that participants were French- or English-speaking on relative good health, meaning that they were able to walk without help (cane acceptable), free of disabilities in activities of daily living, not cognitively impaired (3MS > 79), able to walk 300 meters or to climb 10 stairs without rest, and able to provide written informed consent. Exclusion criteria consisted of class II-IV heart failure, symptomatic chronic obstructive pulmonary disease, inflammatory digestive diseases or cancer in the past five years (except basal cell of the skin). All participants gave informed consent and underwent annual extensive evaluations of body composition, dietary intake, physical performance, functional autonomy and provided fasting venous blood and urine samples. A total of 1062 participants were non-diabetic. Participants suffering from diabetes were excluded based on reported diabetes mellitus or taking anti-diabetic medication, or fasting glucose > 6.9 mmol/L, as it has been shown that diabetes has an effect on muscle mass[24]. Of these non-diabetic participants, 958 had HOMA results and 649 had complete data. Reasons for missing data were administrative in nature, i.e., lack of available body composition or laboratory results and thus the data were considered to be missing completely at random (MCAR), reducing statistical power but not introducing bias. The present study protocol was also reviewed by the Research Ethics Board of the McGill University Health Centre.
Hypotheses and model
First, we hypothesized that HOMA-IR score increase with aging. To study the evolution, we used trajectories over four annual time points. Second, we hypothesized that body composition and dietary intake from different protein sources and fat intake (risk factor for insulin resistance), all adjusted for energy intake would affect HOMA-IR score changes. Individual factors such as age, sex, physical activity, smoking and presence of chronic conditions were considered as covariates and were entered into the model.
Measurements and data collection
Insulin sensitivity was estimated based on the HOMA-IR score and calculated using the following formula: [insulin (μU/ml) x glucose (mmol/L)/22.5]. To assess IR in our population sample we modeled HOMA as a continuous variable. Insulin concentration was determined using a human insulin radioimmunoassay (RIA) kit (detection limit: 12 pmol/L per tube; intra-assay coefficients of variation: 1.1% to 8.3%; Linco Research Inc, St. Charles, MO). Glucose was determined at local hospital laboratories using standardized, automated methods.
Chronic diseases were reported using a modified version of the Older American Resources and Services questionnaire[25]. Participants were asked to answer ‘‘yes’’ or ‘‘no’’ if they were known to have any of the 20 common diseases (e.g., diabetes, osteoporosis, high blood pressure). The total number of diseases was used as an indicator of comorbidity. Lifetime tobacco usage is presented as pack-years smoked, based on 20 cigarettes per pack. Current physical activity was quantified using the Physical Activity Scale for the Elderly (PASE) questionnaire[26].
Dietary intake was measured annually by three non-consecutive 24-hour dietary recalls including one face-to-face interview and two telephone interviews. The 24-hour dietary recall has been shown to be an effective tool to measure dietary intake in such large populations, providing good estimates of intake in healthy elderly people[27]. These were analyzed using CANDAT program (© Godin, London ON), which uses the 2007b Canadian Nutrient File, Health Canada. Nutrients analyzed included total energy intake, protein, total fat, carbohydrates, dietary fiber, and selected micronutrients (vitamins and minerals). We conducted a sub-group analysis of protein intake, classified as animal protein (all proteins from animal sources such as dairy products, eggs, meat, poultry, fish), and plant proteins to test their potential specific role on muscle mass and insulin action. We were able to classify animal proteins into processed and regular (not processed) meat proteins and excluded processed ones to test the effect of animal protein per se, as the former has already been shown to have deleterious effects on IR development[28,29]. Dietary protein intake (from unprocessed and plant proteins) and fat intake were corrected for total energy intake and entered into our model as percentages of energy (kilocalories).
Body composition was assessed by dual energy X-ray absorptiometry (DXA;GE Lunar Prodigy; Madison, WI) for subjects from the Sherbrooke area and by bio-impedance spectrum analyzer (model 4000B, Xitron Technologies, San Diego, CA) for subjects from the Montreal area. Total muscle mass (kg) of the subjects undergoing BIA was estimated by entering values of reactance with a resistance at 50khz and a 800 mA current in the formula proposed by Janssen et al.[30]. This formula was validated against magnetic resonance imaging (MRI), the gold standard for body composition assessment. The muscle mass value was divided by height squared to derive the muscle mass index [MMI = muscle mass (kg) / height (m)²]. Results of appendicular muscle mass obtained by DXA were extrapolated to total muscle mass using the equation of Kim et al.[31], which was also validated against MRI. MMI was then calculated, rending thus the whole population similar in regard to this variable, which was entered into our model. Body fat was estimated directly by DXA, while for estimates obtained from BIA, we subtracted the fat-free mass estimated from a NuAge-specific population- derived equation from total weight. We then calculated percent body fat, which was entered into our model. Comparisons between methods in 406 subjects undergoing both DXA and BIA gave an average Bootstrap Cross Validation regression coefficient for lean body mass of 0.942 ± 0.003 (95% CI: 0.941 - 0.942) for BIA, which is excellent.
DXA provides a good estimate for the measure of whole body composition providing a three compartment model (bone mineral density, fat, and bone-free lean mass)[32]. BIA has also been shown to be a good tool for assessing body composition with excellent correlations compared with DXA of 0.91 - 0.95.
Statistical analyses
Basic descriptive statistics, including means, standard deviations and proportions, were used to describe the sample. For continuous variables, Pearson correlation coefficients were used to assess relationships and t-tests to compare groups, whereas for categorical variables chi-square tests were employed. To estimate the change in HOMA-IR score over 4 time points (3 years), we used developmental trajectories. These were estimated with the TRAJ procedure, a semi parametric group-based modeling strategy[33], using Statistical Analysis Software (SAS, version 9.2). We used the censored normal model (CNORM) within the TRAJ procedure appropriate for data that are approximately normally distributed with or without censoring. Censoring is used because the data tend to cluster at the minimum and at the maximum of the scale. Group-based trajectory linear modeling is designed to identify clusters of individuals following the same progression over time measured in years from baseline[33]. The calculated HOMA-IR score was the outcome regressed over time. Fit statistics and posterior probabilities of group membership were used to compare models with different trajectory groups and to choose the best-fitting model. The choice of the best-fitting model was based on: having AIC and BIC values closest to 0; high mean posterior probabilities specific to each group; and similar theoretical and assigned proportions.
Once a final model was chosen, we further assembled the trajectories into two groups based on their HOMA scores that we had identified as insulin-sensitive and IR groups by macroscopic analysis of the trajectory curves. Posterior probabilities were applied to support that individuals were correctly assigned to the appropriate grouping. To test our second hypothesis, predictors of insulin sensitivity were examined using logistic regression, carried out only among those with complete data. We compared the two groups as dependent variables in a model with baseline independent variables; specifically, these were age, sex, body composition measures, physical activity, smoking, chronic diseases, and diet (fat and animal and plant protein intakes). All variables except sex were entered as continuous in our model. Beta coefficients from the logistic regression were exponentiated for interpretation as odds ratios.
Results
Trajectory analysis was performed on 958 subjects (90.2% of the whole non-diabetic sample comprising 1062 subjects) with at least two measures of HOMA. The mean HOMA of the 958 subjects was 2.45 (± 0.18) at baseline. However, our analysis included the 649 subjects with complete sets of data (61.1% of the whole non-diabetic sample). Table 1 show baseline descriptive characteristics of the whole sample modelled with trajectories, and those who were included in further analyses. The best-fitting trajectory model identified 7 groups. This model had AIC and BIC statistics closest to 0, had mean posterior probabilities greater than 0.7 for all groups, and the assigned proportions per group based on individuals’ highest posterior probabilities were similar to the theoretical proportions. Details for the seven trajectory groups, including the theoretical and assigned proportions and mean posterior probabilities status are shown in Table 2 as well as for two groups created according to insulin sensitivity. The trajectories of HOMA-IR scores over time are shown in Figure 1. We found no statistically significant change over time for groups 1,2,3,4 and 5. While Groups 6 and 7 showed some variation, they had entered the analyses with higher values than groups 1, 2 and 3. The HOMA-IR score increased in Group 6 over time. Although group 7 (comprising 0.63% of the population) showed a decrease in HOMA-IR score, the final value was still considered to be high. Our aim was to determine which subjects developed IR, but we were unable to see any clinically meaningful change over a 3-year period. The macroscopic inspection of the curves suggested 3 patterns (no change, increase, decrease). However, since groups 6 and 7 together comprised only 1.3% of the population, we did not have enough power to compare them to the third group of unchanged pattern.
We then proceeded with a model-based determination of insulin-sensitive versus IR subjects over time by grouping curves of subjects falling into groups 1, 2 and 3 (90% of participants) versus those in groups 4, 5, 6, and 7. We grouped those in the lowest trajectories (1, 2 and 3) based on the rationale that they had a lower HOMA-IR versus those in the other trajectories (4, 5, 6, 7) which had higher HOMA-IR scores at all time points. Cut-off for the HOMA score for IR subjects was set at 6.85. The posterior probability of falling into one of the insulin-sensitive groups was very high (99%) as was the posterior probability in being assigned to one of the IR groups (92%), showing that the participants had a high chance of being assigned correctly to either one of the groups. When assignment to a single group was less clear, the confusion tended to be with another group of the same type, rather than with a group of the other type.
Table 1: Comparative statistics between the whole sample and subjects with the complete dataset.
| Whole sample N = 958 | Included sample N = 649 | P-value | |
|---|---|---|---|
| Muscle mass index (kg/m²) | 8.6 ± 1.5 | 8.7 ± 1.5 | < 0.001 |
| Body fat (%) | 33.5 ± 9.0 | 33.1 ± 9.1 | < 0.001 |
| Age (y) | 73.8 ± 4.0 | 73.5 ± 4.0 | |
| Sex | W = 498 M = 460 |
W = 342 M = 307 |
< 0.001 |
| Smoking (pack-y) | 9.9 ± 52.5 | 9.0 ± 50.0 | < 0.001 |
| Animal protein (% total kcal/d) | 8.2 ± 3.6 | 8.0 ± 3.4 | < 0.001 |
| Plant protein (% total kcal/d) | 5.2 ± 1.3 | 5.1 ± 1.4 | < 0.001 |
| Fat intake (% total kcal/d) | 33.0 ± 6.2 | 33.4 ± 6.0 | < 0.001 |
| PASE (score) | 107.3 ± 52 | 107.0 ± 53 | < 0.001 |
| Chronic diseases (n) | 3.2 ± 2.0 | 3.1 ± 2.0 | < 0.001 |
Table 2: Description of HOMA-IR score trajectory groups and categorizing into 2 subgroups (insulin-sensitive versus non-insulin sensitive).
| Group | Intercept | Assigned Number (%) | Theoretical % | Posterior probabilities | |
|---|---|---|---|---|---|
| Mean (SD) | Minimum-Maximum | ||||
| 1- insulin-sensitive | 2.35 | 392 (40.92) | 40.21 | 0.82 (0.15) | 0.50 - > 0.99 |
| 2- insulin-sensitive | 3.46 | 333 (34.76) | 34.01 | 0.72 (0.14) | 0.46 - 0.97 |
| 3- insulin-sensitive | 5.15 | 137 (14.30) | 15.81 | 0.81 (0.14) | 0.48 - > 0.99 |
| 4- non-insulin-sensitive | 6.85 | 61 (6.37) | 6.37 | 0.87 (0.16) | 0.51 - > 0.99 |
| 5- non-insulin-sensitive | 10.85 | 23 (2.40) | 2.23 | 0.88 (0.16) | 0.51 - 1.00 |
| 6- non-insulin-sensitive | 3.33 | 6 (0.63) | 0.70 | >0.99 (0.007) | 0.98 - 1.00 |
| 7- non-insulin-sensitive | 20.07 | 6 (0.63) | 0.66 | 0.95 (0.12) | 0.70 - 1.00 |
| Insulin-sensitive groups (1,2,3) | 862 (90.0) | 0.99 (0.04) | 0.51 - 1.00 | ||
| Insulin non-sensitive group (4,5,6,7) | 96 (10.0) | 0.93 (0.14) | 0.51 - 1.00 | ||
Note: Bayesian information criterion (958 df) was -4211.56 and Akaike information criterion -4160.48 for 7 group model. Values closer to 0 indicate better fit.
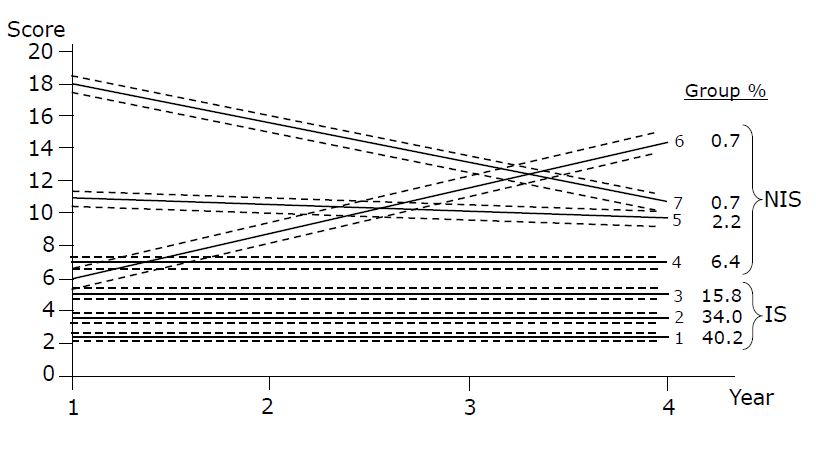
Figure 1: HOMA-IR score trajectory over 4 time points using CNORM model with 7 groups and their confidence intervals. NIS: Non-insulin- sensitive group; IS: Insulin-sensitive group.
Comparisons of characteristics at baseline by category of insulin sensitivity status for participants with complete data are presented in Table 3. We only found significant differences for % body fat and MMI between the two groups. We report the bivariate analyses of continuous baseline variables included in our model in Table 4. Weak but significant negative correlations were observed between % body fat and physical activity; % body fat and MMI; animal protein and fat as % intakes of total energy. A significant positive correlation was obtained between MMI and PASE score.
Results of the logistic regression are presented in Table 5. Significant odd ratios were obtained for MMI, % body fat and sex, controlling for all other covariates in the model. As the proportion of the sample with the outcome is relatively low, the odds ratios can be interpreted as relative risks. For every one unit increase in muscle mass index, the risk of having insulin resistance, independently from adiposity and other covariates, increased by 1.72. For a one unit increase in % body fat, this risk is 1.18 which has a high implication on insulin resistance. The risk of insulin resistance was 6.9 times greater for men than women.
Table 3: Descriptive characteristics at baseline of insulin-sensitive and non-insulin sensitive groups.
| Participants: | Insulin-sensitive group | Non-insulin-sensitive group | P-value |
|---|---|---|---|
| N | 594 | 55 | |
| Sex | M = 270, W = 324 | M = 37; W = 18 | Test with a chi-sq |
| Age (y) | 73.5 ± 3.9 | 73.1 ± 3.7 | 0.56 |
| Chronic diseases (n) | 3.2 ± 1.9 | 3.2 ± 2.0 | 0.81 |
| Smoking (pack-y) | 9.5 ± 52.7 | 3.7 ± 21.0 | 0.41 |
| Animal protein (% total kcal/d) | 5.1 ± 1.3 | 7.6 ± 2.9 | 0.39 |
| Plant protein (% total kcal/d) | 5.1 ± 1.3 | 5.1 ± 1.4 | 0.69 |
| Fat intake (% total kcal/d) | 33.4 ± 6.0 | 33.6 ± 6.2 | 0.77 |
| Body fat (%) | 32.8 ± 9.2 | 36.7 ± 7.2 | 0.0019 |
| Muscle mass index (kg/m²) | 8.6 ± 1.4 | 9.6 ± 1.4 | < 0.0001 |
| PASE (score) | 107.8 ± 51.4 | 98.9 ± 67.7 | 0.23 |
Table 4: Pearson correlation coefficients between all baseline variables.
| Age (y) | Body fat (%) | MMI (kg/m²) | PASE score | Smoking (pack-year) | Plant protein intake (%) | Animal protein intake (%) | Fat intake (%) | Diseases (n) | |
|---|---|---|---|---|---|---|---|---|---|
| Age (y) | 1 | ||||||||
| Body fat (%) | 0.06* | 1 | |||||||
| MMI (kg/m²) | -0.19† | -0.49† | 1 | ||||||
| PASE score | -0.21† | -0.28† | -0.28† | 1 | |||||
| Smoking (pack-year) | -0.02 | -0.04 | -0.03 | -0.05 | 1 | ||||
| Plant protein intake (%) | -0.01 | -0.02 | -0.08* | 0.03 | -0.02 | 1 | |||
| Animal protein intake (%) | -0.03 | 0.12* | -0.1† | -0.06 | -0.01 | -0.12† | 1 | ||
| Fat intake (%) | -0.003 | -0.007 | 0.06 | 0.05 | 0.04 | -0.16† | -0.28† | 1 | |
| Diseases (n) | 0.14† | 0.20† | -0.15† | -0.19† | 0.002 | 0.01 | 0.02 | -0.04 | 1 |
MMI: Muscle mass Index; PASE: Physical Activity Scale for the Elderly.
*Correlation is significant at the 0.05 level (2-tailed).
†Correlation is significant at p < 0.001 level (2-tailed).
Table 5: Logistic regression Odds Ratios of the most parsimonious model of insulin resistance.
| Baseline variables | Estimate B | Standard error of B | Odd ratios (95%CI) | P value |
|---|---|---|---|---|
| Body fat (%) | 0.16 | 0.02 | 1.18 (1.12 - 1.25) | < 0.0001 |
| MMI (kg/m²) | 0.54 | 0.15 | 1.72 (1.26 - 2.3) | 0.0006 |
| PASE score | -0.003 | 0.003 | 0.99 (0.99 - 1.0) | 0.19 |
| Age (y) | -0.003 | 0.04 | 0.99 (0.91 - 1.0) | 0.93 |
| Sex (women versus men) | -0.96 | 0.29 | 0.15 (0.04 - 0.45) | 0.0009 |
| Smoking (pack-year) | -0.006 | 0.005 | 0.99 (0.98 - 1.0) | 0.24 |
| Chronic diseases (n) | -0.005 | 0.08 | 0.99 (0.84 - 1.17) | 0.95 |
| Fat intake (% total energy) | -0.01 | 0.03 | 0.98 (0.93 - 1.04) | 0.67 |
| Animal protein intake (% total energy) | -0.03 | 0.04 | 0.96 (0.87 - 1.06) | 0.45 |
| Plant protein intake (% total energy) | -0.06 | 0.12 | 0.93 (0.73 - 1.2) | 0.61 |
Dependent variable: HOMA-IR score (insulin-sensitive) versus non insulin-sensitive).
Insulin sensitive coded 0 and insulin resistant coded 1
Sex coded 0 for women and 1 for men
Kendall’s Tau-a = 0.102; Sommer’s D = 0.657; c-statistic = 82.9%.
Discussion
To our knowledge this is one of the first studies in this type of population to analyze the developmental trajectories of HOMA-IR score over time. We did not find any significant changes for IR over 3 years. However, some subjects falling into the IR group entered the study with high HOMA-IR values (10% of the overall population). We surmise that our subjects were generally healthy at baseline, and that changes of HOMA-IR may not be readily detected within a 3-year period. Our first objective was to use developmental trajectories because of the inability of a single HOMA-IR score cut-off to accurately identify individuals with different baseline HOMA scores who would become resistant over time. The rationale of this study is to help identify changes in HOMA over time to better predict deterioration in insulin sensitivity using clinical predictors such as body composition, dietary intake and patient’s characteristics.
The validity of the model is supported by the high posterior probabilities we obtained (Table 2) and based on macroscopic analysis of the curves, we were able to distinguish insulin-sensitive versus IR subjects. Although we did not have a cut-off to regroup participants based on their initial HOMA-IR score, we defined our population with the lowest HOMA-IR (data) values to be sensitive in contrast to higher HOMA-IR score participants.
It is worth mentioning that groups 6 and 7 showed some change patterns, but included only 1.3% of the total population. We ran a logistic regression to compare groups 6 and 7 individually to other insulin-sensitive groups, but due to lack of power, results cannot be considered reliable (results not shown).
Our second objective was to compare subgroups identified from trajectories for baseline variables. Consistent with literature, male sex and % body fat impacted on HOMA-IR score over time. However, we found an independent counterintuitive relationship between MMI and HOMA-IR score over time suggesting that higher muscle mass predicts an increased IR risk independently from % body fat. In one study of community-dwelling older Mexican adults, it was shown that low muscle mass is associated with a higher HOMA score[34]. Differences with our results may lie in divergent methods of calculating skeletal muscle mass as well as defining IR. In the Mexican Study, no correction for height was carried out as we did for muscle mass and IR was quantified at > 75th percentile. Cross-sectional data from NHANES III have also shown that sarcopenia, independently of obesity, is associated with IR risk when sarcopenia was defined as muscle mass divided by weight[35], again a different method of defining muscle mass. However the association was strongest in younger individuals (under 60 years of age). This suggests that the effect of muscle mass on insulin sensitivity differs among younger compared to older individuals. When muscle mass index was divided by height similar to our study, another NHANES III study examining the relationship of obesity and sarcopenia with type 2 diabetes and poor glycemic control found that sarcopenia was no associated with any of these risk factors[36]. Our results are consistent with others showing that sarcopenic obesity (a condition combining low muscle mass and high % body fat) is associated with better metabolic outcome than obese non-sarcopenic individuals even after correcting for visceral fat mass, which may link sarcopenia to a better metabolic profile[37]. Similarly, it has been shown that a small muscle mass might be protective against IR in sedentary postmenopausal women[38].
Type 1 muscle fibers contain most of the muscle mitochondria and aging affects its function[13]. It is possible that since there is a decrease in type 2 muscle fibers with aging, which are less linked to insulin function, the remaining type I fibers (involved in insulin action) would render muscle more insulino-resistant because of post receptor desensitization. However, since one study has shown that the increase in type 2 fibers in mice improved overall glucose disposal[39], this suggestion remains controversial. Another explanation may be that with aging, muscle may undergo fat infiltration, predisposing older adults to IR[16]. Therefore, having low muscle mass may attenuate this risk. Further studies assessing the association between muscle loss and IR with aging would need to include muscle fiber phenotype to clarify this issue. Since other variables included in our model (physical activity, protein and fat intake, among others) did not differ between the insulin-sensitive and the IR groups, we ran the most parsimonious model including body composition measures and gender. The fit statistics were good (results not shown). This shows that the baseline variables affecting HOMA-IR in a 3-year period were mainly MMI, % body fat and sex.
Our study has limitations. We have defined our subjects as belonging to insulin-sensitive versus IR groups based on developmental trajectories. Since trajectories are a probabilistic determination of individuals being assigned to a particular group, some individuals might actually belong to a different faction. The posterior probabilities obtained with the 7 assigned groups were high, which adds validity to our model. However, since groups 3 and 4 obtained in the middle of the trajectories might overlap (individuals assigned to group 3 could also be assigned to group 4 and vice versa), we performed some sensitivity analyses by running the regression by grouping the highest and lowest trajectories only to minimize misclassification. We grouped trajectories 1 and 2 versus 5, 6 and 7 and ran the logistic regression. The results provided the same interpretations (data not shown). Another limitation comes from the different body composition measures used in our sample. However, we have rendered the whole population similar with regard to MMI, which minimize technical errors.
In conclusion, the developmental trajectories described here have provided a means of identifying insulin-resistant subjects. Trajectory analysis can detect and identify subgroups of the population. Our study showed that % body fat, muscle mass and sex can predict development of insulin resistance. We did not observe any changes for HOMA-IR score over time suggesting that it may not be detected in healthy elderly individuals over a 3-year period. The relationship between maintenance of muscle mass and development of insulin resistance with aging remains at the present time unsettled. Future longitudinal research on cut-offs of HOMA-IR score as well as its association with muscle mass strength and quality with longitudinal data over longer periods of time is warranted.
Author’s contributions:
Research and concept and design: JM, JAM, NM. Collection and assembly of data: JM, JAM, NM, SCS. Data analysis and interpretation and writing of the manuscript: JM, JAM and NM. All authors provided a critical review of the article and final approval.
Acknowledgements and Funding:
We thank Dr. Hélène Payette for her helpful comments. The present study was funded by Canadian Institutes for Health Research (CIHR) grant# MOP-84528, the CIHR NuAge Study grant# MOP-62842, and the Research Fund of Quebec - Health through the Quebec Network for Research on Aging. JM is a recipient of the Zilinskas Geriatric Fund Research Fellowship from the Research Institute of the MUHC.
References
- 1. Gilmour, H., Park. J. Dependency, chronic conditions and pain in seniors. (2003) Health Rep 16(supp): 21-31.
- 2. http://www.statcan.gc.ca/release-diffusion/2012-eng.htm
- 3. Pirola, L., Johnston, A.M., Van Obberghen, E. Modulation of insulin action. (2004) Diabetologia 47(2): 170-184.
- 4. Newsholme, P., Cruzat, V., Arfuso, F., et al. Nutrient regulation of insulin secretion and action. (2014) J Endocrinol 221(3): R105-R120.
- 5. Resnick, H.E., Jones, K., Ruotolo, G., et al. Insulin resistance, the metabolic syndrome, and risk of incident cardiovascular disease in non-diabetic American Indians: the Strong Heart Study. (2003) Diabetes care 26(3): 861.
- 6. Baumgartner, R.N., Koehler, K.M., Gallagher, D., et al. Epidemiology of sarcopenia among the elderly in New Mexico. (1998) Am J Epidemiol 147(8): 755-763.
- 7. Boden, G. Fatty acid—induced inflammation and insulin resistance in skeletal muscle and liver.( 2006) Curr Diab Rep 6(3): 177-181.
- 8. Tataranni, P.A., Ortega, E. A Burning Question. (2005) Diabetes 54(4): 917-927.
- 9. Welle, S., Nair, K.S. Relationship of resting metabolic rate to body composition and protein turnover. (1990) Am J Physiol 258(6): E990-E998.
- 10. Kamel, H. Sarcopenia and aging. (2003) Nutr Rev 61(5): 157-167.
- 11. Hepple, R.T., Rice, C.L. Innervation and neuromuscular control in ageing skeletal muscle. (2015) The J Physiol 594(8):1965-1978.
- 12. Peterson, C.M., Johannsen, D.L., Ravussin, E. Skeletal muscle mitochondria and aging: a review. (2012) J Aging Res 2012: 194821.
- 13. Harman, D. (1956) Aging: a theory based on free radical and radiation chemistry. (1956) J Gerontol 11(3): 298-300.
- 14. Iossa, S., Mollica, M.P., Lionetti, L., et al.: A possible link between skeletal muscle mitochondrial efficiency and age-induced insulin resistance. (2004) Diabetes 53: 2861-2861.
- 15. Morio, B., Hocquette, J.F., Montaurier, C., et al. Muscle fatty acid oxidative capacity is a determinant of whole body fat oxidation in elderly people. (2001) Am J Physiol Endocrinol Metab 280: E143.
- 16. Petersen, K., Befroy, D., Dufour, S., et al. Mitochondrial dysfunction in the elderly: possible role in insulin resistance. (2003) Science 300: 1140.
- 17. Morino, K., Petersen, K.F., Shulman, G.I. Molecular mechanisms of insulin resistance in humans and their potential links with mitochondrial dysfunction. (2006) Diabetes 55: S9-S15.
- 18. van Nielen, M., Feskens, E.J., Mensink, M., et al. Dietary protein intake and incidence of type 2 diabetes in Europe: the EPIC-InterAct Case-Cohort Study. (2014) Diabetes care 37(7): 1854-1862.
- 19. Sluijs, I., Beulens, J.W., van der, D.L., et al. Dietary intake of total, animal, and vegetable protein and risk of type 2 diabetes in the European Prospective Investigation into Cancer and Nutrition (EPIC)-NL study. (2010) Diabetes care 33(1): 43-48.
- 20. Song, Y., Manson, J.E., Buring, J.E., et al. A prospective study of red meat consumption and type 2 diabetes in middle-aged and elderly women. (2004) Diabetes care 27(9): 2108-2115.
- 21. Tremblay, F., Lavigne, C., Jacques, H., et al. Role of dietary proteins and amino acids in the pathogenesis of insulin resistance. Annu Rev Nutr (2007) 27: 293-310.
- 22. Bonora, E., Targher. G., Alberiche. M., et al. Homeostasis model assessment closely mirrors the glucose clamp technique in the assessment of insulin sensitivity. (2000) Diabetes care 23(1): 57-63.
- 23. Gaudreau, P., Morais, J.A., Shatenstein, B., et al. Nutrition as a determinant of successful aging: description of the Quebec longitudinal study Nuage and results from cross-sectional pilot studies. (2007) Rejuvenation Research 10(3): 377-386.
- 24. Park, S.W., Goodpaster, B.H., Strotmeyer, E.S., et al.Accelerated Loss of Skeletal Muscle Strength in Older Adults With Type 2 Diabetes. (2007) Diabetes care 30(6): 1507.
- 25. Fillenbaum, G.G. Smyer, M.A. The development, validity, and reliability of the OARS multidimensional functional assessment questionnaire. (1981) J Gerontol 36(4): 428-434.
- 26. Washburn, R.A., Smith, K.W., Jette, A.M., et al. The Physical Activity Scale for the Elderly (PASE): development and evaluation. (1993) Journal of clinical epidemiology 46(2): 153-162.
- 27. Payette, H., Gray-Donald, K. Dietary intake and biochemical indices of nutritional status in an elderly population, with estimates of the precision of the 7-d food record. (1991) American Journal of Clinical Nutrition 54(3): 478-488.
- 28. Vang, A., Singh, P.N., Lee, J.W., et al. Meats, processed meats, obesity, weight gain and occurrence of diabetes among adults: findings from Adventist Health Studies. (2008) Ann Nutr Metab 52(2): 96-104.
- 29. Fung, T.T., Schulze, M., Manson, J.E., et al. Dietary patterns, meat intake, and the risk of type 2 diabetes in women. (2004) Arch Intern Med 164(20): 2235-2240.
- 30. Janssen, I., Heymsfield, S.B., Ross, R. Low relative skeletal muscle mass (sarcopenia) in older persons is associated with functional impairment and physical disability. (2002) J Am Geriatr Soc 50(5): 889-896.
- 31. Kim, J., Wang, Z., Heymsfield, S.B., et al. Total-body skeletal muscle mass: estimation by a new dual-energy X-ray absorptiometry method. (2002) Am J Clin Nutr 76(2): 378-383.
- 32. van der Ploeg, G.E., Withers, R.T., Laforgia, J. Percent body fat via DEXA: comparison with a four-compartment model. (2003) J Appl Physiol 94(2): 499-506.
- 33. Jones, B.L., Nagin, D.S., Roeder, K. A SAS procedure based on mixture models for estimating developmental trajectories. (2001) Sociological Methods & Research 29(3): 374-393.
- 34. Alemán-Mateo, H., López Teros, M.T., Ramírez, F.A., et al. Association Between Insulin Resistance and Low Relative Appendicular Skeletal Muscle Mass: Evidence From a Cohort Study in Community-Dwelling Older Men and Women Participants. (2013) J Gerontol A Biol Sci Med Sci 69(7):871-877.
- 35. Srikanthan, P., Karlamangla, A.S. Relative muscle mass is inversely associated with insulin resistance and prediabetes. Findings from the third national health and nutrition examination survey. (2011) J Clin Endocrinol Metab 96(9): 2898-2903.
- 36. Castaneda, C. Janssen, I. Ethnic comparisons of sarcopenia and obesity in diabetes. (2005) Ethn Dis 15(4): 664-670.
- 37. Aubertin-Leheudre, M., Lord, C., Goulet, E.D., et al. Effect of Sarcopenia on Cardiovascular Disease Risk Factors in Obese Postmenopausal Women. (2006) Obesity (Silver Spring) 14(12): 2277-2283.
- 38. Lebon, J., Aubertin-Leheudre, M., Bobeuf, F., et al. Is a small muscle mass index really detrimental for insulin sensitivity in postmenopausal women of various body composition status. (2012) J Musculoskelet Neuronal Interact 12(3): 116-126.
- 39. Izumiya, Y., Hopkins, T., Morris, C., et al. Fast/Glycolytic muscle fiber growth reduces fat mass and improves metabolic parameters in obese mice. (2008) Cell metabolism 7(2): 159-172.


