
Diagnostic Value of Strain Elastography in Distinguishing Benign from Malignant Solid Liver Masses
Affiliation
Gaziosmanpa?a University, School of Medicine, Department of Radiology, Tokat, Turkey
Corresponding Author
Zafer ozmen, Gaziosmanpa?a University, School of Medicine, Department of Radiology, Tokat, Turkey, Email: doktor.zafer@mynet.com
Citation
Ozmen,Z. Diagnostic Value of Strain Elastography in Distinguishing Benign from Malignant Solid Liver Masses (2018) J Gastrointest Disord Liver Func 4(2): 30- 35.
Copy rights
© 2018 Ozmen, Z. This is an Open access article distributed under the terms of Creative Commons Attribution 4.0 International License.
Keywords
Benign; Elastography; Liver mass; Malignant; Strain
Abstract
Purpose: The aim of this prospective study was to determine diagnostic value of strain elastography in differentiation
of benign from malignant solid liver masses. For this purpose, whether strain index values and elasticity color codes are
different for diagnosis of benign and malignant masses were investigated.
Methods: Fifty-two patients who had a total of 56 solid liver masses of 2 cm or larger size were included in the study.
Different Focal Solid Liver Masses (FSLMs) such as hemangiomas, focal nodular hyperplasia, hepatocellular cancer
and metastases were considered in the study. The patients had routine B-mode ultrasonography, colored Doppler ultrasonography
and semi quantitative strain elastography. Sizes, distances to probes, echogenicity and vascularity of the
lesions were evaluated. Strain index values and elastography color codes of the lesions were recorded. Strain index indicating
the stiffness of lesions was calculated based on relative stiffness of lesion compared to normal liver parenchyma.
Value at which the sum of sensitivity and specificity was the highest was considered cut-off value for differentiation of
benign and malignant solid liver masses.
Results: Nature of solid masses was significantly associated with Type B elastographic color coding in benign solid
liver masses, but in malignant solid liver masses Type C elastography color coding was associated with nature of the
lesion. Sensitivity and specificity of Type C were 63 and 76%, respectively, for metastases while those of Type B were
52 and 78%, respectively, for hemangioma. Mean strain indices of malignant and benign solid liver masses were compared.
Mean strain index was 4.80 ± 2.90 for 21 malignant solid liver masses and 1.24 ± 1.00 for 35 benign solid liver
masses. Based on Mann Whitney U test, mean strain index was significantly different in benign and malignant masses.
Strain index of 2.785 at which sum of sensitivity and specificity values were maximum were designated as cut-off point.
Sensitivity and specificity values to differentiate of malignant and benign solid liver masses at the cut-off point of 2.785
were 85 and 88%, respectively.
Conclusions: strain elastography was proposed herein as a promising examination method for differentiation of malignant
and benign solid liver masses. Strain elastography could provide low-cost diagnostic method which can be
performed in a very short time, eliminate invasive procedures, radiation exposure, contrast matter allergies and contrast
nephropathy and reduce unnecessary biopsies and contrast-enhanced sectional imaging.
Introduction
Liver is one of the organs where benign and malignant (primary or metastatic) mass lesions are frequently located. Along with the advances in imaging techniques with higher sensitivity and spatial resolution such as ultrasonography (US), Computed Tomography (CT) and Magnetic Resonance Imaging (MRI), there has been an increase in the detection of incidental and expected Solid Liver Masses (SLMs). The most important and primary aim for approaching these patients is the differentiation of benign or malignant nature of SLM. Effective treatment of primary and metastatic malignant lesions of liver depends on their early diagnosis. When US and CT cannot characterize a lesion, MRI and even invasive tissue biopsies are employed.
Because of its cost effectiveness, reliability and ease of use, ultrasonography is the first-choice method for screening and characterization of SLMs[1]. Nevertheless, sensitivity and specificity of conventional US in characterization of lesions are between 28.1 and 58.8%. Use of contrast matter could improve the sensitivity and specificity of the method to 85 - 90 and 80 - 99% for some lesions[2]. Computed tomography has disadvantages of involving the use of ionizing radiation and nephrotoxic contrast matter. Magnetic resonance imaging, on the other hand, has the advantages of being non-invasive, allowing multiplanar imaging and not having ionizing radiation, but also have the disadvantages of difficulty of use and involving contrast matter use which was shown to cause nephrogenic systemic fibrosis. Tissue biopsies contribute most to diagnosis, but they are invasive methods with complication risks, necessitate experienced specialist and involve considerable costs, which make them last option to consider. In addition, sampling errors and difference in evaluation by pathologists examining the same biopsy specimens are other limiting factor of tissue biopsies.
A novel imaging technique, strain elastography, studies the soft tissue elasticity by determining the strain modules from radiofrequency signals during externally mediated compression and relaxation cycles[3-6]. It was first used in early 1990s by Ophir et al.[7]. Strain elastography is frequently used in examining tumors of tissues such as breast, prostate and thyroid and in evaluation of liver fibrosis[8-16]. It has been increasingly used recently for liver masses. Therefore, the aim of the present study was to determine the efficiency of strain elastography in distinguishing malignant from benign SLMs.
Materials and Methods
Patient Recruitment: This prospective study was approved by the Ethic Committee of Faculty of Medicine, and informed consent was obtained from all patients. Fifty-two patients who had a total of 56 SLMs were evaluated using semiuantitative elastography in December 2014 - June 2015 period. Patients with 2 cm and larger SLMs were included. Lesions were diagnosed based on characteristic MRI, CT and US findings, and clinical and laboratory test results. Percutaneous biopsy was performed for four lesions which couldn’t be diagnosed through imaging. Based on histopathological diagnosis, two of them had HCC and two were metastases. Lesions which were concluded to be benign were monitored for at least 24 months. When no change was observed in size, contour features and contouring patterns during this monitoring period, lesion was considered benign.
Twelve patients who had metastatic lesions throughout the liver and therefore did not have normal parenchyma area, eleven patients with lesions smaller than 2 cm, seven patients who had acid, three patients who couldn’t hold their breath, three patients with advanced parenchymal fibrosis and two patients whose liver lesions were located deeper than 8 cm were excluded.
Imaging and Analyses: Routine B-mode US, colored Doppler US and strain elastography examinations were carried out by a single radiologist with four years of experience using a Toshiba Aplio 500 2012 US machine and 3.5 MHZ pvt-375BT brand convex probe. Patients were given supine and left oblique position during examination. of standard morphological features, size, echogenicity, vascularization, localization, lesion contours and distance of lesion to probe was evaluated using routine B-mode US. Then, elastography mode was applied and real time strain elastography images of the same patient were obtained. In order to get accurate measurements and elastograms, patients were made to hold breath. To obtain measurements, US probe was located in a position closest to lesion. When SLM to be studied with strain elastography was inside imaging area, elastography measurement box was placed in a manner to cover the entire lesion and intact parenchyma for which measurement was to be made. Then, compression-relaxation force was applied to this area 10 - 12 times in anterior-posterior direction in a way that lesion would not leave the imaging area. During this procedure, B mode images were monitored in sonographic screen. Strain elastography images were produced automatically by US machine through comparing two alternating compression-relaxation waves formed by probe movement. Compression and relaxation waves were monitored in sinusoidal pattern below and over the baseline on the screen. Since no pressure was applied during relaxation phase, this phase contained only internal dynamics. Therefore, strain measurements were carried out in relaxation phase. Measurements were made via placing equal or close-to-equal regions of interest (ROIs) in SLM (A) and neighboring liver parenchyma (B) to be used for comparison. Strain index (B / A) reflecting stiffness of SLMs was automatically calculated by US machine. The radiologist who made strain measurements were not informed about the diagnoses of lesions during the measurements. Elastographic color coding was apparent on elastography screen at B mode in a set up where red indicated the highest strain (i.e. the softest tissue) and blue indicated the lowest strain (i.e. the stiffest). Green color, on the other hand, indicated intermediate strain. We carried out color coding of lesions based on classification system named Elasticity Type of Liver Tumor (ETLT) developed by Kato et al.[19]. Elasticity images were classified into four types: type A, lesion was uniform green and concluded to have homogeneous strain; type B, green area was dominant but lesion had a mosaic pattern and strain in most, not all, areas; type C, blue area was dominant but lesion had a mosaic pattern and had strain only in some areas; and type D, lesion was homogeneous blue and had no strain.
Strain index and elastography color code of SLMs were recorded. Strain elastography examination and image analysis procedure took an average of 8 - 10 minutes for each patient. After strain index measurements, average index and elastic color code were compared for benign and malignant SLMs. In addition, average strain indices of benign lesions (hemangiomas vs. FNH) and malignant lesions (metastasis vs. HCC) were compared within themselves.
All statistical analyses were carried out using SPSS software (Statistical Package for the Social Sciences 15.0). Strain values were calculated as mean strain index value ± standard deviation. A non-parametric test, Mann-Whitney U test, was used to compare strain index values of benign and malignant SLMs, and Chi-square test was used to compare elastography color code and nature of mass. P value less than 0.05 at 95% confidence interval was considered significant. Sensitivity and specificity percentages were calculated through ROC analysis of SPSS software. Value at which sum of sensitivity and specificity was highest was considered the cut-off value.
Results
Thirty-three of solid liver masses were diagnosed as hemangioma, two as Focal Nodular Hyperplasia (FNH), 16 as metastasis and five as HCC. The primary source of metastases was listed in Table 1. Twenty-seven of the cases studied were female (age range 31 - 92, mean 54.29 ± 12.96), and 25 were male (age range 31 - 79, mean 59.24 ± 12.51). Demographic features and tumor characteristics of the patients were given in Table 2. Average size of benign SLMs was smaller than those of malignant ones (33.42 ± 14.84 vs. 55.00 ± 24.99 mm, respectively; p < 0.05). Size of benign SLMs varied between 20 and 81 mm, while those of malignant ones between 21 and 100 mm. Mann Whitney U test showed significant (P < 0.05) differences in size and nature of benign and malignant SLMs. In terms of gender difference, benign SLMs were more frequent in females (M/F: 11/24), while malignant SLMs were more frequent in males (M / F:14 / 7) and the difference was significant (p < 0.05). When age and malignity was compared, mean age of the patients with benign SLMs were smaller than that of patients with malignant SLMs (50.14 ± 10.1 vs. 67.04 ± 9.7 years, respectively; p < 0.05) (Table 3).
Table 1: primary tumor of liver metastases.
| Colon | 10 |
| Stomach | 3 |
| Ovarian | 1 |
| Lung | 1 |
| Pancreas | 1 |
Table 2: Demographic features of the patients and characteristics of liver masses.
| % | n | Age (year) | Gender (M/F) | Tumor size(mm) | Mean strain index | |
|---|---|---|---|---|---|---|
| Hemangioma | 59 | 33 | 50.15 ± 10.36 | 22-Nov | 34.00 ± 15.07 | 1.24 ± 1.01 |
| Metastasis | 28.5 | 16 | 66.93 ± 11.17 | 6-Oct | 56.31 ± 26.34 | 4.86 ± 2.55 |
| HCC | 9 | 5 | 67.40 ± 2.70 | 1-Apr | 50.80 ± 22.17 | 4.62 ± 4.19 |
| FNH | 3.5 | 2 | 50.50 ± 7.77 | 0/2 | 24.00 ± 5.65 | 2.07 ± 0.09 |
Table 3: Mean sizes of benign and malignant solid liver masses and demographic features of the patients.
| Benign | Malignant | P | |
|---|---|---|---|
| Tumor size | 33.42 ± 14.84 | 55.00 ± 24.99 | < 0.05 |
| Gender M/F | 11/24 | 14/7 | < 0.05 |
| Age | 50.17 ± 10.14 | 67.04 ± 9.75 | < 0.05 |
In strain elastography, predominant color coding, elasticity and strain rates of SLMs compared to liver parenchyma were evaluated. Elastographic color coding showed that six of the SLMs were Type A, 22 were Type B, 21 were Type C and 7 were Type D. All six of Type A SLMs were benign. None of the malignant SLMs had Type A color coding. Eighteen of Type B SLMs were benign and 4 were malignant. On the other hand, 10 of Type C SLMs were benign and 11 were malignant while one of Type D SLMs was benign and six were malignant (Table 4). Nature of the mass and elastography color coding was compared using chi-square test, and it was found that Type B color coding was significantly associated with benign SMLs while Type C color coding was significantly associated with malignant ones (p < 0.05). Since the number of patients was not sufficient, no statistical analyses were performed for Type A and Type D lesions. However, benign nature of all six lesions which had Type A color coding and malignant nature in six of seven lesions with Type D color coding may indicate strong associations between Type A color coding and benign lesions, and Type D color coding and malignant lesions.
Table 4: Elastography color codes of benign and malignant solid liver masses.
| Benign N (%) | Malignant N (%) | |
|---|---|---|
| Green (Type A) | 6 (17.1%) | - |
| Green dominant (Type B) | 18 (51.4%) | 4 (19.0%) |
| Blue dominant (Type C) | 10 (28.6%) | 11 (52.4%) |
| Blue (Type D) | 1(2.9%) | 6(28.6%) |
| Total | 35 (100%) | 21(100%) |
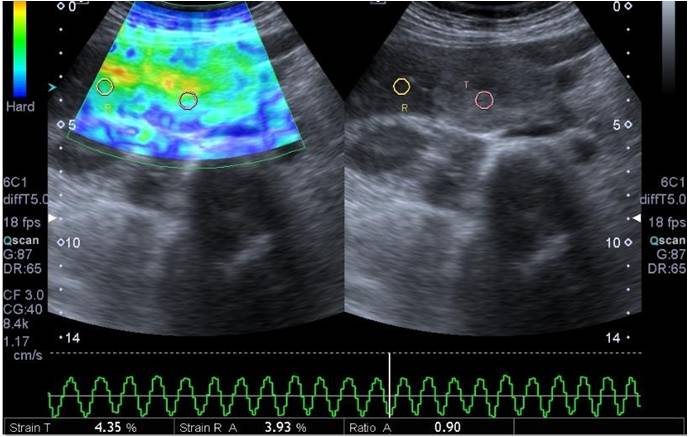
Figure 1: A 40 years old female patient monitored for hemangioma. In B Mode examination, a solid lesion of about 30 x 42 mm size with clear margins, lobule contours and heterogeneous hyperechoic character was observed in segment V localization of liver. Calculated strain index was 0.90 in elastograms. Lesion was encoded with a green-dominant color. Strain index and color code of the lesion was compatible with benign character.
Evaluation of elastographic color coding of SLMs based on different lesion types showed that a Type B coloring had 52% of sensitivity and 78% of specificity for hemangiomas (Figure 1). Type C color coding had 63% sensitivity and 68% specificity for metastatic lesions. Sensitivity and specificity were not calculated for FNH and HCC since the number of patients was not adequate for either lesion (Table 5).
Table 5: Elastographic color codes of solid liver masses.
| Hemangioma | FNH | metastasis | HCC | |
|---|---|---|---|---|
| Green (Type A) | 6 | - | - | - |
| Green dominant (Type B) | 17 | 1 | 2 | 2 |
| Blue dominant (Type C) | 10 | - | 10 | 1 |
| Blue (Type D) | - | 1 | 4 | 2 |
| Total | 33 | 2 | 16 | 5 |
Mean strain index values of benign and malignant SLMs were compared using Mann Whitney U test, and the difference was significant (p < 0.05). Mean strain index of benign lesions was lower than that of malignant ones (Table 6). For the purpose of determining a meaningful cut-off point for strain index, sensitivity and specificity values were calculated for mean strain index values obtained from SLMs. Sum of sensitivity and specificity was highest at 2.7875, and this was considered cut-off point. Distribution of solid liver masses based on cut-off value was given in Table 7. When a cut-off value of 2.785 was used to differentiate benign and malignant lesions, sensitivity and specificity were calculated as 85 and 88 %, respectively.
Table 6: Average strain index values and standard deviations of benign and malignant solid liver masses.
| n | Strain index | |
|---|---|---|
| Benign FSLM | 35 | 1.24 ± 1.00 |
| Malignant FSLM | 21 | 4.80 ± 2.90 |
Table 7: Frequencies of benign and malignant solid liver masses based on cut-off values.
| Strain index | Benign | Malignant | Total |
|---|---|---|---|
| < 2.785 | 31 (88.57%) | 4 (11.43%) | 35 |
| > 2.785 | 4 (19.05%) | 17 (80.95%) | 21 |
| otal | 35 | 21 | 56 |
Discussion
Characterization of solid liver lesions is currently one of the major areas of radiological studies. In differentiation of benign and malignant lesions, conventional ultrasonography has a sensitivity ranging from 28.1 to 58.8% and specificity ranging from 34.6 to 50.7%[2]. Use of contrast matter in ultrasonography improved sensitivity over 80% and specificity over 90%[1]. Gold standard in characterization of liver masses is tissue biopsy. Nevertheless, liver biopsy is an invasive method with complication risks. Besides, it is costly and needs trained physicians. Strain elastography, on the other hand, is a semi-quantitative imaging method which has been used since early 1990s by Ophir et al.[7]. Stain elastography is based on higher deformation of soft parts of tissues under pressure. Using conventional US machines, it measures deformation level of tissue semi-quantitatively after a press application. Advantages of strain elastography over contrasted sonography are that it is non-invasive, faster and does not involve contrast matter use[2].
Strain elastography relies on determining tissue distortion level after pressure application since harder tissues have less elasticity compared to softer ones and show less deformation upon pressure application[18]. Malignant lesions are generally stiffer than normal tissue[18,19]. However, some studies revealed varying elasticities of histologically different tumors based on their tissue structure[20-22]. For evaluation of abdominal organs using qualitative and quantitative elastography methods, more studies have been carried out on liver, and the most reliable results have been obtained for this organ. Hemangiomasappearin Doppler US very frequently as hyperechoic SLMs without vascularization. However, atypical hemangiomas could appear hypoechoic in gray-scale US and may exhibit atypical contrasting pattern in dynamic CT and MRI. Other types of SLMs are generally diagnosed by dynamic CT, MR or percutaneous liver biopsy[23].
The present study revealed that benign lesions were more common in younger age and in women (p < 0.05). This finding is in parallel with studies in literature reporting higher incidence of hemangiomas and FNHs in women and at younger ages[24]. Smaller size of benign lesions compared to malignant ones (p < 0.05) could be explained by the fact that most malignant lesions were metastases and generally larger ones with sharper boundaries were taken for examination. Kato et al.[17] performed intraoperative real time US elastography on 55 liver lesions from 44 patients in 2008 and classified the lesions based on a system they called ETLT. Based on this classification, 21 HCC were classified Type B and 1 HCC Type D, while 1 cholangiocellular carcinoma (CCK) were Type B, 1 CCK Type C and 2 CCK type D. On the other hand, 1 hemangioma was classified Type A, and 2 metastases were classified Type B, while 8 were Type C, and 18 were Type D. Type B had an HCC sensitivity of 95.5% and HCC specificity of 90.9, whereas Type C or Type D had 100% sensitivity and 80.6% specificity for metastasis[17] . In terms or color coding, great majority of metastases in the present study were classified Type C or Type D, similar to the results of Kato et al.[17] .
Type C and Type D color code was found to have 87.5% sensitivity and 70.2% specificity for metastatic lesions in the present study. Sensitivity and specificity of Type C alone were 62.5 and 72.5%, respectively. Sensitivity and specificity levels were lower compared to those reported by Kato et al.[19]. They reported higher sensitivity and specificity of Type B for HCC. In the present study, however, Type B had a sensitivity of 51.5% and a specificity of 78.3% for hemangiomas. Thus, our results differed from those of Kato et al.[17] for lesion type represented by Type B.Our results showed that benign lesions were associated with Type A and Type B, while malignant lesions were associated with Type C and Type D. The basis of strain elastography is that increasing stiffness of lesionis associated with color change from red to blue, and green represents intermediate strain. Therefore, the finding that Type B was associated with hemangioma, a benign lesion mainly made up of dilated venous channels, was not surprising. Although the number of patients was not sufficient, it could be stated that majority of HCCs had Type C and Type D patterns exhibited by stiffer lesions. Indeed, mean strain index values of HCCs were quite high (4.6 ± 4.1) in the present study. Higher strain index values of malignant SLMs were attributed to their histological features containing hyper cellularity and denser tissue structure.
Onur et al.[2] performed semiquantitative strain elastography on 93 SLMs, 26 of which were hemangioma, 10 FNH, 28 metastases, 24 HCC and 5 CCK. They reported a markedly higher mean strain index (2.82 ± 1.82) for malignant lesions compared to benign ones (1.45 ± 1.28). The highest strain index was obtained from metastases (3.22 ± 0.47) and the lowest from hemangiomas (0.92 ± 0.14). Mean strain index of hemangiomas was significantly lower compared to those of adenoma, FNH, nodular regenerative hyperplasia, HCCs and metastases. Strain index values of adenoma-FNH-nodular regenerative hyperplasia complexes, in turn, were significantly lower than those of metastases and HCCs. On the other hand, no difference was found between strain index values of HCCs and metastases. At a cut-off point of 1.28, sensitivity and specificity of strain elastography to distinguish malignant and benign lesions were 78 and 65%, respectively[2]. Similar to the study by Onur et al.[2] semi quantitative strain elastography was performed in the present study. A cut-off point of 2.785 was used in our study since the sum of sensitivity and specificity was highest at this point. Higher sensitivity and specificity (85 and 88%, respectively) were obtained at the cut-off point of 2.785 compared to Onur et al.[2], indicating more sensitive and specific outcome. However, our cut-off point for benign and malignant lesions was somewhat higher than that in Onur et al.[2].
hemangiomas were the group with the lowest mean strain index (1.24 ± 1.01). Mean strain index of benign lesions was very similar to those reported by Onur et al.[2]. In contrast, strain index of malignant lesions was clearly high compared to Onur et al.[2]. Higher strain index values of malignant lesions could be due to primary tumors leading to metastases and differences in internal structures of these tumors. Common result from ultrasound elastography studies has been that malignant lesions are stiffer than benign ones.
The present study has some limitations. Since number of cases was not sufficient and benign group included only hemangiomas and FNHs and malignant group only had HCC and metastases, the study may weakly represent the population. In addition, strain elastography is a patient-dependent method. Examination quality is impaired in obese patients, in patients who cannot hold their bread and in patients who cannot be given proper positioning. Similarly, since the compressions are mediated by operator through external pressure, it is also an operator-dependent technique and experience of operator affects the outcome. Because of difference in level of force applied during manual compression-relaxation cycles to different lesions, different strain index values could be obtained from the same type of lesions. Its semi-quantitative nature is another pitfall of the method. One final drawback of the method is the fact that liver tumors may contain local intersect components which can affect mean strain index of the lesion such as necrosis, calcification and cystic components. Therefore, we avoided making measurements in parts of masses where these kinds of components could be present in gray scale US.
In conclusion, when used together with B-mode ultrasonography, ultrasound elastography could be a very useful and practical examination method to distinguish between benign and malignant liver masses. Use of US elastography could reduce unnecessary biopsies and contrasted sectional imaging, and patients could be diagnosed less expensively in a very short time without invasive procedures and radiation exposure.
References
- 1. Guibal, A., Boularan C., Bruce, M., et al. Evaluation of shear wave elastography for the characterisation of focal liver lesions on ultrasound. (2013) European radiology 23(4):1138-1149.
- 2. Onur, M.R., Poyraz A.K., Ucak, E.E., et al. Semiquantitative strain elastography of liver masses. (2012) JUltrasound Med31(7):1061-1067.
- 3. Albayrak, E., Dogru H. Y., Ozmen, Z., et al. Is evaluation of placenta with real-time sonoelastography during the second trimester of pregnancy an effective method for the assessment of spontaneous preterm birth risk? (2016) Clin Imaging 40(5): 926-993.
- 4. Onur, M.R., Poyraz A.K., Bozgeyik, Z., et al. Utility of semiquantitative strain elastography for differentiation between benign and malignant solid renal masses. (2015) J Ultrasound Med 34(4): 639-647.
- 5. Srougi, V., Kato, R.B., Salvatore, F.A., et al. Incidence of benign lesions according to tumor size in solid renal masses. (2009) Int Braz J Urol 35(4): 427-431.
Pubmed|| Crossref|| Others
- 6. Catalano, C., Fraioli, F., Laghi A., et al. High resolution multidetector CT in the preoperative evaluation of patients with renal cell carcinoma. (2003) AJR 180(5):1271-1277.
- 7. Ophir, J., Céspedes, I., Ponnekanti, H., et al. Elastography: a quantitative method for imaging the elasticity of biological tissues. (1991) Ultrason Imaging13(2):111-134.
- 8. Menezes, R., Sardessai, S., Furtado, R., et al. Correlation of Strain Elastography with Conventional Sonography and FNAC/Biopsy.( 2016) Clin Diagn Res.10 (7):5-10.
- 9. Tajiri, K., Kawai, K., Sugiyama, T. Strainelastography for assessment of liver fibrosis and prognosis in patients with chronic liver diseases. (2017) J Gastroenterol 52(6):724-733.
Pubmed|| Crossref|| Others
- 10. Garra, B.S., Cespedes, E.I., Ophir, J., et al. Elastography of breast lesions: initial clinical results. (1997) Radiology 202(1): 79-86.
- 11. Itoh, A., Ueno, E., Tohno. E., et al. Breast disease: clinical application of US elastography for diagnosis. (2006) Radiology 239: 341-350.
- 12. Lyshchik, A., Higashi, T., Asato, R., et al. Thyroid gland tumor diagnosis at US elastography. (2005) Radiology 237: 202-211.
- 13. Cochlin, D.L., Ganatra, R.H., Griffiths, D.F. Elastography in the detection of prostatic cancer. (2002) Clin Radiology 57(11): 1014-1020.
- 14. Salomon, G., Kollerman, J., Thederan, I., et al. Evaluation of prostate cancer detection with ultrasound real-time elastography: a comparison with step section pathological analysis after radical prostatectomy. (2008) Eur Urol 54(6):1354-1362.
- 15. Ciledag, N., Arda, K., Aribas, B.K., et al. The utility of ultrasound elastography and Micro Pure imaging in the differentiation of benign and malignant thyroid nodules. (2012) AJR198(3): 244-249
- 16. Aigner, F., De Zordo, T., Pallwein-Prettner, L., et al. Real-time sonoelastography for the evaluation of testicular lesions.(2012) Radiology 263(2): 584-589
- 17. Kato, K.,Sugimoto, H., Kanazumi, N., et al. Intra-operative application of real-time tissue elastography for the diagnosis of liver tumours. (2008) Liver International 28(9):1264-1271.
- 18. Gennisson, J.L., Deffieux, T., Fink, M., et al. Ultrasound elastography: principles and techniques. (2013) Diagn Interv Imaging 94(5): 487- 495.
- 19. Havre, R.F., Elde, E., Gilja, O.H., et al. Freehand real-time elastography: impact of scanning parameters on image quality and in vitro intra- and interobserver validations. (2008) Ultrasound Med Biol 34(10): 1638-1650
- 20. Onur, M.R., Poyraz, A.K., Bozgeyik, Z., et al. Utility of semiquantitative strain elastography for differentiation between benign and malignant solid renal masses. (2015) J Ultrasound Med 34(4): 639-647
- 21. Tan, S., Ozcan, M.F., Tezcan, F., et al. Real-time elastography for distinguishing angiomyolipoma from renal cell carcinoma: preliminary observations. (2013) AJR 200(4): 369-375.
- 22. Inci, M.F., Kalayci, T.O., Tan, S., et al. Diagnostic value of strain elastography for, differentiation between renal cell carcinoma and transitional cell carcinoma of kidney. (2016) Abdom Radiol41(6):1152-1159.
- 23. Hardie, A.D., Naik, M., Hecht, E.M., et al. Diagnosis of liver metastases: value of diffusion-weighted MRI compared with gadolinium-enhanced MRI. (2010) Eur Radiol 20(6): 1431-1441.
- 24. Choi, J., Yu, J.S., Cho, E.S., et al. Hepatic cavernous hemangiomas: longterm (> 5 years) followup changes on contrastenhanced dynamic computed tomography or magnetic resonance imaging and determinant factors of the size change. (2018) Radiol Med 123(5): 323-330.


