
Discovery and Identification of Serum Potential Biomarkers for Colorectal Cancer Using TMT Quantitative Proteomics
Minzhe Li*#, Qi Zhang2#, Jian Shen1, Lingfang Tang2 and Jianguo Ji*
Affiliation
- 1General Surgery Department, Beijing Chao-Yang Hospital, Capital Medical University, Beijing, China
- 2State Key Laboratory of Protein and Plant Gene Research, College of Life Sciences, Peking University, Beijing, China
- #Authors contributed equally to this work
Corresponding Author
M. Li, General Surgery Department, Beijing Chao-Yang Hospital, Capital Medical University, Beijing 100020, China, Tel/Fax: +8610-85231323; E-mail: leeminzhe@hotmail.com
J. Ji, State Key Laboratory of Protein and Plant Gene Research, College of Life Sciences, Peking University, Beijing 100871, China, Tel/Fax: +8610 62755470; E-mail: jijg@pku.edu.cn
Citation
Li, M., et al. Discovery and Identification of Serum Potential Biomarkers for Colorectal Cancer Using TMT Quantitative Proteomics. (2017) Int J Cancer Oncol 4(2): 1- 7.
Copy rights
© 2017 Li, M. This is an Open access article distributed under the terms of Creative Commons Attribution 4.0 International License.
Keywords
Colorectal cancer, TMT labeling quantitative proteomics, Differentially expressed protein, Biomarker
Abstract
Colorectal cancer (CRC) is a leading cause of cancer deaths worldwide. Nevertheless, the exact mechanism of CRC occurrence remains unclear, and it is lack of biomarkers for early detection. In this study, we employed a TMT-based quantitative proteomic approach to analyze the proteomic changes in the sera collected from early-staged colorectal cancer patient and healthy volunteers. Among the 282 proteins identified, a total of 76 proteins were found differentially expressed in the patients. Bioinformatics analysis revealed that the differentially expressed proteins were related to focal adhesion and p53 signaling pathway. The differential expression of S-adenosylmethionine synthase (MAT2A) and ATP-binding cassette sub-family B member 9 (ABCB9) was further confirmed by using ELISA analysis. The receiver operation characteristic curve of the diagnostic model was 0.908 for MAT2A, and 0.980 for ABCB9. In conclusion, MAT2A and ABCB9 may be potential protein biomarkers of CRC. Our research may shed light on the early diagnosis of CRC.
Introduction
CRC is one of the most common digestive cancer occurring in colon or rectum[1]. According to the most recent global cancer statistics, it is the third most commonly diagnosed cancer in males and the second in females, with an estimated 1.4 million cases and more than six hundred thousand deaths occurring in 2012[2]. Many cases of CRC have no symptoms. If there were, the following symptoms may indicate CRC: abdominal pain and tenderness in lower abdomen, blood in stool, change in bowel movement, weight loss with no known reason and feeling tired all the time[3]. Most colorectal tumors develop via a multistep process involving histological and genetic changes[4]. CRC typically develops from focal changes within precancerous polyps. As the cells within the polyp proliferate, the size of the polyp increases, and genetic mutations and epigenetic changes may begin to accumulate. As cellular DNA damage accumulates over time, it has a very high risk to become invasive carcinoma[5]. If not being removed, these polyps may invade nearby tissues and grow into and beyond the wall of colon and rectum. This malignant growth may provide access to lymph and circulatory systems thereby promoting the spread of cancer cells to distant organs[6,7]. The traditional pathway observed in most of the sporadic cancer is characterized by a cascade of accumulating mutations[8]. Typically, the first mutation is the APC gene, which affects cell division. Subsequent mutations then develop in the KRAS oncogene, which has downstream effects on cell growth, differentiation and survival. Over time, these mutations can cause a loss of function of the p53 gene, which is a master regulator of transcription and apoptosis, thus impacting a wide range of cellular functions that result in cancergenesis[9,10].
In order to achieve consensus on a globally recognized standard for classifying cancer spreading extent, TNM is developed by UICC. T represents size and extension of the primary tumor, N represents lymph nodes involvement and M represents distant metastasis[11]. Metastasis to regional lymph nodes is one of the most reliable prognostic criteria for CRC patients, which has been adopted globally in the TNM staging system[12]. Patients of stage I/II would have a better prognosis than stage III/IV. Therefore it is urgent to explore efficient early diagnosis criteria[13]. Currently, many potential biomarkers have already been successfully translated into clinical practice, such as Carcinoembryonic antigen (CEA) and CA19-9, although these are no highly promising diagnostic targets for personalized medicine[14]. So there is a critical need for highly sensitive and specific biomarkers of the earliest disease stage[15].
Proteomic approaches have been widely used in the attempt to identify new biomarkers of CRC and also to elucidate the molecular mechanisms of CRC[16]. That has led to the identification of many proteins that could be potentially employed as biomarkers. In this study, we enrolled node-negative patients with early-staged CRC and healthy volunteers to look for the potential CRC biomarkers by using proteomics.
Materials and Methods
Reagents
BCA Protein Assay Kit, Micro BCA Protein Assay Kit, and TMT Mass Tagging Kits and Reagents were purchased from the Thermo Fisher Scientific. Trypsin was provided by Gibco and sequencing level trypsin was from Promega. Acetonitrile (ACN) was obtained from J. T. Baker. All the chemicals and solvents were of analytical grade or LC−MS grade.
Serum samples
Written informed consent was obtained from all subjects. This study included patients with CRC (n = 54) who underwent surgical treatment at Beijing Chao-Yang Hospital. The diagnosis of colorectal cancer was made by ultrasonography and dynamic computed tomography (CT) or magnetic resonance imaging (MRI), and the diagnosis of CRC was made by pathological examinations of the resected tissues after surgery. No patients had a biopsy prior to the operation or received preoperative treatments. Blood samples were drawn within one week of CT or MRI diagnosis and prior to surgical treatment. Healthy volunteers (n = 30) were recruited at the Peking University Hospital for blood collection in accordance with approved Institutional Review Board (IRB) protocols. Serum separated from whole blood was stored at −80°C within 4h of collection and aliquoted extensively to avoid repeat freeze thaw cycles. For proteomic profiling, two microliters of serum from patients in each group was pooled on ice.
Protein digestion
Total protein concentrations were measured by the BCA Protein Assay Kit. Then the same amount of protein was digested in-solution by 1% w/w trypsin, sequencing grade (Promega) overnight at 37°C. After digestion, the peptides were quantified with Micro BCA Protein Assay Kit.
Tandem Mass Tag (TMT) Labeling
Fifty micrograms of peptides from each sample group were used for TMT labeling. The labeling experiment was performed essentially according to manufacturer’s protocol. The peptides from each sample were redissolved in dissolution buffer and then incubated with a specific TMT tag for 1 h at room temperature. The healthy control group sample was labeled with reporter tag 126, while the CRC patients’ group sample was labeled with reporter tag 127. To each sample, 8 μL of 5% hydroxylamine was added and incubated for 20 min to quench the reaction. Samples with different tags were then mixed equally for the following peptide purification. Subsequently, the labeled peptides were desalted with Sep-Pak Vac C18 cartridges (Waters, Milford, MA, USA). The final obtained peptides samples were dried using a rotation vacuum concentrator[17].
Protein identification and relative quantification
The mass spectrometric analyses of the HILIC fractions were performed on a LTQ-Orbitrap XL (Thermo Scientific) instrument coupled to an EASY-nLC using a nanoelectrospray ion source (Thermo Scientific, Proxeon Biosystems). The LC separation of the peptides was carried out using a homemade reversed-phase column packed with ReproSil-Pur 120 C18-AQ 3 μm resin (Dr. Maisch GmbH). The peptides were eluted in a 4-hour linear gradient from solvent A (0.1% (v/v) formic acid) to solvent B (0.1% (v/v) formic acid, 95% (v/v) acetonitrile) with a constant flow of 300 nl/min. The MS/MS spectra of the 3 most intense ions were acquired in centroid mode by higher-energy c-trap dissociation (HCD) and collision induced dissociation (CID) allowing the detection of the low mass TMT reporter ions. All LTQ-Orbitrap raw data files were processed and quantified using Proteome Discoverer version 1.4 (Thermo Scientific). Data were considered reliable when p-value was less than 0.05 and the error factor < 2. The fold changes ratio > 1.5 (upregulated) or < 0.67 (downregulated) was selected as the cutoff value to designate significant changes in protein expression.
Bioinformatics analysis
The GO analysis: cellular component, biological process, molecular function, and KEGG pathway were annotated by Genecodis3 (http://genecodis.cnb.csic.es./). The protein–protein interaction network was analyzed by Search Tool for the Retrieval of Interacting Genes/Proteins (STRING) software (http://string.embl.de/).
ELISA analysis
Human MAT2A ELISA kit (EIAab Science, Wuhan, Hubei, China; the detection limit was 5 ng/mL), human ABCB9 ELISA kit (EIAab Science, Wuhan, Hubei, China; the detection limit was 10 ng/mL). ELISA kit were utilized to measure concentrations of proteins in each serum sample of validation set (n = 56, 16 healthy controls and 40 CRC patients) and performed in duplicates according to the ELISA manufacturer’s instructions. Briefly, diluted samples were incubated in 96-well plates coated with antibodies of proteins for 2 h. After incubation and washing, the biotinylated detection antibodies were added to the wells for 1 h at room temperature with gentle shaking. After a second incubation and washing, add prepared HRP-Streptavidin solution to each well for 1 h. Then substrate Colorimetric TMB Reagent was added to the wells at room temperature for 20 min, and the sulfuric acid was added to stop the enzyme reaction. Finally, absorbance was read on microplate spectrophotometer (Bio-Rad) at a wavelength of 450 nm. The protein concentration was estimated using a double logarithmic diagram based on the measured standard curve.
Construction of the diagnostic model
The serum levels of MAT2A and ABCB9 were used to construct a diagnostic model. During model construction, the diagnostic score of healthy control was set as “0,” while that of CRC patient was set as “1.” The forward stepwise method was used to determine which proteins should be included or excluded from the diagnostic model[18]. The ROC curves were conducted.
Statistical analysis
The numerical data were analyzed with SPSS software, version 19.0 (SPSS, Chicago, IL, USA). Experimental data were presented as mean ± SD and p < 0.05 was considered as statistically significant. Comparison of two groups was tested using the nonparametric Mann–Whitney U test for continuous variables. ROC curves were constructed to assess the diagnostic values of each biomarker.
Results
Experimental design
The overview of the clinical samples and the study design are illustrated in Figure 1. At the initial screening and discovery phase, serum samples were pooled respectively from CRC patients and healthy controls. After digestion, TMT-coupled LC-MS/MS analysis was used to screen candidate protein biomarkers. At the next verification stage, a panel of candidate biomarkers was further verified by ELISA. Finally, the receiver operation characteristic (ROC) curves were carried out.
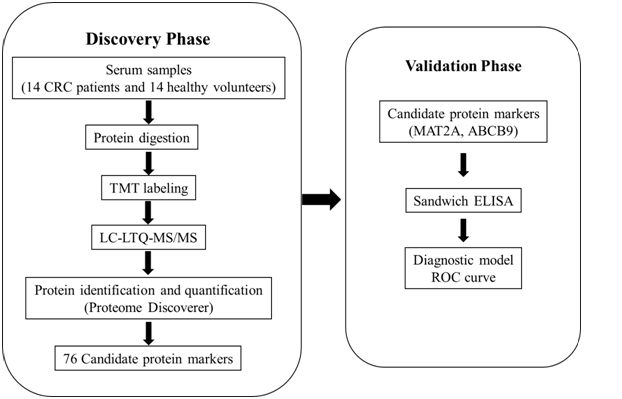
Figure 1: Schematic diagram of the experimental design. In the discovery phase, serum protein candidate biomarkers were identified and quantified using TMT-coupled LC-MS/MS method. In the validation phase, two proteins were further analyzed using ELISA, and diagnostic models were established by ROC curve.
Protein identification and relative quantification
Serum samples from fourteen colorectal cancer patients (“Table S1”) and the same number of healthy controls were pooled respectively. After TMT-coupled LC-MS/MS analysis, proteins were identified and quantified according to the criteria for protein quantification. A total of 282 proteins were identified and 263 proteins were quantified. In serum of CRC patients, a total of 76 differentially expressed proteins were screened. Of the 76 differentially expressed proteins, 38 proteins were upregulated (Supporting Information “Table S2”), and 38 proteins were downregulated (Supporting Information “Table S3”).
Bioinformatics analysis
The analysis of cellular component by GO revealed that the differentially expressed proteins were mostly located in extracellular region, implying that most of the differential proteins were secretery proteins (Figure 2A). Further, the analysis of biological process suggested that most of these differentially expressed proteins were revealed to have a role in blood coagulation, platelet activation, immune response, platelet degranulation and complement activation classical pathway, suggesting that the diverse regulation of signaling pathways is dependent upon expression of these proteins (Figure 2B). In addition, data mining indicated that these identified differential proteins based on the molecular function mainly clustered to protein binding, protein homodimerization activity, eukaryotic surface binding and antigen binding. The most common functional annotation was the binding activity (Figure 2C). The most significant KEGG pathways were mapped by bioinformatics interrogation using Genecodis3, which clustered to complement and coagulation cascades, chemokine signaling pathway, focal adhesion, ECM-receptor interaction, p53 signaling pathway as well as ubiquinone and other terpenoid-quinone biosynthesis. They showed close relationship with tumor genesis and metastasis, and immune response (Figure 2D). These classical signaling pathways revealing the cancer characteristics can support the reliability of mass spectrometry data and lay the foundation of potential biomarkers. Additionally, it was found that most of the differentially expressed proteins were involved in physical or functional interaction to constitute a network through STRING (Search Tool for the Retrieval of Interacting Genes/Proteins) database analysis (Figure 2E). According to bioinformatics analysis, two potential candidate biomarkers (MAT2A and ABCB9) were selected for sandwich ELISA.
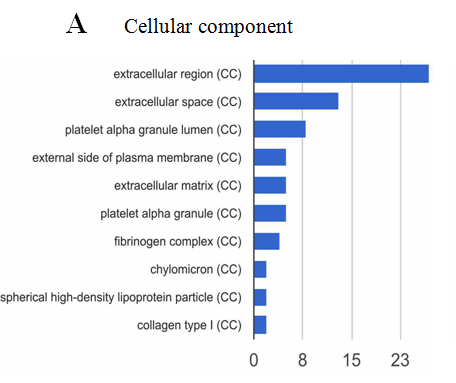
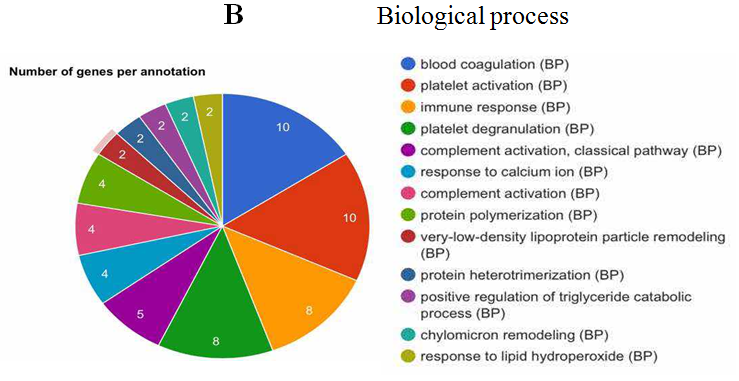
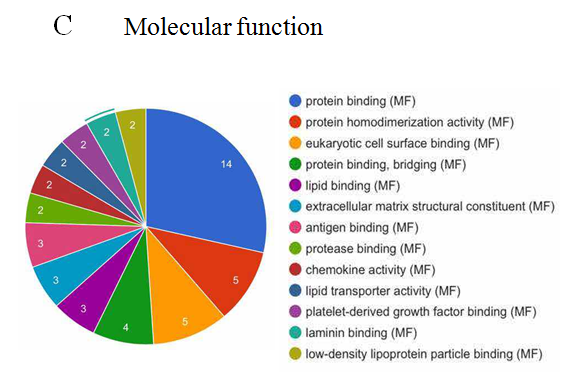
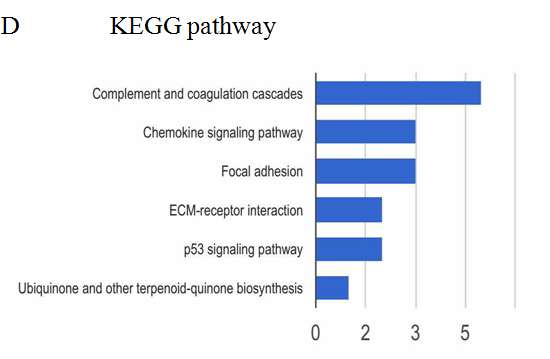
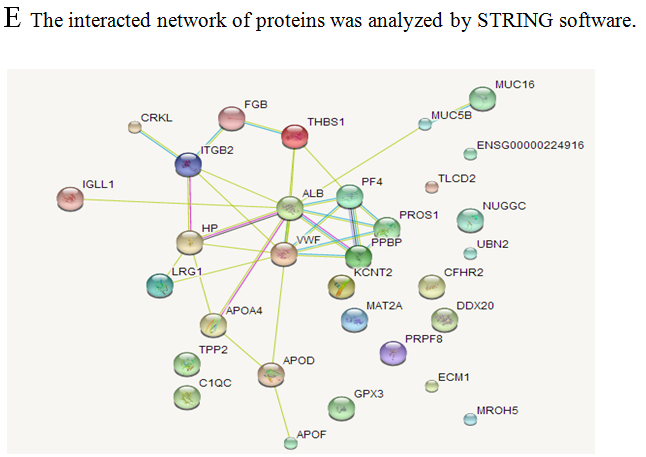
Figure 2: Data mining of the set of colorectal cancer serum biomarker candidates. (A) Cellular component. (B) Biological process. (C) Molecular function. (D) KEGG pathway. (E) The interacted network of proteins was analyzed by STRING software.
Verification of the candidate biomarkers by ELISA
In the validation phase, the serum concentrations of two candidate biomarkers MAT2A and ABCB9 were further measured by ELISA in subjects (n = 56, 16 healthy controls and 40 CRC patients). We chose the patients in validation cohort independent of the ones in discovery cohort to increase samples size, and confirm the regularity and universality of the study. The serum concentrations of MAT2A in CRC patients and healthy controls were 767.72 ± 394.88 and 353.48 ± 264.89 pg/mL, respectively, while, the serum concentrations of ABCB9 in CRC patients and healthy controls were 118.13 ± 157.07 and 5.31 ± 3.06 pg/mL respectively. The results showed that the serum concentrations of MAT2A (p < 0.0001; Figure 3A) and ABCB9 (p < 0.0001; Figure 3B) were significantly higher in the CRC patients group, compared to the healthy control group. The results were consistent with the TMT labeling proteomics data.
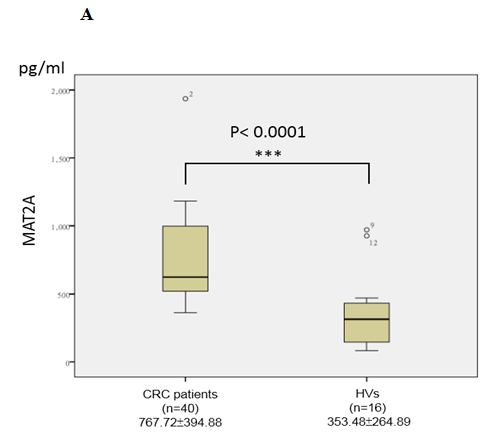
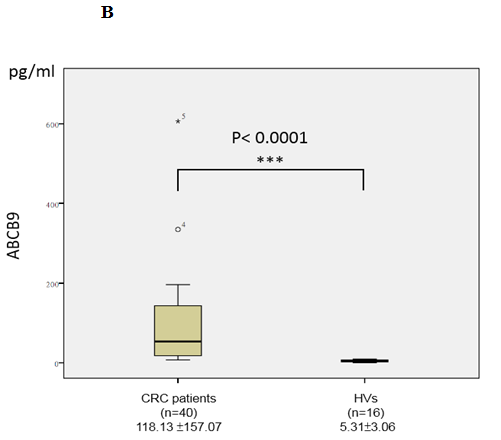
Figure 3: Analysis of MAT2A (A) and ABCB9 (B) in serum. Levels of these candidate biomarkers were measured by ELISA in serum of CRC patients (n = 40) and healthy volunteers (HVs; n = 16); n, number of subjects. Median values are shown by a horizontal line. The p-values were calculated with the Mann–Whitney U test.
Diagnostic value of the model
The diagnostic values of serum MAT2A and ABCB9 were evaluated by ROC curve analysis. The area under the curves (AUC) were 0.908 (P < 0.001) and 0.980 (P < 0.001) for MAT2A and ABCB9 respectively, relative to the healthy volunteers (Figure 4A and 4B).
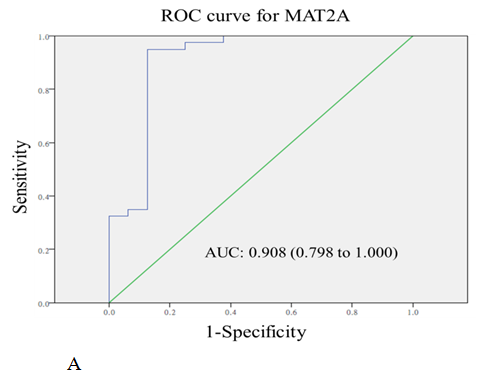
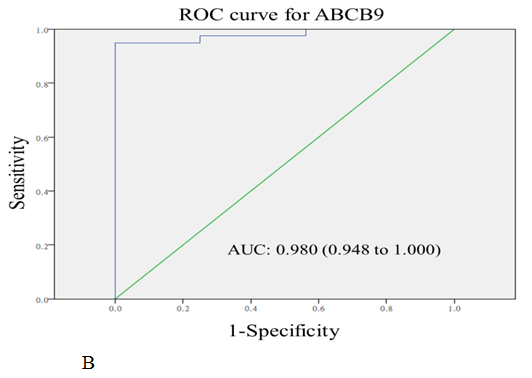
Figure 4: The receiver-operating characteristic curve (ROC curve) for the serum levels of MAT2A (A) and ABCB9 (B) in CRC patients compared with healthy volunteers. The areas under curves (AUC) were 0.908 for MAT2A, and 0.980 for ABCB9.
Discussion
Serum protein is an easy accessible sample for identifying potential protein biomarkers. Moreover, serum can reflect the physiological and pathological conditions[19]. In addition, the serum proteomics method, TMT-coupled LC-MS/MS has been shown to be more sensitive and reliable for high-throughput protein identification and relative quantification between six groups simultaneously.
In this study, 263 proteins were quantified, of which 76 proteins were differentially expressed by at least 1.50- or 0.67-fold. Bioinformatics analysis showed that most of the differentially expressed proteins were involved in the tumor genesis and metastasis, and immune response.
ELISA analysis indicated that there were significant differences in serum MAT2A and ABCB9 between the CRC patients and healthy volunteers, suggesting that these proteins may serve as serum potential biomarkers for colorectal cancer. Previous reports revealed that MAT2A expression is increased in human colon cancer and in colon cancer cells treated with mitogens, whereas silencing MAT2A resulted in apoptosis[20]. MAT2A is also up-regulated in liver cancer and is a potentially important drug target[21]. Similarly, our study found that the serum MAT2A concentration significantly increased in CRC patients, indicating that it may involve in the occurrence and development of CRC. ATP-binding cassette (ABC) transporters play a crucial role in the development of resistance by the efflux of anticancer agents outside of cancer cells[22]. Existing research showed that microRNA-24 increased the sensitivity to paclitaxel in drug-resistant breast carcinoma cell lines via targeting ABCB9[23], and microRNA-31 inhibits cisplatin-induced apoptosis in non-small cell lung cancer cells by regulating the drug transporter ABCB9[24]. Our finding indicated the serum concentration of ABCB9 was significantly higher in the CRC patients group, consisting with the TMT labeling proteomics data. In conclusion, MAT2A and ABCB9 are probably potential CRC biomarkers. Moreover, MAD2L2, PRPF8 and PF4 were changed more than ten folds between CRC patients and healthy volunteers. MAD2L2 inhibits the activation of the anaphase promoting complex APC thereby regulating progression through cell cycle[25]. PRPF8 functions as a scaffold that mediates the ordered assembly of spliceosomal proteins, and its defection may cause missplicing in myeloid malignancies[26]. PF4 is released during platelet aggregation and inhibits endothelial cell proliferation[27]. They are valuable for further study in more depth. AUC was employed to show the accuracy of biomarkers. The results showed that the AUCs of MAT2A and ABCB9 were 0.908 and 0.980, respectively. They presented high sensitivity and specificity of individual biomarkers for CRC.
Conclusion
CRC remains an incurable disease without effective noninvasive techniques. Therefore, it is urgent and important to find early diagnosis methods in clinic. To face the present situation, we performed a research to identify CRC biomarkers in serum by TMT-coupled LC-MS/MS and ELISA. MAT2A and ABCB9 are regarded as potential serum protein biomarkers for CRC. The diagnostic model, composed of these two proteins, may provide meaningful data for diagnosis of CRC. We expect that our study will provide valuable clues on both discovering clinical biomarkers and elucidating previously unknown mechanisms of CRC pathogenesis.
Acknowledge:
This work was supported by grants from the National Key Research and Development Program of China (Nos. 2016YFA0500301).
Table S1: Demographic and clinical data of 14 CRC patients.
| No. | Gender | Age | Pathological stage | T | N | M |
|---|---|---|---|---|---|---|
| 1 | M | 66 | I | 2 | 0 | 0 |
| 2 | F | 62 | I | 2 | 0 | 0 |
| 3 | F | 76 | I | 1 | 0 | 0 |
| 4 | F | 72 | Ib | 2 | 0 | 0 |
| 5 | M | 58 | IIa | 3 | 0 | 0 |
| 6 | M | 72 | IIa | 3 | 0 | 0 |
| 7 | F | 62 | IIa | 3 | 0 | 0 |
| 8 | F | 70 | IIa | 3 | 0 | 0 |
| 9 | M | 81 | IIa | 3 | 0 | 0 |
| 10 | M | 66 | IIa | 3 | 0 | 0 |
| 11 | F | 71 | IIa | 3 | 0 | 0 |
| 12 | F | 63 | IIa | 3 | 0 | 0 |
| 13 | M | 50 | IIa | 3 | 0 | 0 |
| 14 | F | 67 | IIa | 3 | 0 | 0 |
M: Male; F: Female; T: size and extension of the primary tumor; N: lymph nodes involvement; M: distant metastasis.
Table S2: Upregulated-Proteins Identified by TMT Analysis.
| Accession | Protein Name | Ratio CRC/HV |
|---|---|---|
| C9JPQ9 | Fibrinogen gamma chain (Fragment) | 41.685 |
| B4DN45 | S-adenosylmethionine synthase | 32.612 |
| B1AK45 | Mitotic spindle assembly checkpoint protein MAD2B (Fragment) | 25.247 |
| F5H5I5 | ATP-binding cassette sub-family B member 9 (Fragment) | 21.559 |
| Q6P2Q9 | Pre-mRNA-processing-splicing factor 8 | 14.757 |
| P02452 | Collagen alpha-1(I) chain | 12.105 |
| P02679 | Isoform Gamma-A of Fibrinogen gamma chain | 11.210 |
| Q66PJ3 | Isoform 6 of ADP-ribosylation factor- like protein 6-interacting protein 4 | 10.762 |
| P02671 | Isoform 2 of Fibrinogen alpha chain | 9.043 |
| P02675 | Fibrinogen beta chain | 8.835 |
| Q9BRX5 | Isoform 2 of DNA replication complex GINS protein PSF3 | 8.825 |
| F2Z3C0 | 40S ribosomal protein S9 | 8.155 |
| P06889 | Ig lambda chain V-IV region M | 7.713 |
| P08123 | Collagen alpha-2(I) chain | 6.848 |
| Q8N7P1 | Isoform 3 of Inactive phospholipase D5 | 4.908 |
| P0DJI8 | Serum amyloid A-1 protein | 4.650 |
| P46109 | Crk-like protein | 4.270 |
| Q96M20 | Isoform 2 of Cyclic nucleotide-binding domain-containing protein 2 | 4.245 |
| P02741 | Isoform 2 of C-reactive protein | 3.901 |
| E9PJ60 | Probable ATP-dependent RNA helicase DDX20 | 3.854 |
| A3KMH1 | Isoform 2 of von Willebrand factor A domain-containing protein 8 | 3.323 |
| Q6ZUA9 | Maestro heat-like repeat family member 5 | 3.321 |
| Q9HC84 | Mucin-5B | 3.135 |
| M0R162 | Dipeptidyl peptidase 9 (Fragment) | 2.690 |
| C9J2P9 | E3 ubiquitin-protein ligase Hakai (Fragment) | 2.148 |
| Q16610 | Extracellular matrix protein 1 | 2.046 |
| Q3SY61 | KCNT2 protein | 1.891 |
| P01612 | Ig kappa chain V-I region Mev | 1.867 |
| H0Y7R7 | 5’-nucleotidase (Fragment) | 1.825 |
| P00738 | Haptoglobin | 1.824 |
| P04275 | von Willebrand factor | 1.781 |
| Q6ZU65 | Ubinuclein-2 | 1.629 |
| P02750 | Leucine-rich alpha-2-glycoprotein | 1.625 |
| P01702 | Ig lambda chain V-I region NIG-64 | 1.570 |
| D6RIS9 | Selenoprotein P (Fragment) | 1.559 |
| P29144 | Tripeptidyl-peptidase 2 | 1.537 |
| P01708 | Ig lambda chain V-II region BUR | 1.530 |
| P01605 | Ig kappa chain V-I region Lay | 1.513 |
CRC: Colorectal Cancer Patients; HV: Healthy Volunteers.
Table S3: Downregulated-Proteins Identified by TMT Analysis.
| Accession | Protein Name | Ratio CRC/HV |
|---|---|---|
| U3KPR1 | Keratin, type II cuticular Hb6 (Fragment) | 0.660 |
| P01609 | Ig kappa chain V-I region Scw | 0.654 |
| P07225 | Vitamin K-dependent protein S | 0.646 |
| P02747 | Complement C1q subcomponent subunit C | 0.644 |
| P02655 | Apolipoprotein C-II | 0.634 |
| P01703 | Ig lambda chain V-I region NEWM | 0.634 |
| Q68CJ6 | Nuclear GTPase SLIP-GC | 0.624 |
| P05090 | Apolipoprotein D | 0.604 |
| A6NGC4 | TLC domain-containing protein 2 | 0.597 |
| P15814 | Immunoglobulin lambda-like polypeptide 1 | 0.592 |
| F5GXS5 | Apolipoprotein F | 0.583 |
| P06312 | Ig kappa chain V-IV region (Fragment) | 0.577 |
| P01623 | Ig kappa chain V-III region W | 0.574 |
| P01824 | Ig heavy chain V-II region WAH | 0.573 |
| P04207 | Ig kappa chain V-III region CLL | 0.567 |
| P80108 | Phosphatidylinositol-glycan-specific phospholipase D | 0.557 |
| E7ESK7 | 14-3-3 protein zeta/delta (Fragment) | 0.553 |
| Q5VY30 | Retinol binding protein 4, plasma, isoform CRA_b | 0.534 |
| P22352 | Glutathione peroxidase 3 | 0.531 |
| B7WNR0 | Serum albumin | 0.523 |
| P01771 | Ig heavy chain V-III region HIL | 0.511 |
| K7ERI9 | Truncated apolipoprotein C-I (Fragment) | 0.502 |
| Q13535 | Isoform 2 of Serine/threonine-protein kinase ATR | 0.500 |
| P01763 | Ig heavy chain V-III region WEA | 0.496 |
| Q96KG9 | Isoform 5 of N-terminal kinase-like protein | 0.456 |
| P04206 | Ig kappa chain V-III region G | 0.432 |
| P51843 | Isoform 2 of Nuclear receptor subfamily 0 group B member 1 | 0.416 |
| P06727 | Apolipoprotein A-IV | 0.405 |
| Q8WXI7 | Mucin-16 | 0.393 |
| P01764 | Ig heavy chain V-III region VH26 | 0.389 |
| Q15772 | Isoform 1 of Striated muscle preferentially expressed protein kinase | 0.367 |
| F8VYZ1 | M-beta (Fragment) | 0.281 |
| P32754 | Isoform 2 of 4-hydroxyphenylpyruvate dioxygenase | 0.279 |
| P07996 | Thrombospondin-1 | 0.271 |
| P35527 | Keratin, type I cytoskeletal 9 | 0.225 |
| P04264 | Keratin, type II cytoskeletal 1 | 0.210 |
| P02775n | Platelet basic protein | 0.158 |
| P02776 | Platelet factor 4 | 0.040 |
CRC: Colorectal Cancer Patients; HV: Healthy Volunteers.
References
- 1. Brenner, H., Kloor, M., Pox, C.P. Colorectal cancer. (2014) Lancet 383(9927): 1490-1502.
Pubmed || Crossref || Others - 2. Torre, L.A., Bray, F., Siegel, R.L., et al. Global Cancer Statistics, 2012. (2015) Ca-Cancer J Clin 65(2): 87-108.
Pubmed || Crossref || Others - 3. Kendall, J. Rosen's Emergency Medicine - Concepts and Clinical Practice (5th Edition) - CD-ROM. (2003) Resuscitation 56(2): 235.
Pubmed || Crossref || Others - 4. Lochhead, P., Chan, A.T., Giovannucci, E., et al. Progress and Opportunities in Molecular Pathological Epidemiology of Colorectal Premalignant Lesions. (2014) Am J Gastroenterol 109(8): 1205-1214.
Pubmed || Crossref || Others - 5. Weinberg, R.A. Dynamics of cancer: Incidence, inheritance, and evolution. (2007) Nature 449(7165): 978.
Pubmed || Crossref || Others - 6. Simon, K. Colorectal cancer development and advances in screening. (2016) Clin Interv Aging 11.
Pubmed || Crossref || Others - 7. Nagy, J.A., Chang, S.H., Dvorak, A.M., et al. Why are tumour blood vessels abnormal and why is it important to know? (2009) Brit J Cancer 100(6): 865-869.
Pubmed || Crossref || Others - 8. Kinzler, K.W., Vogelstein, B. Lessons from hereditary colorectal cancer. (1996) Cell 87(2): 159-170.
Pubmed || Crossref || Others - 9. Fearon, E.R. Molecular Genetics of Colorectal Cancer. (2011) Annu Rev Pathol 6: 479-507.
Pubmed || Crossref || Others - 10. Pino, M.S., Chung, D.C. The Chromosomal Instability Pathway in Colon Cancer. (2010) Gastroenterol 138(6): 2059-2072.
Pubmed || Crossref || Others - 11. Greene, F.L., Sobin, L.H. A Worldwide Approach to the TNM Staging System: Collaborative Efforts of the AJCC and UICC. (2009) J Surg Oncol 99(5): 269-272.
Pubmed || Crossref || Others - 12. Nelson, H., Petrelli, N., Carlin, A., et al. Guidelines 2000 for colon and rectal cancer surgery. (2001) J Natl Cancer I 93(8): 583-596.
Pubmed || Crossref || Others - 13. Aghagolzadeh, P., Radpour, R. New trends in molecular and cellular biomarker discovery for colorectal cancer. (2016) World J Gastroenterol 22(25): 5678-5693.
Pubmed || Crossref || Others - 14. Wang, H.F., Li, L.F., Guo, S.H., et al. Evaluation of antibody level against Fusobacterium nucleatum in the serological diagnosis of colorectal cancer. (2016) Sci Rep 6: 33440.
Pubmed || Crossref || Others - 15. Erstad, D.J., Tumusiime, G., Cusack, J.C. Prognostic and Predictive Biomarkers in Colorectal Cancer: Implications for the Clinical Surgeon. (2015) Ann Surg Oncol 22(11): 3433-3450.
Pubmed || Crossref || Others - 16. Alnabulsi, A., Murray, G.I. Integrative analysis of the colorectal cancer proteome: potential clinical impact. (2016) Expert Rev Proteomic 13(10): 917-927.
Pubmed || Crossref || Others - 17. Chen, G.X., Zhang, Y., Jin, X.H., et al. Urinary proteomics analysis for renal injury in hypertensive disorders of pregnancy with iTRAQ labeling and LC-MS/MS. (2011) Proteomics Clin Appl 5(5-6): 300-310.
Pubmed || Crossref || Others - 18. Xu, D.D., Deng, D.F., Li, X., et al. Discovery and identification of serum potential biomarkers for pulmonary tuberculosis using iTRAQ-coupled two-dimensional LC-MS/MS. (2014) Proteomics 14(2-3): 322-331.
Pubmed || Crossref || Others - 19. Ray, S., Reddy, P.J., Jain, R., et al. Proteomic technologies for the identification of disease biomarkers in serum: Advances and challenges ahead. (2011) Proteomics 11(11): 2139-2161.
Pubmed || Crossref || Others - 20. Tomasi, M.L., Ryoo, M., Skay, A., et al. Polyamine and methionine adenosyltransferase 2A crosstalk in human colon and liver cancer. (2013) Exp Cell Res 319(12): 1902-1911.
Pubmed || Crossref || Others - 21. Zhang, W., Sviripa, V., Chen, X., et al. Fluorinated N,N-Dialkylaminostilbenes Repress Colon Cancer by Targeting Methionine S-Adenosyltransferase 2A. (2013) ACS Chem Biol 8(4): 796-803.
Pubmed || Crossref || Others - 22. Hlavata, I., Mohelnikova-Duchonova, B., Vaclavikova, R., et al. The role of ABC transporters in progression and clinical outcome of colorectal cancer. (2012) Mutagenesis 27(2): 187-196.
Pubmed || Crossref || Others - 23. Gong, J.P., Yang, L., Tang, J.W., et al. Overexpression of microRNA-24 increases the sensitivity to paclitaxel in drug-resistant breast carcinoma cell lines via targeting ABCB9. (2016) Oncol Lett 12(5): 3905-3911.
Pubmed || Crossref || Others - 24. Dong, Z., Zhong, Z.W., Yang, L.H., et al. MicroRNA-31 inhibits cisplatin-induced apoptosis in non-small cell lung cancer cells by regulating the drug transporter ABCB9. (2014) Cancer Lett 343(2): 249-257.
Pubmed || Crossref || Others - 25. Iwai, H., Kim, M., Yoshikawa, Y., et al. A bacterial effector targets Mad2L2, an APC inhibitor, to modulate host cell cycling. (2007) Cell 130(4): 611-623.
Pubmed || Crossref || Others - 26. Kurtovic-Kozaric, A., Przychodzen, B., Singh, J., et al. PRPF8 defects cause missplicing in myeloid malignancies. (2015) Leukemia 29(1): 126-136.
Pubmed || Crossref || Others - 27. Gupta, S.K., Hassel, T., Singh, J.P. A Potent Inhibitor of Endothelial-Cell Proliferation Is Generated by Proteolytic Cleavage of the Chemokine Platelet Factor-4. (1995) Proc Natl Acad Sci U S A 92(17): 7799-7803.
Pubmed || Crossref || Others


