
Distributions of Serum Cotinine and Urinary NNAL among daily Cigarette Smokers and Inter-Correlations
Affiliation
Private Consultant, Dacula, GA
Corresponding Author
Ram B. Jain, Private Consultant, 2959 Estate View Ct, Dacula, GA, 30019, Tel: 001-910-729-1049; E-mail: Jain.ram.b@gmail.com
Citation
Jain, R.B. Distributions of Serum Cotinine and Urinary NNAL among Daily Cigarette Smokers and Inter-Correlations. (2016) J Environ Health Sci 2(2): 1-13.
Copy rights
© 2016 Jain, R.B. This is an Open access article distributed under the terms of Creative Commons Attribution 4.0 International License.
Keywords
Time to first cigarette; Mentholated cigarettes; Environmental tobacco smoke; Cigarette length; Tar and nicotine; Number of cigarettes smoked daily
Abstract
Background/Objectives: Serum cotinine (SCOT) and urinary 4-(methylnitrosamino)-1-(3-pyridyl)-1-butanol (NNAL) are often used as biomarkers of tobacco smoke. The objective of this study was to investigate factors associated with the variability in the levels of SCOT and NNAL among daily cigarette smokers aged ≥ 20 years and to evaluate co-rrelational patterns between their observed levels.
Methods: Data from National Health and Nutrition Examination Survey for years 2007 - 2012 were used. Statistical methodologies including regression models that incorporated sampling weights and sampling design characteristics were used to assess factors associated with the variability in the observed levels of SCOT and NNAL among daily cigarette smokers aged ≥ 20 years as well as to study co-rrelational patterns between the observed levels of SCOT and NNAL.
Results: Levels of both SCOT and NNAL increased with increase in age (p < 0.01) but, as estimated by the fitted regression parameters, starting at the age of about 55 years for SCOT and at the age of about 60 years for NNAL, increase in observed levels of both of these of chemicals slowed down. Relationship of both SCOT and NNAL with number of cigarettes smoked per day (CPD) was mediated by the self-reported values of CPD.
Conclusion: While both SCOT and NNAL are useful biomarkers of tobacco smoke, variability in their observed levels with change in such factors as age as well as co-rrelational patterns between them should be kept in mind before any decision is made to estimate “true” level of smoking associated with their observed levels.
Introduction
CYP2A6 metabolizes nicotine, an essential constituent of tobacco, into cotinine, and contributes towards metabolizing 4-(methylnitrosamino)-1-(3-pyridyl)-1-butanone or NNK, a tobacco specific nitrosamine present in tobacco and tobacco smoke, into 4-(methylnitrosamino)-1-(3-pyridyl)-1-butanol or NNAL (Yuan et al., 2016., Richie JP., et al 1997., Benowitz, N., et al 2010). Serum cotinine (SCOT) has often been used as a biomarker of exposure to mainstream tobacco smoke (Rostron et al., 2015, Jain, 2014, 2015a, Chen et al., 2014, St Helen et al., 2014, Agaku et al., 2014, Jones et al., 2013) as well as exposure to environmental tobacco smoke or ETS (Jain, 2015b, 2016). NNAL has also been used as a biomarker of exposure to mainstream tobacco smoke (Rostron et al., 2015, Wei et al., 2015, Czolie et al., 2015, Chen et al., 2014, St Helen et al., 2014, Branstetter et al., 2013, 2014, Khariwala et al., 2014, Agaku et al., 2014, Jones et al., 2013) as well as exposure to ETS (St Helen et al., 2012, Vardavas et al., 2012, Florek et al., 2011).
Rostron et al. (2015) used data from National Health and Nutrition Examination Survey (NHANES) for 1999-2012 and reported exclusive smokeless tobacco users to have higher levels of both SCOT and NNAL than exclusive cigarette smokers. Jain (2015a) reported non-Hispanic white (NHW) adults to have lower levels of SCOT than non-Hispanic black (NHB) adults among both smokers and nonsmokers. Agaku et al. (2014) reported SCOT levels among current adult smokers to be higher among those who used long/ultra-long cigarettes than those who used regular/king size cigarettes. Adjusted ratio of SCOT among menthol vs. non-menthol cigarette smokers as reported by Jones et al. (2013) was found to be 1.03 (0.95 - 1.11) or the differences were not statistically significant. Dose-response relationship between SCOT and cigarettes smoked per day (CPD) was not observed among NHB but was found to be positive among NHW (Benowitz et al., 2011).
Jain (2014) analyzed SCOT data for NHANES 1999 - 2010 and reported NHB to have higher SCOT levels than NHW and no significant differences in SCOT levels among males and females or among menthol and non-menthol cigarette smokers were observed. SCOT levels were shown to increase with cigarettes smoked per day (CPD), Cambridge Filter Method (CFM) nicotine and tar, and exposure to ETS at home. The model fitted by Jain (2014) did not include age as one of the independent variables which, as will be seen in the analysis for this study was a mistake since the association between age and SCOT can be represented by a quadratic function. In addition, as has been reported elsewhere and was also seen in preliminary work, the association between SCOT and CPD can be represented by a quadratic function with negative coefficient for the quadratic term. In addition, Jain (2014) did not include time to first cigarette of the day (TTFC) as one of the independent variables which, as has been shown by other authors, for example by Branstetter et al. (2014), does have an association with SCOT levels.
NNAL concentrations among cigar smokers were reported to be similar to daily cigarette smokers (Chen et al., 2014). In a study of 55 experienced water pipe users (St Helen et al., 2014), a two-fold increase in NNAL levels was observed after smoking water pipes. Agaku et al. (2014) reported NNAL levels among current adult smokers to be higher among those who used long/ultra-long cigarettes than those who used regular/king size cigarettes. NNAL levels were not found to differ among users of light and regular cigarettes (Bernert et al., 2005). Similar results were reported by Hecht et al. (2005). Adults and adolescents were not found to differ in NNAL-Gluc to NNAL ratio (Hertsgaard et al., 2008). Bernert et al. (2010) reported children to have higher NNAL levels than adult nonsmokers. St Helen et al. (2012) reported higher NNAL levels after exposure to ETS outside bars and restaurants. Creatinine adjusted levels of total NNAL were found to be higher among smokeless tobacco users than smokers (Hecht et al., 2007).
Xia et al. (2011) used NHNES 2007-2008 among smokers aged ≥ 12 years defined as those having SCOT levels ≥ 10 ng/ mL, and reported females to have higher levels of NNAL than males (353 vs. 293 pg/mL, p = 0.003), NHW to have higher NNAL levels than NHB (336 vs. 252 pg/mL, p = 0.025), age used as a continuous variable was not found to affect NNAL levels (p = 0.23), and a quadratic association between CPD and NNAL was observed with coefficients for both CPD and CPD2 as being positive but not statistically significant. In addition, cigarette mentholation status (CMS) did not affect the levels of NNAL (p = .095); however, they (Xia et al. 2011) used log10 transformed values of SCOT as an independent variable in the multivariate regression model. Females having higher levels of NNAL than males has also been reported among others by Czoli et al. (2015), The impact of smoking mentholated cigarettes on the levels of NNAL has been investigated by several authors and the results have varied from one study to another. The studies that have reported no effect of CMS on the levels of NNAL are due to Jones et al. (2013) and Heck et al. (2009). Rostron et al. (2013) reported menthol cigarette smokers to have lower NNAL levels than non-menthol smokers and the ratio of NNAL-Gluc to NNAL, a possible indicator of lung cancer risk, was found to be lower among smokers of menthol cigarettes when compared with smokers of non-menthol cigarettes (Muscat et al., 2009). Jain (2015a) reported NHW adults to have higher levels of NNAL than NHB among both smokers and nonsmokers. Native Hawaiians and Japanese Americans were reported to have lower NNAL levels than NHW when adjustments were made for age and gender (Derby et al., 2009). Mean concentration of NNAL was reported to be higher in black males than white males (Muscat et al., 2005) but these results were not observed among females.
The association between time to first cigarette of the day (TTFC) and NNAL levels has also been investigated by a few authors. Branstetter et al. (2014), in a study among 215 adolescents aged 12 - 18 years of age and among both regular and intermittent smokers reported a dose-response relationship between TTFC and NNAL. A shorter TTFC was reported to be associated with increasing NNAL levels after adjustments were made for CPD, ETS exposure, age, gender, race/ethnicity, and other potential confounders (Branstetter et al. 2013). Czoli et al. (2015) reported a positive association between CPD and NNAL levels and among non-daily smokers, Khariwala et al. (2014) reported a moderate Spearman’s correlation of 0.39 between CPD and NNAL. A dose-response relationship between NNAL and CPD was not found among NHB but was found to be positive among NHW (Benowitz et al., 2011). Using data from everyday smokers for NHANES 2007 - 2010, NNAL levels were reported to increase with CPD for NHW, NHB, and Hispanics (HISP) but NNAL concentrations leveled off at lower CPD values for NHB smokers as compared with other smokers (Rostron et al., 2013). Levels of total NNAL were found to increase with CPD but not in a linear fashion (Joseph et al., 2005).
When an analyte’s measurements are available in both serum/plasma/blood and urine, it is customary and appropriate to fit statistical models for urinary concentrations with serum/plasma/blood concentrations as one of the independent variables. It is so because there should be a linear or nonlinear correspondence between the levels in serum/plasma/blood and urine. While SCOT and NNAL can be assumed to have a correlation because both of them are considered to be biomarkers of tobacco smoke, it is not understandable why predicted concentrations of NNAL should be adjusted for SCOT concentrations to study its differences by gender, race/ethnicity and other useful factors as was done by Xia et al. (2011). Consequently, while it may of interest to study correlations between SCOT and NNAL as will be done in this study, this author does not think SCOT should be used as an independent variable to evaluate the differences in the levels of NNAL by demographic and other factors and for this reason, in order to fit statistical models for NNAL for this study, SCOT will not be used as an independent variable. Rostron et al. (2013) fitted regression models for creatinine adjusted NNAL concentrations which implicitly assumes that urinary creatinine concentrations are affected by dilution only. Barr et al. (2005) has shown that urinary concentrations also vary by gender, race/ethnicity, body mass index, and other factors like diabetes and as such, these authors recommended that statistical models for urinary analyte concentrations should be fitted with “raw” urinary analyte concentrations as the dependent variable and urinary creatinine as one of the independent variables. A recent paper by O’Brien et al. (2015) has also supported this view by suggesting that a two-stage model is more appropriate to study urinary analyte concentrations. This author supports the recommendations by Barr et al. (2005) and O’Brien et al. (2015) and as such urinary creatinine will be used as one of the independent variables to fit models for NNAL. In addition, one of the very important variables which both Xia et al. (2011) and Rostron et al. (2013) did not include in their models is TTFC.
As could be guessed from some of the discussion above, the primary objective of this study will be to study variability in the levels of SCOT and NNAL by gender and race/ethnicity when adjustments are made for other factors like TTFC, CPD, exposure to ETS at home and work, age and others. Since data for both NNAL and SCOT for the NHANES 2007 - 2008, 2009 - 2010, and 2011 - 2012 are available; NHANES data for 2007 - 2012 will be used for this study. Other sub-studies and special studies as described in the next section will also be conducted.
Materials and Methods
Data description and source
Data from NHANES for the years 2007 - 2012 for those aged = 20 years from demographic (http://wwwn.cdc.gov/Nchs/ Nhanes/Search/DataPage.aspx?Component=Demographics&CycleBeginYear=2011), body measures (https://wwwn.cdc.gov/Nchs/ Nhanes/2011-2012/BMX_G.htm), recent tobacco use questionnaire (https://wwwn.cdc.gov/Nchs/Nhanes/2011-2012/SMQRTU_G. htm), home interview tobacco use questionnaire (https://wwwn.cdc.gov/Nchs/Nhanes/2011-2012/SMQ_G.htm),family, smoking questionnaire https://wwwn.cdc.gov/Nchs/Nhanes/2011-2012/SMQFAM_G.htm), occupational questionnaire (https://wwwn.cdc. gov/Nchs/Nhanes/2011-2012/OCQ_G.htm), pregnancy files (https://wwwn.cdc.gov/Nchs/Nhanes/2011-2012/UCPREG_G.htm), SCOT and NNAL files (https://wwwn.cdc.gov/Nchs/Nhanes/2011-2012/COTNAL_G.htm) were downloaded and match merged. The sampling plan for NHANES generates data which are representative of the civilian, non-institutionalized U.S. population. Sampling weights are created in NHANES to account for the complex survey design, including oversampling, survey non-response, and post-stratification. All analyses completed for this study incorporated sampling weights as well as sampling design characteristics, i.e., stratification and clustering. Females pregnant at the time of participation in NHANES as determined from pregnancy data files were removed from the database. In addition, only those who self-reported using cigarettes only for each of the previous five days as determined from the recent tobacco use questionnaire were selected for the study. These participants were considered to be daily cigarette smokers for the purpose of this study. Recent tobacco use questionnaire also provided data for CPD. After these exclusions, sample size with non-missing values of SCOT was 2322 and 2339 for non-missing values of NNAL. Details are given in Table 1. Table 1 also provides data on actual sample sizes used in regression models for which details are provided later on in this section. Next, status on exposure to ETS at work (ETS_Work) was determined from the data provided in occupational questionnaire files and status on exposure to ETS at home (ETS_Home) was determined from the data available from family smoking questionnaire files. Those who were not working at a job at the time of participation in NHANES were considered to be not exposed to ETS_Work. Data on TTFC, cigarette length used (CIGL), absence or presence of cigarette filter (CIGF), CMS, Cambridge Filter Method (CFM) carbon monoxide content (CFM_CO), CFM tar content, and CFM nicotine content (CFM_NI) were extracted from home interview smoking questionnaire. It should be noted that data on more than 25% participants were missing for CFM_NI and as such, there was a substantial reduction in sample size that was available for use in multivariate statistical analysis.
Table 1: Un-weighted sample sizes by gender and race/ethnicity. Data from National Health and Nutrition Examination Survey 2007-2012.
| Original Data | Regression Model | |||||||
|---|---|---|---|---|---|---|---|---|
| Serum Cotinine | Urinary NNAL | Serum Cotinine | Urinary NNAL | |||||
| N | % | N | % | N | % | N | % | |
| Total | 2322 | 100.0 | 2339 | 100.0 | 1441 | 100.0 | 1459 | 100.0 |
| Male | 1273 | 54.8 | 1296 | 55.4 | 774 | 53.7 | 792 | 54.3 |
| Female | 1049 | 45.2 | 1043 | 44.6 | 667 | 46.3 | 667 | 45.7 |
| Non-Hispanic White | 1271 | 54.7 | 1254 | 53.6 | 789 | 54.8 | 783 | 53.7 |
| Non-Hispanic Black | 562 | 24.2 | 587 | 25.1 | 375 | 26.0 | 393 | 26.9 |
| Hispanic | 360 | 15.5 | 366 | 15.6 | 202 | 14.0 | 205 | 14.1 |
| Other Race/Ethnicities | 129 | 5.6 | 132 | 5.6 | 75 | 5.2 | 78 | 5.3 |
Laboratory methods
Laboratory methods to measure SCOT and NNAL are given at https://wwwn.cdc.gov/Nchs/Nhanes/2011-2012/COTNAL_ G.htm#Description_of_Laboratory_Methodology and for determination of pregnancy status at https://wwwn.cdc.gov/Nchs/ Nhanes/2011-2012/UCPREG_G.htm#Description_of_Laboratory_Methodology.
Statistical analysis
All statistical analyses completed for this study used SAS University Edition software (www.sas.com). Analyses for this study were conducted in five phases. In the first phase, SAS Proc Corr was used to estimate Pearson correlations between log10 transformed values of SCOT and NNAL for selected grouped values of CPD, namely, 1- 5, 6 - 10, 11 - 15, 16 - 20, 21 - 30, and >30 and to estimate Spearman’s correlations between untransformed values of SCOT and NNAL for grouped values of CPD. The results of this analysis are provided in Table 2.
Table 2: Correlations between serum cotinine and urinary NNAL by number of cigarettes smoked daily (CPD). Data from National Health and Nutrition Examination Survey 2007-2012.
| CPD | N | Pearson Correlation* | Spearman's Correlation** |
|---|---|---|---|
| 1 - 5 | 455 | 0.58 | 0.57 |
| 6 - 10 | 794 | 0.37 | 0.36 |
| 11 - 15 | 304 | 0.37 | 0.34 |
| 16 - 20 | 631 | 0.34 | 0.24 |
| 21 - 30 | 177 | 0.13 | 0.11 |
| > 30 | 104 | 0.20 | 0.27 |
*between log10 of serum cotinine and log10 of urinary NNAL
**between serum cotinine and urinary NNAL
For the second phase of the analysis, percent frequency distribution of grouped values of CPD was estimated by using SAS Proc FREQ by gender (males, females) and race/ethnicity (non-Hispanic white or NHW, non-Hispanic black or NHB, Hispanics or HISP, and other unclassified race/ethnicities or OTH). These results are reported in Figure 1.
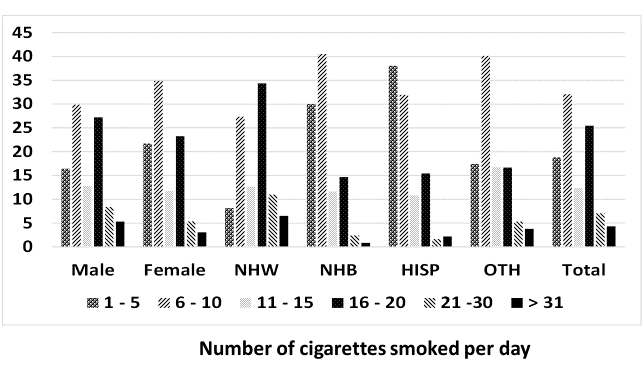
Figure 1: Percent prevalence of the number of cigarettes smoked daily by gender and race/ethnicity. Data from National Health and Nutrition Examination Survey 2007 - 2012.
In the third phase of the analysis, SAS Proc SURVEYREG was used to compare unadjusted geometric means (UGM) for the log10 transformed values of both SCOT and NNAL by gender, race/ethnicity, CIGL (regular or REG, king or KING, long or LONG, ultra-long or ULONG), CIGF (no filter or NFL, filter or FL), CMS (not mentholated or NMN, mentholated or MN), TTFC ( within 5 minutes or M5, between 6 - 30 minutes or M30, between 31 - 60 minutes or M60, > 60 minutes or MHR). These results are provided in Table 3.
Table 3: Unadjusted geometric means (UGM) with 95% confidence intervals (95% CI) for serum cotinine and urinary NNAL by gender, race/ethnicity, and characteristics of the cigarettes smoked for daily cigarette smokers. Data from National Health and Nutrition Examination Survey 2007 - 2012.
| Serum Cotinine in ng/mL | Urinary NNAL in pg/mL | |||
|---|---|---|---|---|
| UGM (95% CI) | Statistically Significant Differences | UGM (95% CI) | Statistically Significant Differences | |
| Male (M) | 223.1 (212 - 234.9) | 286.6 (262.2 - 313.3) | ||
| Female (F) | 214.1 (204.8 - 223.8) | 285.5 (262.1 - 311) | ||
| Non-Hispanic White (NHW) | 224.1 (216.1 - 232.5) | NHW < NHB (p = 0.01), NHW > HISP (p < 0.01) | 302.1 (277.8 - 328.6 ) | NHW > NHB (p = 0.03), NHW > HISP (p < 0.01) |
| Non-Hispanic Black (NHB) | 247.3 (231.6 - 264.2) | NHB > HISP (p < 0.01), NHB > OTH (p = 0.02) | 264.9 (244.3 - 287.2 ) | NHB > HISP (p = 0.02) |
| Hispanic (HISP) | 154.2 (136.7 - 173.9 ) | HISP < OTH (p < 0.01) | 215.1 (182.4 - 253.7 ) | |
| Other race/ethnicity (OTH) | 205.9 (176.6 - 240.2) | 264.1 (227.5 - 306.6) | ||
| No Cigarette Filter (NFL) | 234.7 (192.1 - 286.7) | 257.5 (196.3 - 337.7) | ||
| Cigarette Filter (FL) | 224 (215.6 - 232.8) | 290.3 (269.7 - 312.4) | ||
| Cigarette Length Regular (REG) | 214.3 (188.8 - 243.3) | REG < LONG (p = 0.02) | 296.5 (247.4 - 355.4) | |
| Cigarette Length King (KING) | 212.5 (202.5 - 222.9) | KING < LONG (p < 0.01) | 271.5 (245.6 - 300.2) | KING < LONG (p < 0.01) |
| Cigarette Length Long (LONG) | 246.8 (235.9 - 258.3) | 315.8 (290.7 - 343) | ||
| Cigarette Length Ultra Long (ULONG) | 217.1 (165.1 - 285.6) | 341.1 (256 - 454.5) | ||
| Not mentholated (NMN) | 227.4 (216.3 - 239) | 308.6 (280.1 - 340.1) | NMN > MN (p = 0.02) | |
| Mentholated (MN) | 216.4 (203.4 - 230.3) | 250 (220.8 - 283.1) | ||
| First Cigarette < 5 min (M5) | 280.5 (267.8 - 293.7) | M5 > M30 > M60 > MHR (p < 0.01) | 389.8 (353.2 - 430.1) | M5 > M30 (p < 0.01), M5 > M60 (p < 0.01), M5 > MHR (p < 0.01) |
| irst Cigarette 6 - 30 min (M30) | 248.6 (237.7 - 260 ) | 319.5 (286.3 - 356.6) | M30 > MHR (p < 0.01) | |
| First Cigarette 31 - 60 min (M60) | 210.4 (193.8 - 228.3) | 276 (241.2 - 315.9) | M60 > MHR (p < 0.01) | |
| First Cigarette > 60 min (MHR) | 136.7 (122.9 - 152) | 169 (138.7 - 205.9) | ||
Fourth phase of the analysis was used to fit two multivariate regression models by using SAS Proc SURVEYREG. First model used log10 transformed values of SCOT as the dependent variable and the second model used log10 transformed values of NNAL as the dependent variable. Categorical independent variables used in both models were gender and race/ethnicity. Continuous variables used in both models were: age, age2, CPD, CPD2, poverty income ratio (PIR) as the surrogate measure for socioeconomic status, CFM carbon monoxide, CFM nicotine, and body mass index (BMI). Ordinal variables used in both models were ETS_Work (yes, no), ETS_Home (yes, no), CIGL, CIGF, CMS, and TTFC. For the model for NNAL only, urine creatinine was also used as a continuous independent variable. Results for adjusted geometric means (AGM) are provided in Table 4 and for the association of SCOT and NNAL with all continuous and ordinal variables in Table 5. It should be noted that the interaction term between gender and race/ethnicity was also tested for statistical significance but since it was not found to be statistically significant for either of the two models, interaction term was not included in the final regression models for which data are presented in Tables 4 and 5. It should be noted that CFM tar was also considered for analysis but because of the high correlation between CFM tar and CFM nicotine in the same model could result in multicollinearity; duplicate models replacing CFM nicotine with CFM tar were also fitted.
Table 4: Adjusted geometric means (AGM) with 95% confidence intervals (95% CI) by gender and race/ethnicity for serum cotinine and urinary NNAL. Data from National Health and Nutrition Examination Survey 2007 - 2012.
| Serum Cotinine in ng/mL | Urinary NNAL in pg/mL | |||
|---|---|---|---|---|
| AGM (95% CI) | Statistically Significant Differences | AGM (95% CI) | Statistically Significant Differences | |
| Male (M) | 233.1 (182.9 - 297.1) | 258 (162.1 - 410.7) | M < F (p < 0.01) | |
| Female (F) | 241.3 (189.1 - 307.9) | 360.5 (226.7 - 573.3) | ||
| Non-Hispanic White (NHW) | 218.4 (170.8 - 279.4) | NHW < NHB (p < 0.01) | 334.9 (214.9 – 522.0) | NHW > NHB (p < 0.01) |
| Non-Hispanic Black (NHB) | 294.1 (232.8 - 371.5) | NHB > HISP (p < 0.01) | 258.5 (157.0 - 425.5) | NHB < HISP ( p = 0.02) |
| Hispanic (HISP) | 217.9 (167.0 - 284.3 ) | 324.1 (202.9 - 517.8) | ||
| Other race/ethnicity (OTH) | 226.1 (174.2 - 293.4) | OTH < NHB (p < 0.01) | 308.3 (189.9 - 500.6) | |
Table 5: Estimated regression slopes (β) with p-values for various independent variables when log10 transformed values of serum cotinine and urinary NNAL were used as dependent variables. Data from National Health and Nutrition Examination Survey 2007 - 2012.
| Serum Cotinine | Urinary NNAL | |||
|---|---|---|---|---|
| β | p | β | p | |
| Age | 0.0142805 | < 0.01 | 0.0222045 | < 0.01 |
| Age2 | -0.00014468 | < 0.01 | -0.00020044 | < 0.01 |
| CPD* | 0.0200977 | < 0.01 | 0.0214768 | < 0.01 |
| CPD² | -0.00029773 | < 0.01 | -0.00025637 | < 0.01 |
| ETS_Work** | -0.035322 | 0.06 | -0.048292 | 0.04 |
| ETS_Home*** | -0.04245 | < 0.01 | -0.071636922 | 0.01 |
| Cigarette Length^ | 0.0168801 | 0.19 | 0.0387528 | 0.04 |
| CFM Nicotine^^ | 0.059235 | 0.03 | -0.142058296 | 0.01 |
| Time to first cigarette¹ | -0.039156 | < 0.01 | -0.035437 | 0.01 |
| Cigarette Filter² | 0.172606005 | 0.04 | 0.0284615 | 0.74 |
| CMS³ | -0.01321 | 0.41 | -0.089580652 | 0.01 |
| CFM CO4 | 0.000491235 | 0.86 | 0.0113942 | 0.02 |
| Poverty Income Ratio | -0.0010815 | 0.80 | -0.011862 | 0.06 |
| Body Mass Index | -0.008063 | < 0.01 | -0.00093836 | 0.51 |
| Urinary Creatinine | 0.00302765 | < 0.01 | ||
| N used | 1441 | 1459 | ||
| R² | 32.8% | 44.9% | ||
*CPD = Number of cigarettes smoked per day on the days they were smoked
**ETS_Work (yes vs. no) = Exposure to Environmental Tobacco Smoke at work
***ETS_Home (yes vs. no) = Exposure to Environmental Tobacco Smoke at home
^Cigarette Length was coded as 1= Regular, 2 = king, 3 = Long, 4 = Ultra Long
^^Cambridge Filter Method nicotine per cigarette
1Time to first cigarette was coded as 1 = within 5 minutes, 2 = 6 to 30 minutes, 3 = 31 to 60 minutes, 4 = > 1 hour after waking up
2Cigarette filter was coded as 0 = no filter, 1 = filter
3Cigarette mentholation status was coded as 0 = non-menthol, 1 = menthol
4Cambridge Filter Method carbon monoxide content.
In the fifth and final phase of the study, regression models were fitted to investigate association of both SCOT and NNAL with CPD separately for the total population, males, females, NHW, NHB, and HISP. In each model, as the case may be, the dependent variable was the log10 transformed values of SCOT or NNAL. There were two continuous independent variables in each model, namely, CPD and CPD². Model predicted values of log10 transformed SCOT or NNAL were then transformed back to the original scale and mean of these predicted values in original scale was computed for each distinct value of CPD. These mean predicted values of SCOT and NNAL on the y-axis were plotted against CPD on the x-axis. These results are provided in Figures 2 and 3. The estimated regression slopes for CPD and CPD² with 95% confidence intervals and associated p-values are presented in Appendix. Table S1.
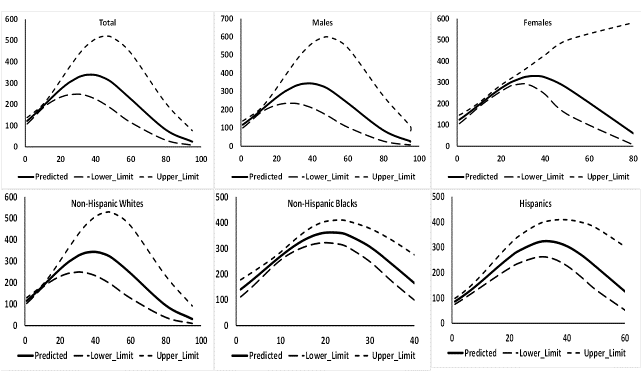
Figure 2: Predicted values of serum cotinine with 95% confidence intervals in ng/mL by number of cigarettes smoked daily (CPD) when CPD and CPD² were used as independent variables in regression models. Data from National Health and Nutrition Examination Survey 2007 - 2012.
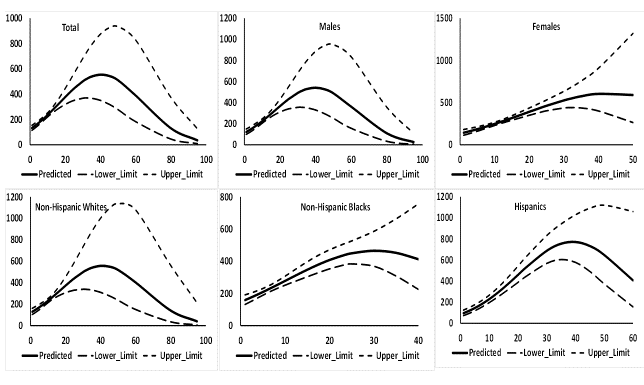
Figure 3: Predicted values of urinary NNAL with 95% confidence intervals in ng/mL by number of cigarettes smoked daily (CPD) when CPD and CPD² were used as independent variables in regression models. Data from National Health and Nutrition Examination Survey 2007 - 2012.
Table S1: Regression slopes (β) with 95% confidence intervals for the regression models fitted with log10 transformed values of serum cotinine and urinary NNAL with number of cigarettes smoked daily (CPD) and CPD² as the independent variables for the data from National Health and Examination Survey 2007-2012.
| Dependent Variable | Demographic Group | Effect | β (95% CI) | p |
|---|---|---|---|---|
| Log10 (Serum Cotinine) | Total | Intercept | 2.06081 (2.00246 - 2.119161) | < 0.01 |
| CPD | 0.02536 (0.019575 - 0.031145) | < 0.01 | ||
| CPD² | -0.000342 (-0.000467 - -0.000216) | < 0.01 | ||
| Males | Intercept | 2.045476 (1.968716 - 2.122236) | < 0.01 | |
| CPD | 0.025911 (0.01874 - 0.033081) | < 0.01 | ||
| CPD² | -0.000341 (-0.000485 - -0.000197) | < 0.01 | ||
| Females | Intercept | 2.070123 (1.991383 - 2.148863) | < 0.01 | |
| CPD | 0.025611 (0.016067 - 0.035154) | < 0.01 | ||
| CPD² | -0.000366 (-0.000622 - -0.000109) | < 0.01 | ||
| Non-Hispanic Whites | Intercept | 2.040023 (1.984851 - 2.095195) | < 0.01 | |
| CPD | 0.025669 (0.020117 - 0.03122) | < 0.01 | ||
| CPD² | -0.000331 (-0.000452 - -0.00021) | < 0.01 | ||
| Non-Hispanic Blacks | Intercept | 2.107433 (1.991487 - 2.223378) | < 0.01 | |
| CPD | 0.042268 (0.02694 - 0.057597) | < 0.01 | ||
| CPD² | -0.000988 (-0.001405 - -0.00057) | < 0.01 | ||
| Hispanics | Intercept | 1.900366 (1.838112 - 1.96262) | < 0.01 | |
| CPD | 0.037036 (0.028667 - 0.045404) | < 0.01 | ||
| CPD² | -0.000561 (-0.000781 - -0.000342) | < 0.01 | ||
| Other Race/Ethnicities | Intercept | 2.003221 (1.778405 - 2.228038) | < 0.01 | |
| CPD | 0.032764 (0.010453 - 0.055076) | < 0.01 | ||
| CPD² | -0.000559 (-0.001011 - -0.000107) | 0.02 | ||
| Log10 (Urinary NNAL) | Total | Intercept | 2.091326 (2.020584 - 2.162068) | < 0.01 |
| CPD | 0.032344 (0.025831 - 0.038857) | < 0.01 | ||
| CPD² | -0.000401 (-0.000541 - -0.00026) | < 0.01 | ||
| Males | Intercept | 2.051945 (1.955469 - 2.148421) | < 0.01 | |
| CPD | 0.034276 (0.026768 - 0.041784) | < 0.01 | ||
| CPD² | -0.000431 (-0.00056 - -0.000302) | < 0.01 | ||
| Females | Intercept | 2.128334 (2.014366 - 2.242302) | < 0.01 | |
| CPD | 0.03013 (0.016842 - 0.043419) | < 0.01 | ||
| CPD² | -0.000345 (-0.000684 - -6E-6) | 0.047 | ||
| Non-Hispanic Whites | Intercept | 2.079834 (1.976655 - 2.183013) | < 0.01 | |
| CPD | 0.03249 (0.023752 - 0.041229) | < 0.01 | ||
| CPD² | -0.000396 (-0.000568 - -0.000224) | < 0.01 | ||
| Non-Hispanic Blacks | Intercept | 2.167699 (2.072351 - 2.263046) | < 0.01 | |
| CPD | 0.033074 (0.017253 - 0.048896) | < 0.01 | ||
| CPD² | -0.000547 (-0.001023 - -0.000071) | 0.03 | ||
| Hispanics | Intercept | 1.935271 (1.807949 - 2.062594) | < 0.01 | |
| CPD | 0.048927 (0.036235 - 0.061618) | < 0.01 | ||
| CPD² | -0.000628 (-0.000904 - -0.000352) | < 0.01 | ||
| Other Race/Ethnicities | Intercept | 2.094605 (1.940974 - 2.248235) | < 0.01 | |
| CPD | 0.033652 (0.015439 - 0.051865) | < 0.01 | ||
| CPD² | -0.000542 (-0.001015 - -0.000068) | 0.03 |
Results
Basic statistics
There was a bias in self-reported CPD in favor of reporting in multiples of five. Of the 2339 participants for whom CPD data were available, 72.2% reported smoking CPDs in multiples of five. Except for HISP, smoking 6 - 10 CPD was the most prevalent frequency of CPD (17.4% to 40.5%, Figure 1). For HISP, smoking 1 - 5 CPD was the most prevalent frequency of CPD (38%) followed by smoking 6 - 10 CPD (32%, Figure 1). Frequency of > 30 CPD varied from 0.9% for NHB to 6.5% for NHW (Figure 1).
Correlations between the levels of SCOT and NNAL varied by CPD (Table 2). The highest correlation was observed when CPD was 1 - 5 (Pearson r = 0.58, Spearmen’s r = 0.57, Table 2). Pearson and Spearman’s correlations remained more or less stable or > 0.3 when CPD was 6 - 10 and 11 - 15. Spearman’s correlation was reduced to 0.24 when CPD was 16 - 20 but Pearson’s correlation was still 0.34. When CPD was 21 - 30, both Pearson and Spearman’s correlations were down to 0.13 and 0.11 respectively. When CPD was > 30, the correlations increased to 0.20 and 0.27 respectively.
Univariate analysis
Gender did not affect the levels of ether SCOT or NNAL (Table 3). NHW had lower UGM than NHB for SCOT (p = 0.01, Table 3) but higher UGM than NHB for NNAL (p = 0.03, Table 3). Both NHW and NHB had higher UGMs for SCOT as well as NNAL than HISP (p ≤ 0.02, Table 3).
Cigarettes with a filter did not affect the levels of SCOT and NNAL. Long cigarettes as compared to king size cigarettes were associated with higher levels of both SCOT and NNAL (p < 0.01, Table 3). While CMS did not affect the levels of SCOT, non-menthol cigarettes were associated with higher UGM for NNAL (308.6 vs. 250.0 pg.mL for a difference of about 25%, p < 0.01, Table 3). Inverse association with TTFC and both SCOT and NNAL was observed (p < 0.01, Table 3). For example, when TTFC was within 5 minute after waking up, UGMs for SCOT and NNAL were 280.5 ng/mL and 389.8 pg/mL respectively. Compared to this when TTFC was between 31 and 60 minutes after waking up, UGMs for SCOT and NNAL were 210.4 ng/mL (for a difference of 33.3%) and 276.0 pg/mL (for a difference of 41%) respectively.
Multivariate analysis
Impact of gender and race/ethnicity: While gender did not affect AGMs for SCOT, males were found to have lower AGMs for NNAL (258.0 vs. 360.5 pg/mL, p < 0.01). While NHW had lower AGMs than for females for SCOT (218.4 vs. 294.1 ng/mL, p < 0.01, Table 4), the reverse was true for NNAL (334.9 pg/mL for NHW, 258.5 pg/mL for NHB, p < 0.01, Table 4). Similarly, while NHB were found to have higher levels of SCOT than HISP (294.1 vs. 217.9 ng/mL), the reverse was true for NNAL (258.5 pg/mL for NHB and 324.1 pg/mL for HISP, Table 4).
Impact of age: While the levels of both SCOT (β = 0.014, p < 0.01, Table 5) and NNAL (β = 0.022, p < 0.01, Table 5) increased with age, the increase slowed down with increase in age since β was negative for age2 for both SCOT and NNAL (p < 0.01, Table 5).
Impact of CPD: There was a statistically significant increase in the levels of both SCOT (β = 0.020, p < 0.01, Table 5) and NNAL (β = 0.021, p < 0.01, Table 5) with increase in CPD but this increase slowed down with increasing CPD since CPD2 had a statistically significant negative β for both SCOT (β = -0.0003, p < 0.01, Table 5) and NNAL (β = -0.00026, p < 0.01, Table 5).
Impact of exposure to ETS: No exposure to ETS at home was associated with lower levels of SCOT (β = -0.042, p < 0.01, Table 5) and no exposures to ETS both at work (β = -0.048, p = 0.04, Table 5) and home (β = -0.072, p = 0.01, Table 5) were associated with lower levels of NNAL.
Impact of cigarette characteristics: Cigarette length did not affect the levels of SCOT but NNAL levels were positively associated with cigarette length (β = 0.039, p = 0.04, Table 5). Cigarettes with a filter were associated with higher levels of SCOT (β = 0.173, p = 0.04, Table 5) but the levels of NNAL were not affected. On the other hand, while CMS did not affect the levels of SCOT, mentholated cigarettes were associated with higher levels of NNAL (β = 0.09, p = 0.01, Table 5).
Higher levels of CFM nicotine were associated with higher levels of SCOT (β = 0.059, p = 0.03, Table 5) but lower levels of NNAL (β = -0.142, p = 0.01, Table 5). CFM carbon monoxide levels were associated with higher levels of NNAL (β = 0.011, p = 0.02, Table 5). CFM tar was not found to be associated with the levels of either SCOT (p = 0.15) or NNAL (p = 0.16).
Impact of PIR and BMI: PIR did not affect the levels of either SCOT or NNAL. BMI did not affect the levels of NNAL (p = 0.51) but BMI was negatively associated with the levels of SCOT (β = -0.008, p < 0.01, Table 5).
Special study: association of SCOT and NNAL with CPD by gender and race/ethnicity
Increase in log10 transformed values of SCOT with a unit increase in CPD was about 0.025 to 0.026 ng/mL for total sample, males, females, and NHW (p < 0.01, Table S1) and decrease in log10 transformed values of SCOT with increase in a unit value of CPD2 was about 0.0003 ng/mL. However, increase in log10 transformed values of SCOT with a unit increase in CPD was substantially higher for NHB (0.042 ng/mL) and HISP (0.037 ng/mL, Table S1) and decrease in log10 transformed values of SCOT with a unit increase in CPD2 was substantially lower for NHB (0.001 ng/mL) and for HISP (0.0006 ng/mL, Table S1). Consequently, while mean predicted values of SCOT continued increasing for males, females, and NHW till CPD was about 30 (Figure 2), mean predicted values of SCOT continued increasing for NHB till CPD was about 15 and for HISP, till CPD was about 22 or 23 (Figure 2). A net decreasing trend in mean predicted values of SCOT was seen for males, females, and NHW when CPD was about 50 and for NHB when CPD was about 25 and for HISP when CPD was about 40 (Figure 2).
Increase in log10 transformed values of NNAL with a unit increase in CPD varied between 0.032 to 0.034 pg/mL for total sample, males, NHB, and NHW (p < 0.01, Table S1) and decrease in log10 transformed values of SCOT with increase in a unit value of CPD2 was 0.0004 or 0.0005 pg/mL. However, increase in log10 transformed values of NNAL with a unit increase in CPD was substantially higher for HISP (0.049 pg/mL, Table S1) and decrease in log10 transformed values of NNAL with a unit increase in CPD2 was also substantially higher for HISP (0.0006 ng/mL, Table S1). Consequently, while mean predicted values of NNAL continued increasing for total sample, males, females, and NHW till CPD was about 30 (Figure 3), mean predicted values of SCOT continued increasing for NHB till CPD was about 15 and for HISP, till CPD was about 25 (Figure 3). A net decreasing trend in mean predicted values of NNAL was seen for males, females, and NHW when CPD was about 50 and for NHB when CPD was about 25 and for HISP when CPD was about 50 (Figure 3).
Special study: Model based association between SCOT and NNAL
A model for the log10 transformed values of NNAL as the dependent variable and log10 transformed values of SCT, urine creatinine and CPD as independent variables was fitted (R² = 41.5%, βurine creatinine = 0.002512 (SE = 0.00009), βCPD = 0.00876 (SE = 0.0008), βlog10(SCOT) = 0.6714 (SE = 0.0274)). Model fit was reasonably good with some relatively large variability in residual towards the high values of values of log10 (SCOT). The model fit is presented in Figure 4. For each unit change in log10 (SCOT), there was a 0.6714 ng/mL change in log10 (NNAL).
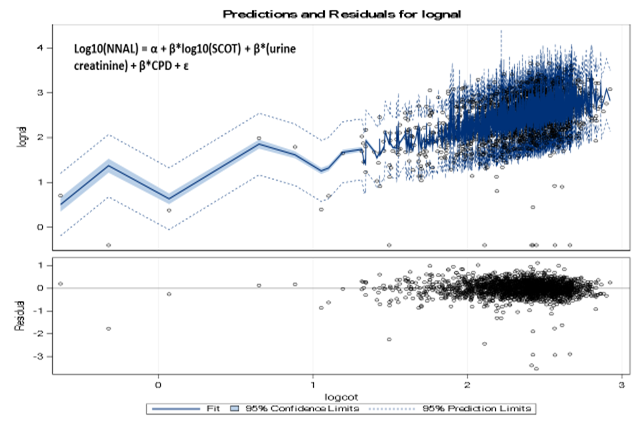
Figure 4: Predicted values of log10 (NNAL) with log10 (SCOT).
Discussion
Variability in the levels of SCOT and NNAL with CPD
Rostron (2013) reported differences in the patterns by race/ethnicity with which NNAL and SCOT levels vary with CPD. Similar results were observed in this study (Figure 2 and 3) for both SCOT and NNAL. Rostron (2013) reported NNAL levels to continue increasing up to 15 CPD and then level off for NHB but continued increase after 15 CPD for NHW. Irrespective of race/ethnicity, SCOT levels were reported to level off after CPD was 15 (Rostron, 2013). For this study, leveling off of SCOT levels was not reached till CPD was 30 for NHW, 15 for NHB, and about 22 or 23 for HISP. Differences in statistical methodology used by Rostron (2013) and this study may be the reason. However, in this study, SCOT levels were found to decrease after CPD was about 50 for NHW, 25 for NHB, and 45 for HISP. Similar decreases were observed for NNAL when CPD was about 60 for NHW, 35 for NHB, and 50 for HISP. There is a certain possibility that relatively small sample sizes (N = 69) when CPD was above 30, in particular for NHB (N = 5) and HISP (N = 8) may have been responsible for this observed inverse association between CPD and SCOT as well as NNAL. However, for NHW, sample size (N = 82) when CPD > 30 was quite healthy and inverse association between CPD and SCOT as well as NNAL was still observed (Figure 2 and 3). Consequently, an explanation other than small sample size should be sought for the inverse association between CPD and SCOT as well as NNAL. While this is a speculation, is it possible that CPD beyond a certain level may accelerate excretion of both SCOT and NNAL? More work is needed in this area.
Since, percent menthol cigarette smokers were substantially higher among NHB (68.3%) as compared to NHW (22.3%) and HISP (30.7%), the possibility that cigarette mentholation may affect association of SCOT and NNAL with CPD was considered in a side study. Association between CPD and SCOT for NHB menthol cigarette smokers is shown in Figure S1 and between CPD and NNAL in Figure S 2. While it is not quite clear, SCOT concentrations leveled off when CPD was about 35 (Figure S1) but this leveling off of the concentrations for NNAL was not observed (Figure S 2). Thus, the possibility that CMS may affect the association between SCOT and NNAL with CPD cannot be ruled out but more work, probably based in a laboratory is needed in this area.
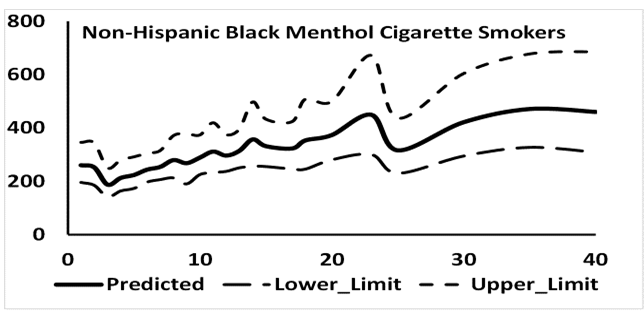
Figure S1: Number of mentholated cigarettes smoked per day by mean predicted values of serum cotininein ng/mL for non-Hispanic blacks.
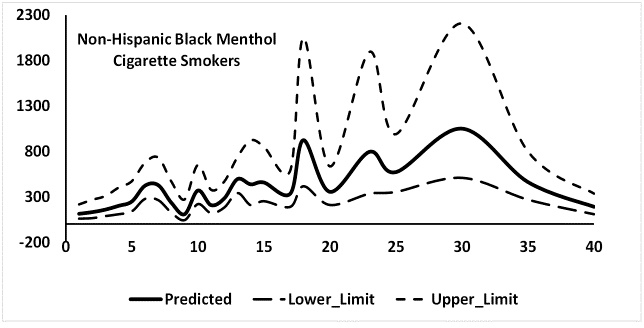
Figure S2: Number of mentholated cigarettes smoked per day by mean predicted values of urinary NNAL in ng/mL for non-Hispanic blacks.
Association of CPD with SCOT and NNAL when adjusted for the effect of all other factors including gender and race/ethnicity (Figure S3) had leveling off the levels of SCOT when CPD was about 30 and for NNAL, when CPD was about 35. However, in both cases, the direction of association between CPD was revered when CPD was about 50 for SCOT and about 60 for NNAL. Once again small sample sizes at higher levels of CPD may have a role to play
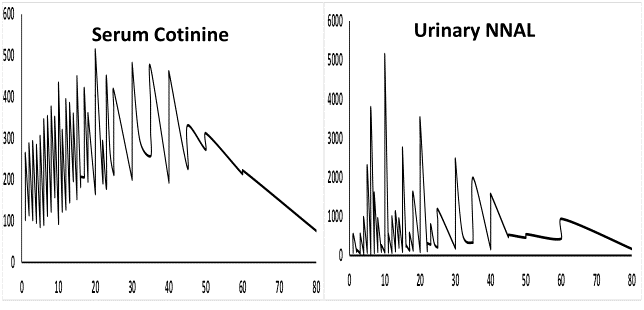
Figure S3: Adjusted Serum cotinine and NNAL levels by the number of cigarettes smoked per day.
Impact of gender and race/ethnicity
Based on the analysis of NHANES 1999 - 2002 data, Gan et al. (2008) reported males to have higher AGMs for SCOT than females (p = 0.03) but Jain (2014) who used NHANES data for 1999 - 2010, did not find any statistically significant differences in AGMs between males and females. In this study also, males were not found to have statistically significant different AGMs for SCOT. Females having higher AGMs for NNAL than males has previously been reported by Xia et al. (2011), Czoli et al. (2015), and Jain (2015a) and the same was observed in this study. On the other hand, Branstetter et al. (2013) did not find the observed gender differences for NNAL among adult smokers.
NHW having lower AGMs for SCOT when compared with NHB has previously been reported by Jain (2014) and Rostron (2013) among others and NHW having higher AGMs for NNAL than NHB has been reported by Jain (2015a) and Rostron (2013) and the same was observed in this study. This reversal in the direction of differences between NHW and NHB has been attributed to differences in how NHW and NHB excrete SCOT and NNAL respectively.
Impact of age
The net effect of a positive slope for linear term and a negative slope for a quadratic term should be carefully considered. The net effect may be positive and negative depending upon the magnitudes of respective slopes. In the present case, the magnitude of negative slope for quadratic term was so small, for example, 0.0222 for the linear term and 0.0002 for the quadratic term for NNAL (Table 4), that the net effect remained an increase in the levels of both SCOT and NNAL for a unit increase in age. However, at a certain age, the net increase in SCOT and/or NNAL levels may be smaller than for the age prior to that. For example, for SCOT, the net increase in log10 transformed values of SCOT at the ages of 30, 40, and 50 years was 0.298, 0.340, and 0.352 ng/mL respectively for one unit increase in age but then, at the ages of 55, 60, and 70, this net increase was found to be 0.348, 0.335, 0.291 ng/mL respectively. Similarly, for NNAL, the net increase in log10 transformed values of SCOT at the ages of 30, 40, 50, and 55 years was 0.486, 0.567, 0.609, and 0.615 pg/mL respectively for one unit increase in age but then, at the ages of 60 and 70, this net increase was found to be 0.611 and 0.572 pg/mL respectively. Xia et al. (2011) did not find a statistical significant association between age and NNAL levels which may be because Xia et al. (2011) used data for all those aged ≥ 12 years while this study used data for all those aged ≥ 20 years.
Impact of TTFC
It was no surprise that TTFC was found to be inversely associated with adjusted levels of both SCOT and NNAL since similar results have also been reported by Branstetter et al. (2013, 2014).
Impact of CFM nicotine and tar
Positive association between CFM nicotine and adjusted levels of SCOT observed here was similar to what was reported by Jain (2014). While Xia et al. (2011) did report a positive association between SCOT and adjusted levels of NNAL among smokers, this is the first time, as far as it can be determined, that association between CFM nicotine and adjusted levels of NNAL has been investigated and it was found to be positive as could be expected. The finding that CFM tar levels did not affect the levels of SCOT and NNAL should not be surprising because NNAL levels were not found to differ among users of light and regular cigarettes (Bernert et al., 2005) and similar results were reported by Hecht et al. (2005). This may be because of differences in smoking behavior like taking long, deep, and/or frequent puffs may make exposure to tar from light cigarettes as high as from a regular cigarette (http://www.cancer.gov/about-cancer/causes-prevention/risk/tobacco/light-cigarettes-fact-sheet). However, Jain (2014), who used NHANES data from 1999 - 2010 did report higher levels of CFM tar associated with higher adjusted levels of SCOT. It is not known why the results of this study became discordant with the results reported by Jain (2014). Probably, a much larger dataset used by Jain (2014) may be the reason since large sample sizes may render even small differences statistically significantly.
Impact of exposure to ETS
Usually, impact of exposure to ETS is investigated among nonsmokers and not among smokers but Jain (2014) did evaluate the impact of exposure to ETS at home and work on the adjusted levels of SCOT among daily cigarette smokers. This study used a subset of the data used by Jain (2014) and re-confirmed the positive association between exposures to ETS at home with SCOT but no association due to exposure to ETS at work was reported. On the other hand, a positive association between exposure to ETS at home as well as at work was observed with adjusted levels of NNAL. Branstetter et al. (2013) also reported a positive association between exposure to ETS at home and adjusted levels of NNAL among adult smokers.
Impact of cigarette characteristics
Jones et al. (2013) did not find adjusted levels of SCOT to be affected by CMS. This study as well as Jain (2014) found similar results. Xia et al (2011) did not find CMS to affect the levels of NNAL but Rostron et al. (2013) reported menthol cigarette smokers to have lower NNAL levels than non-menthol smokers. In accordance with what was reported by Rostron et al. (2013), smoking mentholated cigarettes was found to be associated with lower adjusted levels of NNAL.
CIGL, in general, was found to have a positive association with NNAL (p = 0.04) which makes sense but this association was not found to be statistically significant (p = 0.19) for SCOT which does not make sense. The later results are contrary to what was reported by Agaku et al. (2014) since SCOT levels among current adult smokers were reported to be higher among those who used long/ultra-long cigarettes than those who used regular/king size cigarettes. Differences in study design may be the reason for this. It is unknown but possible that, instead of using CIGL as an ordinal variable, if CIGL was used as a categorical variable, the results could have been different but having too many data cells could have negatively affected the stability of the model.
Conclusion
Use of filtered cigarettes was found to be associated with higher adjusted levels of SCOT (p = 0.04) but CIGF did not affect the adjusted levels of NNAL. Vent blocking and other smoking related behavioral characteristics could explain this observation.
Conflict of interest:
Author declares that he has no financial or other conflicts that could have affected the conclusions arrived at in this communication. All data used in this research are available free of charge at www.cdc.gov/nchs/nhanes.htm.
References
- 1. Agaku, I.T., Vardavas, C.I., Connolly, G.N. Cigarette rod length and its impact on serum cotinine and urinary total NNAL levels, NHANES 2007-2010. (2014) Nicotine Tob Res 16(1): 100-107.
- 2. Barr, D.B., Wilder, L.C., Caudill, S.P., et al. Urinary creatinine concentrations in the U.S. population: implications for urinary biologic monitoring measurements. (2005) Environ Health Perspect 113(2): 192-200.
- 3. Benowitz, N., Goniewicz, M.L., Eisner, M.D., et al. Urine cotinine underestimates exposure to the tobacco-derived lung carcinogen 4-(methylnitrosamino)-1-(3-pyridyl)-1-butanone in passive compared with active smokers. (2010) Cancer Epidemiol Biomarkers Prev 19(11): 2795-2800
- 4. Benowitz, N.L., Dains, K.M., Dempsey, D., et al. Racial differences in the relationship between number of cigarettes smoked and nicotine and carcinogen exposure. (2011) Nicotine Tob Res 13(9): 772-783.
- 5. Bernert, J.T., Jain, R.B., Pirkle, J.L, et al. Urinary tobacco-specific nitrosamines and 4-aminobiphenyl hemoglobin adducts measured in smokers of either regular or light cigarettes. (2005) Nicotine Tob Res 7(5): 729-738.
- 6. Bernert, J.T., Pirkle, J.L., Xia, Y., et al. Urine concentrations of a tobacco-specific nitrosamine carcinogen in the U.S. population from secondhand smoke exposure. (2010) Cancer Epidemiol Biomarkers Prev 19(11): 2969-2977.
- 7. Branstetter, S.A., Muscat, J.E. Time to first cigarette and 4-(methylnitrosamino)-1-(3-pyridyl)-1-butanol (NNAL) levels in adult smokers; National Health and Nutrition Examination Survey (NHANES), 2007-2010. (2013) Cancer Epidemiol Biomarkers Prev 22(4): 615-622.
- 8. Branstetter, S.A., Mercincavage, M., Muscat, J.E. Time to first cigarette predicts 4-(methylnitrosamino)-1-(3-pyridyl)-1-butanol (NNAL) in adolescent regular and intermittent smokers, National Health and Nutrition and Examination Survey (NHANES) 2007-10. (2014) Addiction 109(6): 1005-1012.
- 9. Chen, J., Kettermann, A., Rostron, B.L., et al. Biomarkers of exposure among U.S. cigar smokers: an analysis of 1999-2012 National Health and Nutrition Examination Survey (NHANES) data. (2014) Cancer Epidemiol Biomarkers Prev 23(12): 2906-2915.
- 10. Czoli, C.D., Hammond, D. TSNA Exposure: Levels of NNAL among Canadian Tobacco Users. (2015) Nicotine Tob Res 17(7): 825-830.
- 11. Derby, K.S., Cuthrell, K., Caberto, C., et al. Exposure to the carcinogen 4-(methylnitrosamino)-1-(3-pyridyl)-1-butanone (NNK) in smokers from 3 populations with different risks of lung cancer. (2009) Int J Cancer 125(10): 2418-2424.
- 12. Florek, E., Piekoszewski, W., Basior, A., et al. Effect of maternal tobacco smoking or exposure to second-hand smoke on the levels of 4-(methylnitrosamino)-1-(3-pyridyl)-1-butanol (NNAL) in urine of mother and the first urine of newborn. (2011) J Physiol Pharmacol 62(3): 377-383.
- 13. Gan, W.Q., Cohen, S.B., Man, S.F., et al. Sex-related differences in serum cotinine concentrations in daily cigarette smokers. (2008) Nicotine Tob Res 10(8): 1293-1300.
- 14. Hecht, S.S., Murphy, S.E., Carmella, S.G., et al. Similar uptake of lung carcinogens by smokers of regular, light, and ultra light cigarettes. (2005) Cancer Epidemiol Biomarkers Prev 14 (3): 693-698.
- 15. Hecht, S.S., Carmella, S.G., Murphy, S.E., et al. similar exposure to a tobacco-specific carcinogen in smokeless tobacco users and cigarette smokers. (2007) Cancer Epidemiol Biomarkers Prev 16(8): 1567-1572.
- 16. Heck, J.D. Smokers of menthol and non menthol cigarettes exhibit similar levels of biomarkers of smoke exposure. (2009) Cancer Epidemiol Biomarkers Prev 18(2): 622-629.
- 17. Hertsgaard, L.A., Hanson, K., Hecht, S.S., et al. Exposure to a tobacco-specific lung carcinogen in adolescent versus adult smokers. (2008) Cancer Epidemiol Biomarkers Prev 17(12): 3337-3343.
- 18. Jain, R.B. Trends in serum cotinine concentrations among daily cigarette smokers: data from NHANES 1999-2010. (2014) Sci Total Environ 472: 72-77.
- 19. Jain, R.B. Serum cotinine and urinary 4-(methylnitrosamino)-1-(3-pyridyl)-1-butanonol levels among non-Hispanic Asian American smokers and nonsmokers as compared to other race/ethnicities: data from NHANES 2011-2012. (2015a) Chemosphere 120: 584-591.
- 20. Jain, R.B. Exposure to second hand smoke at home and works among nonsmokers. (2015b) Chemosphere 135: 225-232.
- 21. Jain, R.B. Trends in exposure to second hand smoke at home among children and nonsmoker adolescents. (2016) Sci Total Environ 542: 144-152.
- 22. Jones, M.R., Apelberg, B.J., Tellez-Plaza, M., et al. Menthol cigarettes, race/ethnicity, and biomarkers of tobacco use in U.S. adults: the 1999-2010 National Health and Nutrition Examination Survey (NHANES). (2013) Cancer Epidemiol Biomarkers Prev 22(2): 224-232.
- 23. Joseph, A.M., Hecht, S.S., Murphy, S.E., et al. Relationships between cigarette consumption and biomarkers of tobacco toxin exposure. (2005) Cancer Epidemiol Biomarkers Prev 14(12): 2963-2968.
- 24. Khariwala, S.S., Scheuermann, T.S., Berg, C.J., et al. Cotinine and tobacco-specific carcinogen exposure among nondaily smokers in a multiethnic sample. (2014) Nicotine Tob Res 16(5): 600-605.
- 25. Muscat, J.E., Djordjevic, M.V., Colosimo, S., et al. Racial differences in exposure and glucuronidation of the tobacco-specific carcinogen 4-(methylnitrosamino)-1-(3-pyridyl)-1-butanone (NNK). (2005) Cancer 103(7): 1420-1426.
- 26. Muscat, J.E., Chen, G., Knipe, A., et al. Effects of menthol on tobacco smoke exposure, nicotine dependence, and NNAL glucuronidation. (2009) Cancer Epidemiol Biomarkers Prev 18(1): 35-41.
- 27. O’Brien, K.M., Upson, K., Cook, N.R., et al. Environmental chemicals in urine and blood: improving methods for creatinine and lipid adjustment. (2016) Environ Health Perspect 124(2): 220-227.
- 28. Richie, J.P.Jr., Carmella, S.G., Muscat, J.E., et al. Differences in the urinary metabolites of the tobacco-specific lung carcinogen 4-(methylnitrosamino)-1-(3-pyridyl)-1-butanone in black and white smokers. (1997) Cancer Epidemiol Biomarkers Prev 6(10): 783-790.
- 29. Rostron, B. NNAL exposure by race and menthol cigarette use among U.S. smokers. (2013) Nicotine Tob Res 15(5): 950-956.
- 30. Rostron, B.L., Chang, C.M., Van Bemmel, D.M., et al. Nicotine and Toxicant Exposure among U.S. Smokeless Tobacco Users: Results from 1999 to 2012 National Health and Nutrition Examination Survey Data. (2015) Cancer Epidemiol Biomarkers Prev 24(12): 1829-1837.
- 31. St. Helen, G., Bernert, J.T., Hall, D.B., et al. Exposure to secondhand smoke outside of a bar and a restaurant and tobacco exposure biomarkers in nonsmokers. (2012) Environ Health Perspect 120(7): 1010-1016.
- 32. St. Helen, G., Benowitz, N.L., Dains, K.M., et al. Nicotine and carcinogen exposure after water pipe smoking in hookah bars. (2014) Cancer Epidemiol Biomarkers Prev 23(6): 1055-1066.
- 33. Vardavas, C.I., Fthenou, E., Patelarou, E., et al. Exposure to different sources of second-hand smoke during pregnancy and its effect on urinary cotinine and tobacco-specific nitrosamine (NNAL) concentrations. (2013) Tob Control 22(3): 194-200.
- 34. Yuan, J.M., Nelson, H.H., Butler, L.M., et al. Genetic determinants of cytochrome P450 2A6 activity and biomarkers of tobacco smoke exposure in relation to risk of lung cancer development in the Shanghai cohort study. (2016) Int J Cancer 138(9): 2161-2171.
- 35. Xia, Y., Bernert, J.T., Jain, R.B., et al. Tobacco-specific nitrosamine 4-(methylnitrosamino)-1-(3-pyridyl)-1-butanol (NNAL) in smokers in the United States: NHANES 2007-2008. (2011) Biomarkers 16(2): 112-119.


