
Early Phenotypical Changes Induced By Transfer of Human Fecal Microbiotafrom Colorectal Cancer Patients to Germ-Free Mice
Julien Tap1, Aurélien Amiot1,2, Véronique Jarrousse3, Sandra Guilmeau3, Jeanne Tran VanNhieu1, Philippe Langella4, Thierry Pédron5, Jean-Pierre Furet4, André Bado3, and Iradj Sobhani1,3*
Affiliation
- 1EC2M3 University Laboratory, Université Paris-Est Créteil Val de Marne UPEC, F-94000, Créteil, France
- 2Department of Gastroenterology, Henri Mondor Hospital, APHP, Creteil, France
- 3INSERM U-773, Paris 7 Denis Diderot University, F- 75890, Paris, France
- 4Commensals and Probiotics-Host Interactions, Laboratory MICALIS, Institute INRA, UMR 1319 MICALIS, F-78350, Jouy-en-Josas, France
- 5Molecular Microbial Pathogenesis Unit, INSERM U1202, Institut Pasteur, F-75724 Paris, France
Corresponding Author
Pr. Iradj Sobhani, Hopital Henri Mondor, 51 Av Mal deLattre de Tassigny 94010 Créteil-France, Phone: 33 (1) 49 81 23 58; Fax: 33 (1) 49 81 23 52, E-mail: iradj.sobhani@hmn.aphp.fr
Citation
Sobhani, I., et al. Early Phenotypical Changes Induced By Transfer of Human Fecal Microbiota from Colorectal Cancer Patients to Germ-Free Mice. (2016) Int J Cancer Oncol 4(1): 1- 11.
Copy rights
© 2016 Sobhani, I. This is an Open access article distributed under the terms of Creative Commons Attribution 4.0 International License.
Keywords
Colorectal cancer; Fecal microbiota; Gene expression; Dysbiosis; Azoxymethane; Germ-free mice; Aberrant crypt foci
Abstract
Feces from patients with colorectal cancer (HK) and healthy individuals (HN) were inoculated orally into germ-free mice under azoxymethane (AOM) or vehicle. The fecal microbiota remained stable in germ-free (GF) mice up to 42 days after fecal transplantation. Numbers of aberrant crypt foci, levels of MATH1, and HES1 mRNAs in the colonic mucosa, were higher in HK-GF than in HN-GF mice with highest levels observed in HK-GF mice treated with AOM and significantly associated with higher Bacteroides and lower Coprococcus bacteria in stools. Thus, CRC patients’ fecal microbiota can induce early precancerous changes in the colonic mucosa in germ-free mice.
Introduction
The incidence of many cancers, including colorectal cancer (CRC) has dramatically increased over these past decades. They are so called sporadic and considered to be favored by environmental factors[1-6]. Colonic tumorogenesis is a multiple-step process resulting from the accumulation of genetic and/or chromosomic alterations which lead to the development of the adenoma-cancer sequence[7]. In animal experimental models and in human, occurrences of aberrant crypt foci (ACFs) are considered to be early colorectal pre neoplastic lesions[8-10] in patients with high risk of CRC. Quantitative changes in cell proliferation prior to the occurrence of mucosal abnormality and accumulated alterations in intracellular signaling pathways, including Wnt/β-catenin signaling, Ras signaling, and p53 signaling contribute to the initiation of the ACF-adenoma-carcinoma sequence[11]. PPARγ has also been shown to be involved in chronic inflammation and in CRC progression via the COX-2–derived PGE2 signaling axis that mediates cross-talk between tumor epithelial cells and macrophages[12].
The human intestinal microbiota contributes to the maturation of the immune system, provides a direct barrier against pathogens[13] and is involved in the metabolism of xenobiotics including pro-carcinogens and carcinogens metabolites[14]. Recent studies have suggested the contribution of the intestinal microbiota to various metabolic and inflammatory diseases[15-17]. In spite of large variations in healthy individuals[15,16], the link between western diet and higher risk of colon cancer in one hand and changes in microbiota, so-called dysbiosis in the other hand, is clearly established[6]. Recently, high throughput sequencing techniques have been used to demonstrate changes in the bacterial phylogenetic core in normal individuals and in CRC patients[18] and also demonstrate a metabolic shift in the fecal microbiota associated with CRC[19-22]. Altogether these results suggest that colorectal cancer could be affected by the environment through the intestinal microbiota[23].
However, whether dysbiosis should be considered as an early promoter for colorectal carcinogenesis or as a result of changes in the tumor microenvironment remains to be investigated. Thus, to investigate early tumour related events, we analyzed short term effects of “specific” human colorectal cancer microbiota on the intestinal mucosa by colonizing germ-free (GF) mice in basal conditions and under azoxymethane (AOM), taken as a chemical carcinogenic agent, in comparison to “human healthy” Microbiota.
Materials and Methods
Ethics Statement
All investigations were conducted according to the Animal Research Reporting of In Vivo Experiments (ARRIVE) and the French ethical legislation on animal experimentation and the protocol was approved by ethical committee of Henri Mondor Hospital (CCPPRB n°04-004). Written informed consent for fecal microbiota transfer and DNA analysis for study purposes was obtained from all patients.
Collection of human gut microbiota from patients with CRC and healthy individuals
Fresh human feces were obtained from three male healthy individuals (HN) and two male patients with CRC (HK). Feces were transported at 4°C in special sterile flasks from hospital to the laboratory and used to colonize GF adult mice, at day 0. All individuals were selected based on their colonoscopy results. None of them had antibiotics therapy, chemotherapy or bowel cleansing for colonoscopy within two weeks prior to fecal sample collection.
Animals and experimental designs
First, comparative effects of HK and HN microbiota were designed with C3H/HeN GF 8-weeks old mice receiving either colon cancer patients fresh fecal sample (HK-GF; n = 27) or normal individual fresh fecal sample (HN-GF; n = 23). Human fecal sample were homogenized in sterile saline solution and 108 to 109 bacteria were given orally to the mice that were kept in their gnotobiotic isolators up to the time of sacrifice at day 42 (“Figure S1”). Density of bacteria in the liquid given orally to animals was determined based on spectrophotometer measurement which has been calibrated according to CFU/mL for E. Coli cultivated on appropriate media. Additional effect of AOM (Sigma Chemical Co., St. Louis, MO) 8 mg/kg of body weight or NaCl solutions, administered intraperitoneally at days 14, 21, 28 and 35, was investigated HK-GF and HN-GF mices to induce ACFs without mortality as described[24]. Overall, four sets of gnotobiotic mice were then maintained in four separated gnotobiotic isolators under a strict 12 h light cycle (ANAXEM platform, INRA, Jouy-en-Josas, France) for seven weeks: one week adaptation to the laboratory conditions, followed by 6 weeks experimental period. Every week, animals were weighed and fecal samples were collected for DNA extractions and microbiota analyses. At day 42, mice were anesthetized and after sacrifice, blood, spleen tissue samples were collected. Length and thickness of the small and large bowel were measured, the colon opened, and the totality of colonic mucosa carefully pinned flat and compared in between animals by using high magnification slides. Blood Biochemical parameters were assessed at the end of the study protocol.
Histology and Pathology
Representative samples from proximal and distal ileum and from mid-sided and right-sided colons of each animal were examined. Specimens were fixed in 10% buffered formalin, embedded in paraffin, cut with a microtome at 3 – 4 μm and stained with haematoxylin-eosin (HE) and periodic acid-Schiff and Alcian blue to appreciate the amount of mucus producing cell which have been evaluated semi quantitatively on well oriented tissue slides at magnification 40 using optic microscope. Numbers of mono- or polynuclear cells, mucin cells and lymphoid follicles per animal were expressed per cm of colon. Pathological analyses were assessed by two pathologists who were blinded regarding the experimental data. Discrepancies were resolved by simultaneous reexamination of the slides using a double-headed microscope.
Pathological analysis and assessment of aberrant crypt foci (ACF)
Number of ACFs was assessed in the totality of the descending colon, in all animals as previously described[24-26]. Crypts were considered aberrant if they were at least twice the size of surrounding crypts. The isolated aberrant crypt has been considered as single. Two associated aberrant crypts and three or more aberrant associated crypts were considered as double or multiple ACF, respectively. Inter individual variations in counts were less than 5%. Numbers of ACFs per animal were expressed per cm of colons and means of two observers’ counts were considered.
Characterization of human bacteria within mice intestinal tract
Mucosal adherent bacteria were studied on frozen sections by using fluorescence in situ hybridization (FISH; “see supplementary information”) as described[27]. DNAs from fecal sample were then submitted to 16S rRNA genes targeted pyro sequencing assays for analysis of the abundance and composition of bacteria within the microbiota, respectively according to the primers described elsewhere[18]. Raw sequencing reads were cleaned and clustered into OTU at 97% similarity with Lotus software[28] using USEARCH v7 as sequences clustering software and 200 nucleotides as minimal sequence length. Real-time qPCR technique were also used to investigate the difference in bacterial densities as previously described (“table S2”)[27].
Quantitative RT-PCR of transcription factors
cDNA prepared from total RNA extracted from colon mucosa scrapings of colonized GF mice, were quantified using real-time PCR techniques. The mRNA levels of genes involved in cell renewal (Math1, Kfl4, ELF3, and HES1) and those of genes involved in inflammation (TNFα, MIP2, IL10, IL1β, IL6, IL17 and IL17R) were analyzed by using appropriate primers (“table S1”; Eurogentec SA, Angers, France).
Statistical analysis
All comparisons on data (ACF, inflammatory cells, Lymphocytes, Mucin cells, RNA levels as assessed by qPCR, etc) have been established using χ², Mann and Whitney no parametric tests and Anova tests when appropriate with significance set to P value < 0.05. For Microbiota analysis, all statistical analyses were computed with the GNU R software (www.r-project.org). Jensen-Shanon matrix distance (JSD) between samples was computed from the abundance of each genus as described previously[16]. The obtained distance matrix was then subjected to a principal coordinate analysis (PCoA) in order to estimate the major variation between samples. Temporal stability of the microbiota in GF mice, was assessed by comparing microbial composition in mice fecal sample to the baseline (day 0) by using JSD distance metrics. In order to assess the link between host transcription factors and fecal microbiota composition, co-variations analyses were made using multi table functions from the ade4 library[29]. Spearman correlations between the principal component and genus proportions were done to test the link between samples and the bacterial composition. GNU R source code and dataset used for statistical analysis of this study are available at http://github.com/tapj/comica.
Results
No major phenotypical and metabolic change was observed in the four groups of GF mice
After a 6-weeks colonization period with human fecal microbiota, there was no phenotypical change between HN-GF and HK-GF mice as well as GF mice treated with AOM and NaCl (table 1). No major metabolic change was observed in the 4 groups of GF mice. Nonetheless, there was a1.2-fold increase in the plasma glucose level in AOM-treated mice and a 1.4-fold decrease in the plasma triglycerides level in HK-GF mice. The specific composition of the fecal microbiota is preserved upon colonization of germ-free mice and remains stable until the end of the experimental period
Table 1: Clinical, biological and histopathological parameters of germ-free mice at week 6 after human microbiota transfer. Germ-freemice were colonized with human intestinal microbiota from healthy individuals (HN-GF) and age- and gender-matched patients with colorectal cancer (HK-GF) and were treated either with NaCl or AOM treatment. NS: Non significant; AOM: azoxymethane; HDL: high density lipoprotein; SGPT: serum glutamate pyruvate transaminase; SGOT: serum glutamic oxaloacetic transaminase.
| HN-GF | HK-GF | P Value for HN-GF vs. HK-GF | P value for NaCl treatment vs. AOM treatment | |||||
| NaCl (n = 10) | AOM (n = 13) | P | NaCl (n = 13) | AOM (n = 14) | P | |||
| Clinical parameters | ||||||||
| Weight gain (grams) | 2.0 ± 0.8 | 3.6 ± 1.1 | 0.15 | 3.5 ± 1.1 | 3.5 ± 1.4 | 0.99 | 0.61 | 0.52 |
| Length of smalI intestine (cm) | 31.0 ± 6.6 | 33.7 ± 3.6 | 0.28 | 35.1 ± 2.1 | 35.4 ± 1.8 | 0.82 | 0.11 | 0.28 |
| Length of large intestine (cm) | 8.6 ± 0.7 | 8.7 ± 0.9 | 0.75 | 9.2 ± 0.7 | 8.5 ± 0.1 | 0.06 | 0.33 | 0.62 |
| Biological parameters | ||||||||
| triglycerides (mmol/L) | 2.38 ± 0.18 | 2.55 ± 0.63 | 0.57 | 1.86 ± 0.78 | 1.73 ± 0.46 | 0.60 | 0.001 | 0.91 |
| total cholesterol (mmol/L) | 3.79 ± 0.31 | 3.76 ± 0.40 | 0.84 | 3.76 ± 0.44 | 3.61 ± 0.48 | 0.28 | 0.36 | 0.36 |
| HDL cholesterol (mmol/L) | 2.62 ± 0.23 | 2.66 ± 0.37 | 0.89 | 2.90 ± 0.25 | 2.67 ± 0.54 | 0.41 | 0.56 | 0.45 |
| Glucose (mmol/L) | 5.96 ± 1.22 | 7.15 ± 1.89 | 0.20 | 5.71 ± 1.31 | 6.64 ± 1.44 | 0.09 | 0.34 | 0.03 |
| SGPT (U/I) | 203.8 ± 132.1 | 63.4 ± 102.7 | 0.58 | 197.6 ± 70.9 | 213.3 ± 132.9 | 0.70 | 0.48 | 0.90 |
| SGOT (U/I) | 576.4 ± 122.0 | 681.4 ±618.6 | 0.65 | 761.4 ± 590.9 | 666.9 ± 393.1 | 0.63 | 0.67 | 0.81 |
| Histopathological parameters | ||||||||
| Local inflammation (%) | 40% | 54% | 0.68 | 31% | 69% | 0.13 | 0.99 | 0.57 |
| Decreased amount of goblet cells (%) | 10% | 39% | 0.18 | 23% | 64% | 0.05 | 0.02 | 0.24 |
| Aberrant crypt foci (per cm of colonic mucosa) | 0.08 ± 0.13 | 0.39 ± 0.58 | 0.11 | 0.44 ± 0.66 | 0.88 ± 0.82 | 0.13 | 0.02 | 0.05 |
Comparison of continuous variables was performed using Mann-Whithneyt-test and comparison, of qualitative variables was performed using chi²-test whenever appropriate.
Principal Coordinate Analysis (PCoA) based on 16S rRNA genes reads out (n = 377,355 reads) revealed that the composition of the intestinal microbiota of patients with CRC significantly differs from healthy individuals (p < 0.05, Wilcoxon test on PCo1). The clinical status (HN-GF vs. HK-GF) was the main factor of variations accounting for 35.9% (PCo1) of the analysis while the second coordinate (PCo2) accounting for 13.6% of the analysis (figure 1, left panel). The 15 bacterial genera which significantly correlated to PCo1 explained differences between HN-GF and HK-GF microbiota (figure 1, bottom right panel). Among these, thirteen were over represented in HK-GF mice (figure 1). Bacteroides and Coprococcus were the most associated drivers to the separation between HK-GF and HN-GF mice; Bacteroides in favors of patients with CRC and Coprococcus in favors of healthy individuals.
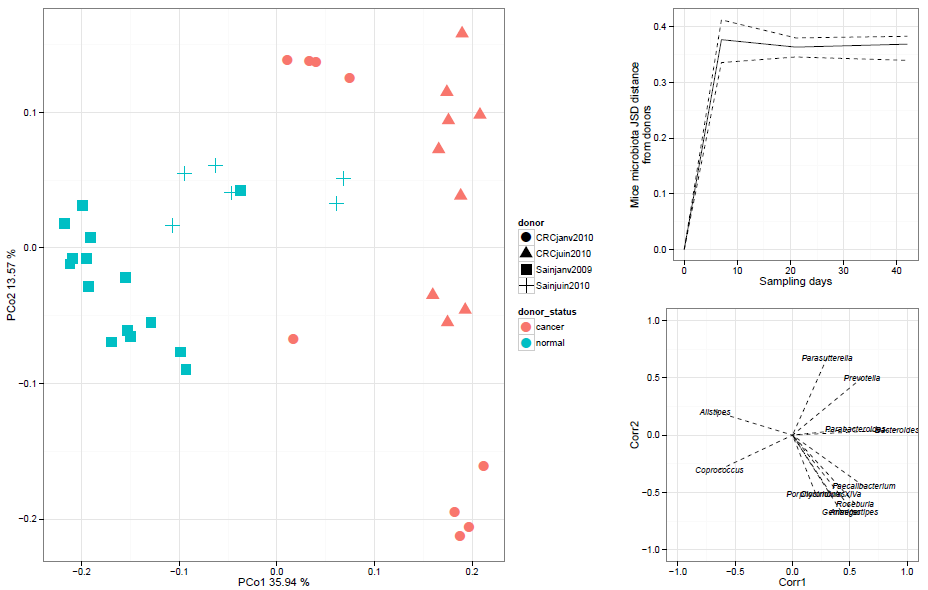
Figure 1: Bacterial genera abundance differentiates HK and HN patients and GF mice. (Left Panel) Principal coordinates analysis (PCoA), based on the 16S rRNA gene pyrosequences and was carried out with 42 samples using Jensen-Shannon divergence (JSD) metrics. Composition of microbiota in HK-GF animals was different than those of HN-GF animals. The first principal coordinate (PCo1 = 35% of inertia) allows to separate HK-GF microbiot as (red symbol) from HN-GF microbiota (blue symbol). (top right panel) Comparison dynamics between microbiota recipient mice (n = 3 by time points per donors) and their donors (n = 4), using JSD distance over time showed that major variation at early stage after transplantation (day 0 to 14) remained unchanged afterward. (bottom right panel) Bacterial genera responsible of this separation are highlighted by significant correlation (P < 0.05) between their abundance and principal components.
The Jensen-Shannon distance metrics showed a larger distance between day 0 (donors) and day 14 and this distance remained stable until the end of the 6-week experimental period (figure 1, top right panel). Quantitative PCR assessment confirmed that the amount of all-bacteria and of somemain dominant and sub-dominant bacterial groups was stable over the 6-week experimental period in the 4 groups of mice. Independently of the composition of the fecal microbiota transplanted and of the AOM/NaCl treatment, a trend for a decrease in the Bifidobacterium genus was observed in all mice (table S2: primers for qPCR and results of qPCR; for expression of results after normalization, please see Ref[18]) that could have contributed to the variation of the Jensen-Shannon distance index.
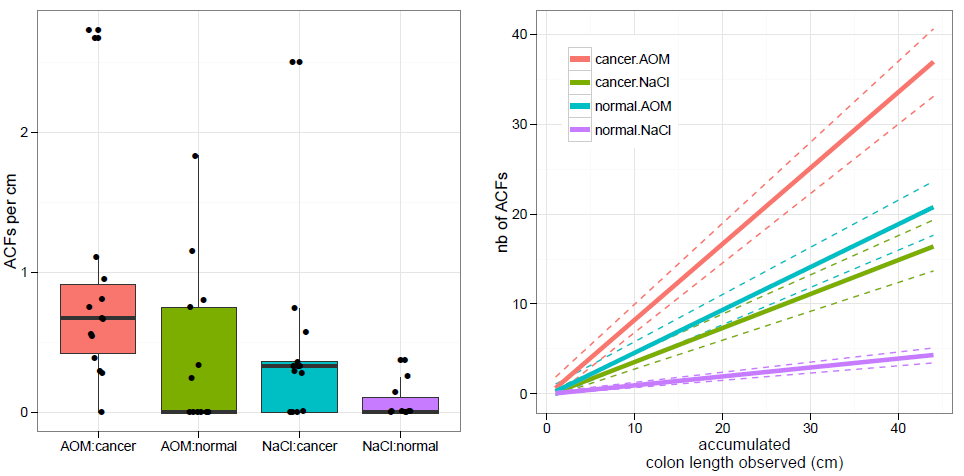
Figure 2: ACFs in the colonic mucosa in mice. Aberrant crypt foci (ACFs) were observed under optical microscope in formalin-fixed colon tissue from human microbiota (HN or HK) GF mice treated with saline or AOM. Number of ACFs was counted in the colonic mucosa of normal (HN) and colon cancer (HK) individuals’ microbiota in GF mice. The data are expressed as numbers of ACFs per cm of mouse colon (left panel). The number of ACFs was plotted as function of colon length observed. Dashed lines represented 95th confidence intervals from 100 bootstrap replicates (right panel).
Number of ACFs in mice colonic mucosa increased with cancer patient fecal sample
Rare ACFs were observed in NaCl-treated HN-GF mice whereas higher numbers of ACFs particularly of single type were observed in the other three groups with rare double or multiple ACFs (figure 2, left panel). HK-GF mice significantly disclosed an increased number of ACFs per cm of colon as compared with HN-GF mice (p = 0.02 for both mice treated with NaCl and AOM) (figure 2, left panel). AOM-treated mice also disclosed a trend an increased number of ACFs per cm of colon as compared with NaCl-treated mice (p = 0.05) especially in HK-GF mice (p = 0.26 in HN-GF mice and p = 0.01 in HK-GF mice). Taking the colon length observed, there was no difference AOM-treated HN-GF mice and NaCl-treated HK-GF mice. Difference between AOM-treated HK-GF and NaCl-treated HN-GF mice was significant when only 10 cm of colon was observed (figure 2, right panel).
Intestinal epithelium renewal associated with gut microbiota composition.
Levels of MATH1, HES1, KLF4 and ELF3 mRNAs in the ileum mucosa were significantly 2.5-fold, 3.1-fold, 1.7-fold and 2.2-fold increase in HK-GF as compared with HN-GF mice (table 2). A similar increase was observed in the colon for Math1 and HES1 mRNAs (1.7-fold and 1.9-fold, respectively) but not for KLF4 and LF3 mRNAs.
Table 2: mRNAs transciptional parameters of germ-free mice at week 6 after human microbiota transfer. Real-time quantitative PCR were performed using the Light Cycler 480 System (Roche Diagnostics, Saint-Egreve, France) according to the manufacturer’s instructions (table S1; Eurogentec SA, Angers, France). Three house keeping genes (GADPH, HRPT1, and TBP) were used. The comparative ΔΔCT-method was used for relative mRNA quantification of target genes, normalized to GAPDH and a relevant control equal to 2-ΔΔCT. Relative values for each PCR product were expressed as a ratio of the target transcript normalized to references genes described above. Mann and Whitney no parametric U test were used.
| HN-GF | HK-GF | P Value for HN-GF vs. HK-GF | P value for Nacl treatment vs. AOM treatment | |||||
| NaCl (n = 10) | AOM (n = 13) | P | NaCl (n = 13) | AOM (n = 14) | P | |||
| Ileal samples (mRNAs relative expression) | ||||||||
| HES1 | 1 | 2.2 ± 2.2 | 0.23 | 5.6 ± 3.0 | 5.1 ± 2.3 | 0.66 | 0.001 | 0.82 |
| MATH1 | 1 | 1.7 ± 1.6 | 0.36 | 4.1 ± 3.9 | 3.1 ± 1.9 | 0.40 | 0.004 | 0.45 |
| KLF4 | 1 | 1.1 ± 0.5 | 0.48 | 1.8 ± 0.6 | 1.7 ± 0.9 | 0.76 | 0.006 | 0.74 |
| ELF3 | 1 | 2.1 ± 1.3 | 0.11 | 3.9 ± 1.8 | 3.8 ± 2.0 | 0.89 | < 0.001 | 0.90 |
| Colonic samples (mRNAs relative expression) | ||||||||
| HES1 | 1 | 1.6 ± 0.8 | 0.18 | 3.9 ± 1.8 | 3.8 ± 2.0 | 0.22 | 0.02 | 0.34 |
| MATH1 | 1 | 1.3 ± 0.9 | 0.56 | 1.9 ± 0.6 | 1.7 ± 0.9 | 0.84 | 0.05 | 0.86 |
| KLF4 | 1 | 0.8 ± 0.2 | 0.13 | 1.9 ± 1.5 | 2.0 ± 1.3 | 0.77 | 0.90 | 0.23 |
| ELF3 | 1 | 1.0 ± 0.6 | 0.90 | 3.1 ± 1.9 | 2.2 ± 1.5 | 0.36 | 0.07 | 0.32 |
Results of sPCR have been compared in between groups by using no parametric Mann & Whitney test.
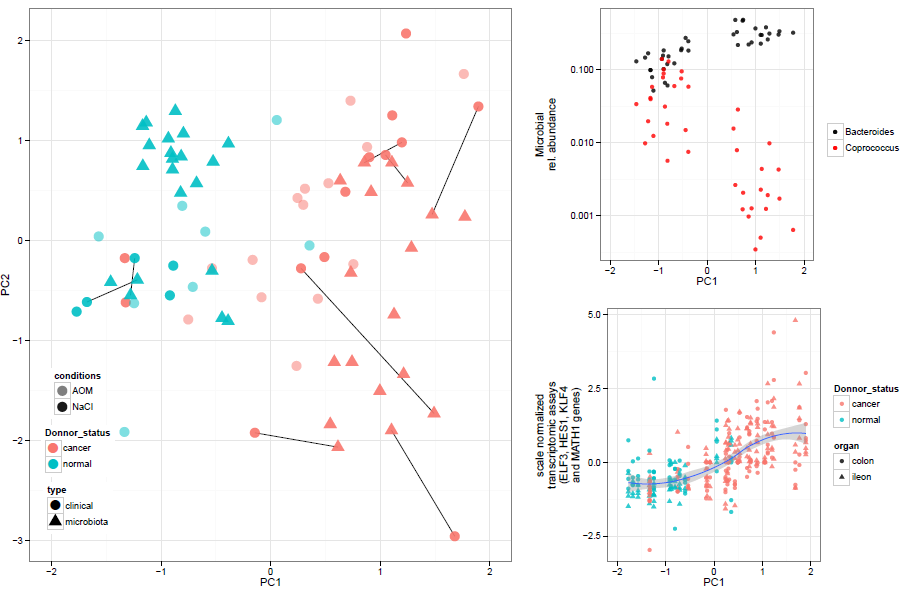
Figure 3: Gut microbiota composition co-variations with clinical mice analysis. (Left panel) Co-inertia analysis component between gut microbiota genera composition and clinical data (ACFs number, mRNA levels and blood parameters) was plotted. Dots and square accounted for clinical and microbiota data respectively. Paired analyzed samples were linked with straight black lines. Blue and red color accounted for donor status, normal (HN) and cancer (HK) receptively. AOM-treated mice were pictured with grey dots. The first component from the co-inertia analysis was plotted as function of Bacteroides and Coprococcus relative abundance (top right panel) and as a function of ELF3, HES1, KLF4 and Math1 gene expression levels normalized in ileac and colonic tissue (Bottom left panel).
Co-inertia analysis revealed that clinical data(ACFs, mRNA levels and blood assays) was associated with fecal microbiota data (figure 3, left panel). The first component of the analysis allowed a significant separation between HN-GF and HK-GF mice driven by both microbiota and clinical factor. This first component was significantly associated linearly with Bacteroides and Coprococcus genera (figure3, top right panel). Associations with clinical data was mainly driven by gene expression associated with cell renewal (Math1, HES1, ELF3 and KLF4) which co-varied together from ileum and colon tissues allowing a significant separation between HK-GF and HN-GF mice (figure 3, bottom right panel).
Mucosa-adherent bacteria analysis, inflammation and metabolism
Bacteria were shown to be adherent to the intestinal mucosa as assessed by FISH staining (“Figure S2”). Mucin producing goblet cells were significantly decreased in AOM-treated mice with also a trend for a decrease in HK-GF mice as compared with HN-GF mice. Although no difference was found in the amount of mono- or polynuclear cells, lymphoid follicles were increased in the ileal and colonic mucosa of HK-GF mice as compared with HN-GF mice. No difference was found in the levels of IL1β, IL6, IL17, IL17R, MIP2, TNFα mRNAs in the ileum, while in the colonic mucosa, a trend for an increase IL17 and IL17R expression were observed in HK-GF mice as compared with HN-GF mice “Figure S3” (data not shown).
Table 3: qPCR-based composition of the fecal microbiota for dominant and sub dominant bacteria groups of germ-free mice at days 7, 21 and 42 after human microbiota transfer.
| Tranplanted human microbiota | Condition | Day 7 | Day 21 | Day 42 | |
|---|---|---|---|---|---|
| All bacteria | HN | Saline | 11.61 ± 0.36 | 11.87 ± 0.32 | 12.11 ± 0.52 |
| AOM | 11.68 ± 0.18 | 11.75 ± 0.26 | 11.66 ± 0.36 | ||
| HK | Saline | 11.62 ± 0.25 | 11.78 ± 0.24 | 11.85 ± 0.30 | |
| AOM | 11,69 ± 0.31 | 11,65 ± 0.24 | 11,91 ± 0.20 | ||
| Escherichia coli species | HN | Saline | -4.59 ± 1.67 | -4.21 ± 0.94 | -5.09 ± 1.04 |
| AOM | -5.11 ± 0.98 | -5.35 ± 1.14 | -4.59 ± 1.71 | ||
| HK | Saline | -5.13 ± 0.87 | -5.03 ± 0.72 | -4.98 ± 0.70 | |
| AOM | -4,92 ±1.24 | -5,89 ±0.61 | -5,24 ±1.06 | ||
| Bifidobacterium genus | HN | Saline | -4.61 ± 1.26 | -6.23 ± 0.91 | -5.09 ± 1.04 |
| AOM | -4.41 ± 1.40 | -3.52 ± 2.51 | -4.59 ± 1.21 | ||
| HK | Saline | -4.77 ± 0.87 | -5.03 ± 0.72 | -4.98 ± 0.70 | |
| AOM | -4,56 ± 1.74 | -4,81 ± 1.74 | -4,88 ± 1.41 | ||
| Lactobacillus/leuconostoc/Pediococcus | HN | Saline | -5.32 ± 0.70 | -5.39 ± 0.82 | -6.15 ± 0.95 |
| AOM | -5.61 ± 0.85 | -5.73 ± 0.59 | -5.49 ± 0.62 | ||
| HK | Saline | -5.35 ± 0.74 | -5.41 ± 0.91 | -5.47 ± 0.92 | |
| AOM | -5,52 ± 0.95 | -5,52 ±0.90 | -5,52 ± 0.98 | ||
| Blautiacoccoides group | HN | Saline | -1.48 ± 0.50 | -1.67 ± 0.84 | -1.40 ± 0.55 |
| AOM | -1.49 ± 0.22 | -0.91 ± 0.23 | -0.64 ± 0.22 | ||
| HK | Saline | -1.99 ± 1.26 | -1.83 ± 0.47 | -2.04 ± 1.25 | |
| AOM | -1.64 ±0.58 | -1.74 ±0.31 | -1.73 ±0.44 | ||
| Clostridium leptum group | HN | Saline | -0.85 ± 0.47 | -0.56 ± 0.20 | -0.58 ± 0.29 |
| AOM | -0.97 ± 0.45 | -0.82 ± 0.41 | -0.62 ± 0.33 | ||
| HK | Saline | -1,16 ±0.33 | -1.10 ± 0.47 | -0.98 ± 0.50 | |
| AOM | -3,79 ± 1.89 | -3,79 ±2.15 | -3,10 ± 1.52 | ||
| Faecali bacteriumprauznitzii species | HN | Saline | -2.11 ± 1.46 | -1.41 ± 0.51 | -2.43 ± 2.26 |
| AOM | -2.49 ± 1.76 | -3.21 ± 1.70 | -2.45 ± 194 | ||
| HK | Saline | -4,47 ±2.16 | -3,58 ± 2.12 | -3,36 ± 2.05 | |
| AOM | -1,07 ± 0.20 | -1,00 ± 0.36 | -0,87 ± 0.43 | ||
| Bacteroides/Prevotella group | HN | Saline | -0.99 ±0.29 | -0.81 ± 0.21 | -0.64 ± 0.19 |
| AOM | -0.88 ± 0.22 | -0.91 ± 0.23 | -0.62 ± 0.22 | ||
| HK | Saline | -0.85 ± 0.24 | -0.75 ± 0.20 | -1.01 ± 0.34 | |
| AOM | -0,72 ± 0.33 | -0,81 ± 0.23 | -0,87 ± 0.23 |
Comparison of continuous variables was performed using Student T-test or Wilcoxon test whenever appropriate. All-bacteria results obtained by qPCR were expressed as mean of the log10 value ± SD. Results were expressed as mean of normalized values ± SD, calculated as the log number of targeted bacteria minus the log number of all-bacteria. Faecalibacterium prausnitzii is the major component of Clostridium leptum group.
Discussion
In the present study, we showed that transplantation of human intestinal microbiota from CRC patients to GF mice, lead to enhanced development of ACF and an early preneoplastic lesion and to carcinogenic functional changes, as compared with healthy individuals. We also showed that the latter early changes occur additively to those observed in mice treated with AOM, a known chemical carcinogenic agent[24]. Using fecal 16S RNA genes pyrosequencing analysis, we showed that human intestinal transplantation was stable over a 6-week experimental period, although a decrease in the relative amount of the Bifidobacterium genus was observed in all recipient mice. These account for in vivo evidence of Koch’s principle on the hypothesis that human intestinal microbiota may favor occurrence of CRC likely through interaction with the environment. This in vivo experimental study is the first demonstration on “causal” effect of unselected colon cancer associated human Microbiota in an animal model as compared to normal human Microbiota.
Colon carcinogenesis is a multistep progressive process characterized by the accumulation of DNA alterations within the colonic epithelial cells[7]. The contribution of the human intestinal microbiota which interplays with the host mucosa and immune system and the environment, has been recently highlighted by we and others[5]. Indeed, patients with CRC are characterized by a specific shift in the composition of their intestinal microbiome, so-called dysbiosis, as compared with healthy individuals[18-20]. Moreover, the latter dysbiosis mediates functional changes that could promote either the emergence or the expansion of colorectal neoplasia. Causative effects of some bacterial strains have been also shown, from the Escherichia coli and Bacteroides fragilis producing genotoxins to Fusobacterium nucleatum that promotes colorectal carcinogenesis[21,30-32]. Mechanisms involved in colon carcinogenesis and bacteria effect has been conducted particularly with Fusobacterium nucleatum which should not be considered as a starter candidate[21,30].
Taking in consideration that human intestinal microbiota interplays with the host mucosa at its immune system and the environment[13,14], we transplanted human fecal microbiota to GF mice. Bacteria were found in contact with the mucosa as determined by FISH staining (supplementary data) and could be accounted for cell stimulation in the intestinal mucosa as shown in the current study and by others[33]. We assumed if CRC patient’s microbial dysbiosis[19,34] had causal effect, it might induce early intestinal mucosal changes fitting with carcinogenesis pathways in the recipient. Consequently, upon a short term experimental design we quantified transcriptional changes of 4 main activators of the proliferation and cell differentiation into the main four differentiated lineages (Absorptive enterocytes, Goblet cells, Paneth cells and Entero endocrine cells)[35,36]. The fact that higher expression of HES1, MATH1, ELF3 and KLF4 could be documented in HK-GF mice treated with AOM is consistent with an up regulation of the Wnt/β-catenin and Notch signaling pathways in the intestinal mucosa although inflammation and metabolism pathways[12,37] require further investigations. Stability of the fecal microbiota composition during the study period supports the contribution of the intestinal microbiota to the observed changes. Of note, a relative abundance loss in the Bifidobacterium genus was observed after transplantation but occurred in all the experimental groups suggesting a host effect selection on the human intestinal microbiota composition. Interestingly, we showed that 13 bacterial genera were enriched in HK-GF microbiota which could influence carcinogenesis in mice with Bacteroides as the strongest associated driver (Figure 1). However, whether bacteria or bacterial products are the mediator of those early changes require further investigation.
Nevertheless, various mechanisms such as inflammation[37] epithelium maturation, gut epithelial cell proliferation[38] energy metabolism, or mucosal immune responses[39,40] might be involved. Although the present experimental has been designed to identify very early significant changes depending on HK or HN microbiota, a trend to higher recruitment of immune cells has been observed and could be linked to CRC-related dysbiosis. These have been shown characterizing HN-GF but not HK-GF microbiota. By contrast, we did not detect a significant over-representation of Fusobacterium species which is a passenger bacteria with the tumoral mucosa[30,41,42] meaning it is likely involved in late stage of carcinogenesis.
Conclusion
In conclusion, we showed for the first time that transplantation of human intestinal microbiota from CRC patients to GF mice induced early carcinogenic changes through activation of Notch, Wnt/β-catenin pathways. Further works are warranted to clarify putative mechanisms (host gene alteration, inflammation, metabolic, etc) involved in this fecal microbiota-related CRC predisposition to the recipient mice.
Acknowledge:
We thank Denis Mariat and Nathalie Gallegos (INRA) for their contribution in fecal DNA extractions and analysis, Julie Villemot and Amine Amoura for their technical contribution in gene sequencing and protein quantifications.
Grant Support: National institute of Research in Cancer INCA, Ile de France Branch (Cancéropôle, Ile de France ; Project Libre); ACD (association Charles Debray) ; Award Grant of UEGW 2011 of top basic research study (Stockholm October 24 2011) used for 16S rRNA genes pyrosequencing. 16S rRNA sequences files in fasta format are available here: http://www. bork.embl.de/~tap/tap_et_al_2014/
Competing Interest:
All the investigators have read all reports, including the present manuscript, in entirety. All authors certify that the study has been entirely supported by public funds and no one has any conflict of interest with private nutritional or pharmaceutical company.
Keywords: CRC: Colorectal Cancer; AOM: Azoxymethane; ACF: Aberrant Crypt Foci; GF: Germ-Free; HN: Human Healthy Individuals; HK: Human patients with colorectal cancer; HES1: Hairy and Enhancer of Split-1; KLF4: Kruppel- Like Factor 4; MATH1: Murine Atonal Homolog-1, ELF3: E74-Like Factor.
Supplementary information
Text S1: Supporting information for pyrosequencing analysis.
Bacterial DNA samples of donors (day 0) and of HNGF and HK-GF at days 14, 28 and 42 were used to construct pyrosequencing DNA libraries. Universal 16S rRNA gene primers were used for the PCR reaction: V3F (TACGGRAGGCAGCAG) and V4R (GGACTACCAGGGTATCTAAT) to target the V3-V4 region. Barcode sequences (GsFLX key) TCAG and MIDGsFLX (12 nucleotides) were attached between the 454 GsFLX adaptator sequence and the forward primer V3F. The GsFLX key and the 454 GsFLX adaptator were attached to the reverse primer. The concentration and quality of the PCR products were determined with Picogreen method and to obtain equal amounts of each of the samples. 16S rRNA gene amplicons were sequenced on a Roche GS FLX 454 sequencer (Genoscreen, Lille, France) and processed with standard protocol from manufacturer. Data availble on line : http://github.com/tapj/comica.
Text S2: Supporting text for ACFs assessment.
In the present study, at day 42, large intestines were taken, opened, and left segments were carefully pinned flat, without folds, to examine the totality of colonic mucosa. Crypts were considered aberrant if they were at least twice the size of surrounding crypts. They have usually elongated openings, lining epithelial cells more prominent and more intensely stained than surrounding epithelial cells, and increased peri cryptal space. The isolated aberrant crypt has been considered as single; two associated aberrant crypts and three or more aberrant associated crypts were considered as double or multiple ACF, respectively. Inter individual variations in counts were less than 5%. Lengths of segments were again measured after fixation. Numbers of ACFs per animal were expressed per cm of colons and means of two observers’ counts were considered.
“Back to Top”
Table S1: Transcription factors and cytokines primers for quantification by using real-time PCR.
| Gene | Reverse primer | Forward primer |
|---|---|---|
| Kfl4 | CAGCTGGCAAGCGCTACA | CCTTTCTCCTGATTATCCATTCACA |
| Elf3 | GGCCAGAAGAAGAAGAACAG | CCTTAATTCCGACTCTCTCC |
| Hes1 | AGCTGGAGAGGCTGCCAAGGTTT | ACATGGAGTCCGAAGTGAGCGAG |
| IL-17A | GCTCCAGAAGGCCCTCAGA | AGCTTTCCCTCCGCATTG |
| IL-17RA | TGAAGATGACTACCTCATGCGT | TGACATTAGCTCGCTGATGGAA |
| IL-1 β | CCTTCCAGGATGAGGACATGA | CGTCACACACCAGCAGGTTAT |
| IL-6 | TGCCTTCTTGGGACTGATGCT | TATCTCTCTGAAGGACTCTGG |
| TNFα | CATCTTCTCAAAATCGAGTGACAA | GGGAGTAGACAAGGTACAACCC |
| MIP-2 | TTTTTGACCGCCCTTGAGAGT | CATCCAGAGCTTGAGTGTGAC |
| GAPDH | GTGTCCGTCGTGGATCTGA | CCTGCTTCACCACCTTCTTG |
| TBP | CAAACCCAGAATTGTTCTCCTT | ATGTGGTCTTCCTGAATCCCT |
| HRPT1 | CAGATTCAACTTGCGCTCATC | CAAACCCAGAATTGTTCTCCTT |
Table S2: Group and species-specific 16S rRNA gene-targeted primers and probes.
| Target organism | Primer and probe | Sequence 5′ - 3′ |
|---|---|---|
| All-bacteria (*) | F_Bact 1369 | CGG TGA ATA CGT TCC CGG |
| R_Prok1492 | TAC GGC TAC CTT GTT ACG ACT T | |
| P_TM1389F | 6FAM-CTT GTA CAC ACC GCC CGT C | |
| C. leptum | F_Clept 09 | CCT TCC GTG CCG SAG TTA |
| R_Clept 08 | GAA TTA AAC CAC ATA CTC CAC TGC TT | |
| P-Clep 01 | 6FAM-CAC AAT AAG TAA TCC ACC | |
| Bifidobacterium | F_Bifid 09c | CGG GTGAGT AAT GCG TGA CC |
| R_Bifid 06 | TGA TAG GAC GCG ACC CCA | |
| P_Bifid | 6FAM-CTC CTG GAA ACG GGT G | |
| C. coccoides | F_Ccoc 07 | GAC GCC GCG TGA AGG A |
| R_Ccoc 14 | AGC CCC AGC CTT TCA CAT C | |
| P_Erec482(*) | VIC-CGG TAC CTG ACT AAG AAG | |
| Bacteroides/Prevotella | F_Bacter 11 | CCT WCG ATG GAT AGG GGT T |
| R_Bacter 08 | CAC GCT ACT TGG CTG GTT CAG | |
| P_Bac303(*) | VIC-AAG GTC CCC CAC ATT G | |
| E. coli | E.coli F | CAT GCC GCG TGT ATG AAG AA |
| E.coli R | CGG GTA ACG TCA ATG AGC AAA | |
| Lactobacillus/Leuconostoc/ Pediococcus | F_Lacto 05 | AGC AGT AGG GAA TCT TCC A |
| R_Lacto 04 | CGC CAC TGG TGT TCY TCC ATA TA | |
| F. prausnitzii | Fprau 07 | CCA TGA ATT GCC TTC AAA ACT GTT |
| Fprau 02 | GAG CCT CAG CGT CAG TTG GT |
(*) modified from reference
Primers and probes were constructed to target all dominant and subdominant bacterial species in accordance to the pyrosequencing results. Methods have been previously described[27]. Probe sequences are in bold.
Results of qPCR quantification of bacteria (for expression of results, see Ref [27])
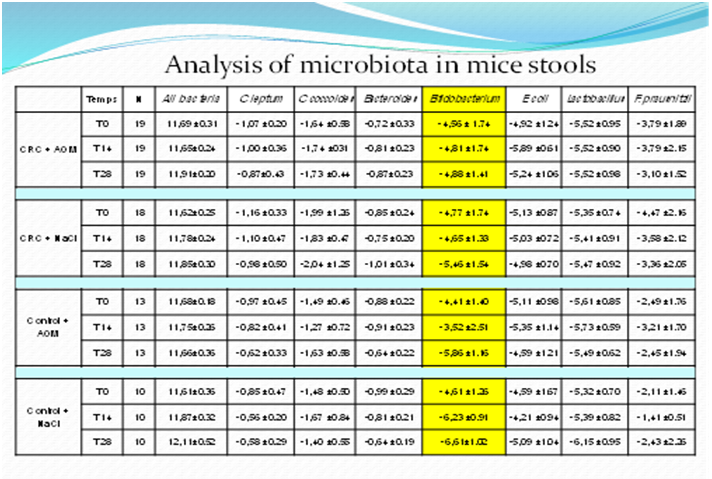
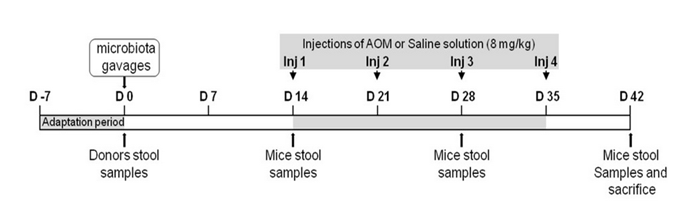
Figure S1: Schedule and design of the study. After a week adaptation (day -7 to 0), 8 week old C3H/HeN Germ-Free mice were given orally fresh stools either from healthy donors (HN) or from colon cancer patients (HK). Two weeks later (day 14), the mice were intraperitoneally injected (at days 14, 21, 28 and 35) with AOM (8 mg/kg) or with NaCl solution for four weeks. After 6 weeks (day 42), mice were anesthetized, blood was collected and after sacrifice, tissues were collected. Stool samples were collected at day 0, 14, 28 and 42. Four independent experiments were realized in 53 mice. Details of schedule and experiments are presented in the table 1.
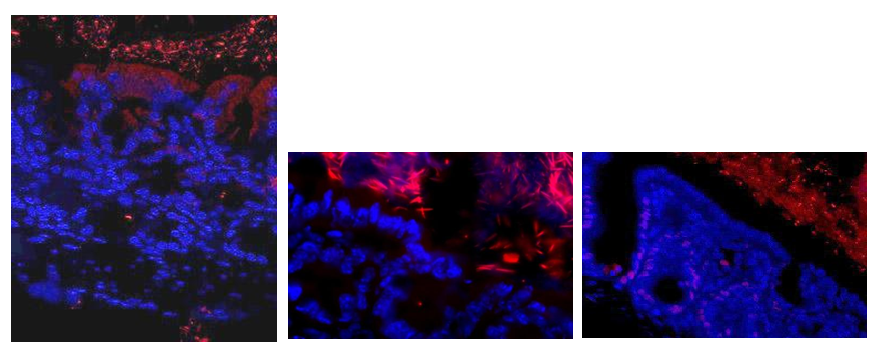
Figure S2: Bacteria (red color) were shown within the mucus adherent to the intestinal epithelium (blue color). Briefly, frozen sections were rehydrated in PBS, covered with 3,7% paraformaldehyde in PBS at room temperature for 10 min, rinsed with PBS and covered with a solution of lysozyme at 10 mg/ml in PBS during 10 min at 37°C, washed and incubated 30 min in hybridization buffer (20 mM Tris-HCl pH 8, 0.9 M NaCl, 0.01 % SDS and 30 % Formamide). Slides were incubated overnight In hybridization buffer containing 20 nM of the fluorescent probe (Eub338: GCTGCCTCCCGTAGGAGT) at 42°C, washed in SSC 1X, covered for 10 seconds with DAPI (0.125 g/ml in PBS), and re-washed in PBS before mounted in Prolong Gold Antifade Reagent (InVitrogen). The all-bacteria 16S RNA targeted oligonucleotide probe was covalently linked with Alexa 555 at the 5′-end. Slides were examined under an Olympus BX50 microscope equipped with a CDD camera.
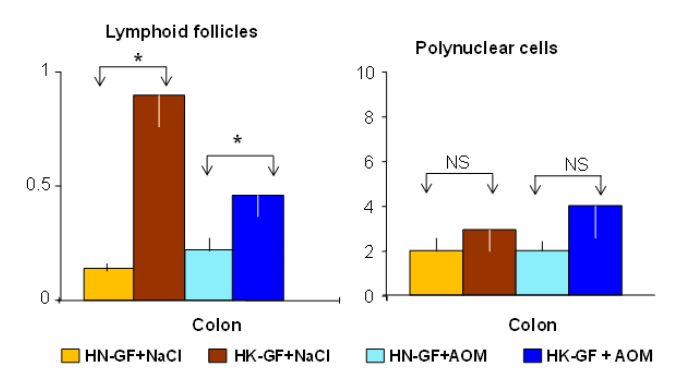
Figure S3: Number of lymphoid follicles and polynuclear per cm of the colonic mucosa.Very rare mono and polynuclear cells infiltrated the colonic mucosa; the number of lymphoid follicles as assessed by histopathology observation appeared to be higher in HK recipient mice.*:p < 0.05, NS: non significant.
References
- 1. Johnson, I.T., Lund, E.K. Review article: nutrition, obesity and colorectal cancer. (2007) Aliment Pharmacol Ther 26(2): 161-181.
- 2. Munkholm, P. Review article: the incidence and prevalence of colorectal cancer in inflammatory bowel disease. (2003) Aliment Pharmacol Ther 18(2): 1-5.
- 3. Narod, S.A. Genes, the environment, and breast cancer. (2010) Lancet 375(9732): 2123-2114.
- 4. Bingham, S.A. Mechanisms and experimental and epidemiological evidence relating dietary fibre (non-starch polysaccharides) and starch to protection against large bowel cancer. (1990) Proc Nutr Soc 49(2): 153-171.
- 5. Sobhani, I., Amiot, A., Le Baleur, Y., et al. Microbial dysbiosis and colon carcinogenesis: could colon cancer be considered a bacteria-related disease? (2013) Therap Adv Gastroenterol: 6(3): 215-29.
- 6. O'Keefe, S.J. Nutrition and colonic health: the critical role of the microbiota. (2008) Curr Opin Gastroenterol 24(1): 51-58.
- 7. Vogelstein, B., Kinzler, K.W. The multistep nature of cancer. (1993) Trends Genet 9(4): 138-141.
- 8. Yamada, Y., Mori, H. Pre-cancerous lesions for colorectal cancers in rodents: a new concept. (2003) Carcinogenesis 24(6): 1015-1019.
- 9. Takayama, T., Shinichi, K., Yasou, T., et al. Aberrant crypt foci of the colon as precursors of adenoma and cancer. (1998) N Engl J Med 339: 1277-1284.
- 10. Mascolo, M., Staibano, S., Ilardi, G., et al. Probe-based confocal laser endomicroscopy evaluation of colon preneoplastic lesions, with particular attention to the aberrant crypt foci and comparative assessment with histological features obtained by conventional endoscopy. (2012) Gastroenterol Res Pract 2012: 645173.
- 11. Lipkin, M., Deschner, E. Early proliferative changes in intestinal cells. (1976) Cancer Res 36(7): 2665-2668.
- 12. Wang, D., Fu, L., Ning, W., et al. Peroxisome proliferator-activated receptor delta promotes colonic inflammation and tumor growth. (2014) Proc Natl Acad Sci U S A 111(19): 7084-7089.
- 13. Gaboriau-Routhiau, V., Lecuyer, E., Cerf-Bensussan, N. Role of microbiota in postnatal maturation of intestinal T-cell responses. (2011) Curr Opin Gastroenterol 27(6): 502-508.
- 14. Bordonaro, M., Lazarova, D.L., Sartorelli, A.C. Butyrate and Wnt signaling: a possible solution to the puzzle of dietary fiber and colon cancer risk? (2008) Cell Cycle 7(9): 1178-1183.
- 15. Eckburg, P.B., Bik, E.M., Bernstein C.N., et al. Diversity of the human intestinal microbial flora. (2005) Science 308(5728): 1635-1638.
- 16. Arumugam, M., Raes, J., Pelletier, E., et al. Enterotypes of the human gut microbiome. (2011) Nature 473(7346): 174-180.
- 17. Sokol, H., Pigneur, B., Watterlot, L., et al. Faecalibacterium prausnitzii is an anti-inflammatory commensal bacterium identified by gut microbiota analysis of Crohn disease patients. (2008) Proc Natl Acad Sci U S A 105(43): 16731-6.
- 18. Sobhani, I., Tap, J., et al. Microbial dysbiosis in colorectal cancer (CRC) patients. (2011) PLoS One 6(1): e16393.
- 19. Zeller, G., Tap, J., Voigt, A.Y., et al. Potential of fecal microbiota for early-stage detection of colorectal cancer. (2014) Mol Syst Biol 10: 766.
- 20. Feng, Q., Liang, S., Jai, H., et al. Gut microbiome development along the colorectal adenoma-carcinoma sequence. (2015) Nat Commun 6: 6528.
- 21. Arthur, J.C., Perez-Chanona, E., Muhlbauer, M., et al. (2012). Intestinal inflammation targets cancer-inducing activity of the microbiota. (2012) Science 338(6103): 120-123.
- 22. Uronis, J.M., Muhlbauer, M., Herfarth, H.H., et al. Modulation of the intestinal microbiota alters colitis-associated colorectal cancer susceptibility. (2009) PLoS One 4(6): e6026.
- 23. Fontham, E.T., Thun, M.J., Ward, E., et al. American Cancer Society perspectives on environmental factors and cancer. (2009) CA Cancer J Clin 59(6): 343-351.
- 24. Aparicio, T., Guilmeau, S., Goiot, H., et al. Leptin reduces the development of the initial precancerous lesions induced by azoxymethane in the rat colonic mucosa. (2004) Gastroenterology 126(2): 499-510.
- 25. Aparicio, T.,Svrcek, M., Zaanan, A., et al. Small bowel adenocarcinoma phenotyping, a clinicobiological prognostic study. (2013) Br J Cancer 109(2): 3057-3066.
- 26. Aparicio, T., Kotelevets, L., Tsocas, A., et al. Leptin stimulates the proliferation of human colon cancer cells in vitro but does not promote the growth of colon cancer xenografts in nude mice or intestinal tumorigenesis in Apc(Min/+) mice. (2005) Gut 54(8): 1136-1145.
- 27. Furet, J.P., Firmesse, O., Gourmelon, M., et al. Comparative assessment of human and farm animal faecal microbiota using real-time quantitative PCR. (2009) FEMS Microbiol Ecol 68(3): 351-362.
- 28. Hildebrand, F., Tito, T., Voigt, A., et al. LotuS: an efficient and user-friendly OTU processing pipeline. (2014) Microbiome 2
- 29. Dray, S. and Dufour, A.B. (2007). The ade4 package: implementing the duality diagram for ecologists. J Statisti Software 22(4): 1-20.
- 30. Kostic, A.D., Gevers, D., Chandra Sheker, P., et al. Genomic analysis identifies association of Fusobacterium with colorectal carcinoma. (2012) Genome Res 22(2): 292-298.
- 31. Goodwin, A.C., Dastefano Shield, C,E., Wu, S., et al. Polyamine catabolism contributes to enterotoxigenic Bacteroides fragilis-induced colon tumorigenesis. (2011) Proc Natl Acad Sci U S A 108(37): 15354-15359.
- 32. Prorok-Hamon, M., Friswell, M.K., Alswied, A., et al. Colonic mucosa-associated diffusely adherent afaC+ Escherichia coli expressing lpfA and pks are increased in inflammatory bowel disease and colon cancer. (2014) Gut 63(5): 761-770.
- 33. Vannucci, L., Stepankova, R., Kozakova, H., et al. Colorectal carcinogenesis in germ-free and conventionally reared rats: different intestinal environments affect the systemic immunity. (2008) Int J Oncol 32(3): 609-617.
- 34. Marchesi, J.R., Dutilh, B.E., Hall, N., et al. Towards the human colorectal cancer microbiome. (2011) PLoS One 6(5): e20447.
- 35. Clevers, H. The intestinal crypt, a prototype stem cell compartment. (2013) Cell 154(2): 274-284.
- 36. Jensen, J., Pedersen, E.E., Galante, P., et al. (2000). Control of endodermal endocrine development by Hes-1. Nat Genet 24(1): 36-44.
- 37. Nell, S., Suerbaum, S., Josenhans, C. The impact of the microbiota on the pathogenesis of IBD: lessons from mouse infection models. (2010) Nat Rev Microbiol 8(8): 564-577.
- 38. Rakoff-Nahoum, S., Paglino, J., Eslami-Varzaneh, F., et al. Recognition of commensal microflora by toll-like receptors is required for intestinal homeostasis. (2004) Cell 118(2): 229-241.
- 39. Wu, S., Rhee, K.J., Albesiano, E., et al. A human colonic commensal promotes colon tumorigenesis via activation of T helper type 17 T cell responses. (2009) Nat Med 15(19): 1016-1022.
- 40. Sheng, Y.H., Lourie, R., Linden, S.K., et al. The MUC13 cell-surface mucin protects against intestinal inflammation by inhibiting epithelial cell apoptosis. (2011) Gut 60(12): 1661-1670.
- 41. Ray, K. Colorectal cancer: Fusobacterium nucleatum found in colon cancer tissue--could an infection cause colorectal cancer? (2011) Nat Rev Gastroenterol Hepatol 8: 662.
- 42. Castellarin, M., Rene, L.W., et al. Fusobacterium nucleatum infection is prevalent in human colorectal carcinoma. (2012) Genome Res 22(2): 299-306.


