
Effect of Different Light Sources on Algal Biomass and Lipid Production in Internal Leds-Illuminated Photobioreactor
Y.K. Wong1,2*, Y.H. Ho2, K.C. Ho2, H.M. Leung1, K. P. Chow2, K.K.L. Yung1
Affiliation
- 1Biology Department, The Hong Kong Baptist University, Hong Kong
- 2Centre for Research in Environmental Science, School of Science and Technology, The Open University of Hong Kong, Hong Kong
Corresponding Author
Y.K. Wong, Department of Biology, Hong Kong Baptist University; Centre for Research in Environmental Science, School of Science and Technology, The Open University of Hong Kong, Hong Kong, E-mail: yekwong@ouhk.edu.hk
Citation
Wong Y.K., et al. Effect of Different Light Sources on Algal Biomass and Lipid Production in Internal Leds-Illuminated Photobioreactor. (2016) J Marine Biol Aquacult 2(2): 1- 8.
Copy rights
© 2016 Wong Y.K. This is an Open access article distributed under the terms of Creative Commons Attribution 4.0 International License.
Keywords
Chlorella vulgaris; Cultivation; Algae biomass; Photobioreactor; Biodiesel; Wastewater treatment
Abstract
Illumination and nutrients are key factors to the biomass and biodiesel production from microalgae. In this study, the effects of various light wavelengths, light intensities and cultivation medium on the growth and lipid content of Chlorella vulgaris were investigated by using LEDs (Light Emitting Diodes) with different wavelengths in an Internal LEDs-Illuminated Photobioreactor. C. vulgaris was grown for 10 days under 18:6 h Light/Dark cycles with different light colors (cool white, blue and red) and intensities (50, 70, 90 and 110 μmol m-2s-1). The effects of the illuminations were investigated for different light intensity at 25°C culture temperature. The maximum dry biomass of 1353.33 mg/L was observed at cool white light of 110 μmol m-2s-1 during the 7th culture day, with the highest overall dry biomass production (117.23 mg/Ld-1) within cultivation time. The highest lipid content (34.06 %) was obtained with the blue color due to light efficiency and deep penetration. Moreover, the highest lipid productivity (31.86 mg/L d-1) was observed in 50 μmol m-2s-1 with cool white lights. The lipid productivity was further optimized by increasing the light intensity of cool white light. The highest lipid productivity was observed at 110 μmol m-2s-1 light intensity of 658.99 mg/L during the 10th culture day. To conclude, the result of our study shows that C. vulgaris cultivated with wastewater in photobioreactors is efficient in producing algal biomass and removing nitrogen and phosphorus nutrient in wastewater sewage.
Introduction
Global warming is a deteriorating international issue linked to the continuous rise in atmospheric carbon dioxide (CO2) due to an increase in worldwide energy consumption with the burning of fossil fuels[1]. A new alternative and sustainable fuel source must be found to replace fossil fuel uses, and to prevent global energy crisis. Microalgae, a promising biofuel feedstock, with a much greater oil yield than terrestrial oilseed plants, would be the next feasible renewable energy source. Microalgae can assimilate atmospheric CO2 for sequestration so as to reduce greenhouse gases[2,3]. However, more than 3000 kg water is required to produce 1 kg microalgal biofuel. The impact of microalgae-based biofuel generation on water consumption is a concern. The water usage could be reduced by 90% if wastewater were applied for microalgae cultivation[4]. The utilization of microalgae in wastewater treatment is also a more environmentally-friendly way for pollutant reduction, as it removes nitrogen (N), phosphorus (P), metal ions and chemical oxygen demand (COD) in sewage with high efficiency. The nutrients such as nitrite, nitrate, ammonia and phosphate are identified as the main cause of eutrophication and red-tide in natural waters[5]. Nitrogen and phosphorus present can be used for microalgae growth (organic pollutants into cellular constituents in lipid and carbohydrate forms) and possibly lead to cost reductions in the cultivation of microalgae. Chlorella vulgaris (C. vulgaris) was observed as one of the dominant microalgae strain by using sewage as the cultivation medium[3,6].
Recently, researches have focused on using close system photobioreactor (PBR) for the wastewater treatment process which is easier to control, has high biomass production and reduces risk of contamination[7]. PBRs provide an artificial cultural environment to cultivate microalgae with the adjustable growth condition including lighting, nutrient and aeration. Light is the major factor of photosynthesis and directly affects the cellular metabolism. A light-emitting diode (LED) is a simply-designed lighting device consisting of a two-lead semiconductor light source usually installed in the PBRs. It is a p-n injection diode and the light is emitted by Electroluminescence (EL) when activated. The color of the light is dependent on the energy band gap of semiconductor materials[8]. LEDs have the advantages, including: (1) smaller size enabling it to fit into the PBRs for indoor mass cultivation (2) longer life expectancy by 941%, 500% stronger intensity (3) high conversion efficiency (4) tolerance for continue switching on and off (5) lower heat dissipation[9,10]. Blue LED and red LED are the crucial light wavelengths for microalgae growth and regulation of key enzymes which associated with photosynthesis and product formation.
C. vulgaris is also one of the common strains for commercial biodiesel production. However, an optimal lighting wavelength and intensity need to be found to cultivate the desired fatty acid methyl ester (FAMEs) for commercial biodiesel production, which requires increasing biomass production, so as to increase the lipid productivity[11]. There are reports on the way different light intensities and wavelengths alter the lipid profiles of microalgae[12,13]. Light irradiation can only be controlled in a close system PBRs or in a laboratory scale culture. Henceforth, PBRs has become one of the most common approaches to optimize production of biofuel with microalgae[13]. In our previous study, PBR could effectively provide a high biomass and lipid production rate[14]. In this study; we investigated the potential of C. vulgaris for nutrient removal in BG-11 culture medium and wastewater, by analyzing its biomass growth and lipid production under varied light conditions. In the end, algal cultivation is to be carried out in PBR with an internal LED illumination system to remove nutrients in actual wastewater collected from Hong Kong - Shek Wu Hui Sewage Treatment Works (SWHSTW).
Materials and Methods
Microalgae media and cultivation
The microalgae C. vulgaris was obtained from Nam Sang Wai in Hong Kong. In our previous studies, we observed rapid growth rate and biomass productivity with this strain[14,15]. To cultivate a live active state for our study, the strain was cultivated in a controlled growth chamber (Thermo Science classroom growth chamber) and set to 25°C under continuous illumination (approximately 50 μmol m-2 s-1 with an 18:6 light: dark cycle). Air mixing was supplied by air pump (Hailea V-30) installed with a filter (ADVANTEC DISMIC-250CS, 0.45 μm). C. vulgaris was cultivated in BG-11 medium.
Cultivation medium for experiment
For the analysis of light regimes and intensity, BG-11 culture medium[16] was prepared for the cultivation of C. vulgaris in our experiment. All media were prepared and autoclaved (121°C for 1 hour.). The chemical was added into Milli-Q water (with filtration and deionization). All chemicals used were analytical grade. In the final stage of our study, C. vulgaris was cultivated with primary settled sewage collected from Hong Kong Shek Wu Hui Sewage Treatment Works (SWHSTW) to prove the feasibility of using our cultivation system.
Experiment setup
An internal LEDs-illuminated photobioreactor (PBR), which was designed and constructed in our previous research, was used with some modification in this study[14]. The PBR was made with transparent acrylic materials. The PBR design is shown in Figure 1. The dimension of the column PBR was 60.0 cm (height) × 20.0 cm (diameter), with openings at the top and bottom. The thickness of the column wall was 0.3 cm. The perforated pipe sparger was located 3 cm from the bottom of the reactor with a supply of ambient air at the flowrate of 1 L/min. The PBR received artificial aeration through an air pump (Hailea V-30) and an installed filter (ADVANTEC DISMIC-250CS, 0.45 μm). Internal LED strips of three different colors, which were red, blue and cool white, were built in the inner tube of the PBR. The colors, wavelengths and various light intensities are shown in Table 1. The switchers could control the on/off of the LED strip and its light intensity. The inner tube (light source) was positioned 1 cm away from the culture to avoid damage to microalgae by overheating[17]. Light intensity was measured with a scientific light meter (International Light Technologies ILT 1400). The PBR was placed in a cabinet covered with a black cloth to minimize the effect of light disturbance. C. vulgaris was cultivated in the PBR under batch mode cultivation. The cultivation time for this experiment was 10 days with 18:6 light/dark cycles, and with an initial cell concentration of C. vulgaris of approximately 1 x 10⁶ cells/ml. Each experiment was performed in triplicates so as to ensure reproducibility of results.
Table 1: Illumination setting and parameters of the internal LEDs-illuminated photobioreactors.
| LED color | LED wavelength | Irradiance, PAR value (μmol m-2 s-1) | |||
|---|---|---|---|---|---|
| Red | 660 nm | 50 | 70 | 90 | 110 |
| Blue | 457 nm | ||||
| Cool white | 5300 K | ||||
At the first stage of our experiment, optimal light wavelengths for C. vulgaris were determined using different light wavelengths of the PBR (red, blue and cool white, with 50 μmol m-2 s-1). For the experiment result with various regimes, the growth of C. vulgaris was further optimized with the best light wavelengths with varied light intensities of 50, 70, 90, 110 μmol m-2 s-1. The effects of dry biomass concentration, growth rate, cells per ml, change of nutrient concentration (nitrogen, phosphorus) were all investigated within the cultivation period. Finally, algal cultivation is to be done in our PBR with 110 μmol m-2 s-1 aims at removing nutrients in wastewater collected from Hong Kong - Shek Wu Hui Sewage Treatment Works (SWHSTW)[18].
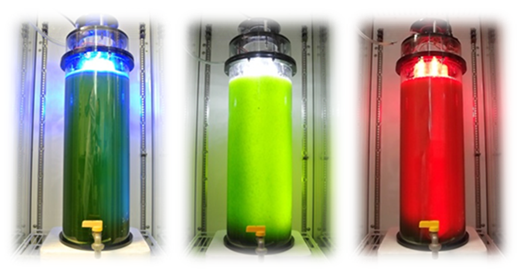
Figure 1: The Internal LEDs-Illuminated Photobioreactor.
Measurement of cell numbers, biomass and specific growth rate
The “Phytoplankton Counting Techniques” [19] method was used to determine cell count (cells mL-1) by counting cell chambers (Sedgwick-Rafter) through a light microscope. Algal biomass samples were filtered using glass fiber filter paper (ADVANTEC type GC-50, 47 mm diameter, 0.45 μm). The dry weights of the algal samples were measured by drying the filter paper at 105°C overnight. The initial and final weight of the filter paper was weighed using the lab analytical balance (AND HR-200). Biomass content was calculated from microalgae dry weight produced per liter (mg/L). The specific growth rate (μ) at the exponential phase was calculated using the following equation:
μ = Ln (x2/x1)/(t2−t1) (1)
where x2 and x1 are the final and initial biomass concentrations at times t2 and t1, all respectively.
Measurement of nutrient concentration in the cultures
For nutrient analysis, (Nitrogen-Nitrate, Nitrogen-Ammonia and Phosphorus-Orthophosphate), the samples were filtered through glass fiber filter paper (ADVANTEC type GC-50, 47 mm diameter, 0.45 μm) and frozen at -35°C for later analysis. On the day of nutrient analysis, the samples were thawed and allowed to reach room temperature. A UV-1800 UV spectrophotometer (Shimadzu) was used to measure the wavelength to analyze the nitrate concentration. Nitrate concentration (NO3--N) was measured using the standard method for Nitrogen–Nitrate (NO3 --N) Ultraviolet spectrophotometric screening method at 220 nm and 275 nm[20]. Phosphorus concentration (PO43--P) was measured using the Phosphorus-Orthophosphate, PO43--P ascorbic acid method[21]. A DR/890 portable colorimeter (HACH Company, Colorado, and U.S.) and appropriate test kits were used to analyze nutrient content. Method 8155 Nitrogen, Ammonia (0 to 0.5 mg/L NH3-N) for water, wastewater, and seawater, Method 10071 Nitrogen, Total, Test ‘N Tube (0 to 25.0 mg/L N) for water, wastewater, and Method 8048 Phosphorus, reactive (0 to 0.50 mg/L PO43-) for water, wastewater and seawater, Phosphorus, Total USEPA PhosVer® with Acid Persulfate Digestion Method Test ‘N Tube™ Vials (0.02 to 1.10 mg/L P) of the DR/890 portable colorimeter procedures manual (HACH Company, Colorado, U.S.) was followed. The maximum theoretical and expected nutrient concentrations were calculated and the sample was diluted if needed.
Determination of lipid content
Total lipid content was determined using Bligh and Dyer (1959) with modifications[22]. C. vulgaris culture was isolated and freeze dried (Labconco free zone 4.5). Approximately 0.05g of freeze dried algae sample was used for lipid extraction. The lipid extraction using a mixture of 2 ml chloroform and 2 ml methanol (1:1)[22]. 2 ml of 0.88% NaCl was added to the mixture to improve the performance of lipid extraction. The mixture was shaken vigorously and centrifuged at 5000 rpm for 3 minutes. Methanol/water (top phase) and chloroform (bottom phase) were observed. The chloroform layer was further purified sodium sulphate anhydrous powder and collected into the weighted beaker. The organic solvents inside were evaporated by flushing under high purified nitrogen gas. The remaining lipids were weighed. This provided the percentage of lipids in algal dry weight. Lipid productivity (mg/L) was calculated using the formula:
Lipid content (%) x dry biomass (mg/L) (2)
Optimization of light intensity of the photobioreactor using Response Surface Methodology
Optimization of the light intensity in specific wavelengths was carried out using Matlab R2015a version. Ideal cultivation time and light intensity for C. vulgaris were identified via different experiments, to improve the biomass production. Response surface methodology was used to determine the optimal light intensity for the growth of C. vulgaris. The response surface plot was fitted by second-order model.
Statistical analysis
All experiment results were expressed as means of ± standard deviation (SD) from each of the experiments. The statistical analysis was carried out using SPSS software (Version 21). The lighting condition was tested statistically using oneway analysis of variance (ANOVA) and post-hoc Turkey’s honestly significant difference (HSD) test. The significant level was set to P < 0.05.
Results and Discussion
Effect of growth rate of C. vulgaris in different illumination color and wavelength
In this study, batch cultures of C. vulgaris were cultivated in BG-11 medium prior to nitrogen depletion and the effect of light regimes[23]. ANOVA indicated that the light regime significantly (p < 0.05) affected the dry biomass concentration of C. vulgaris in the cultivation period. Figure 2a shows the dry biomass concentration of C. vulgaris under different wavelengths. The cultures were sampled at 48-hours intervals with an initial dry biomass concentration of 176 mg/L. Generally, the dry biomass of the batch cultures increased from day 1 to 10. From the overall trend in growth rates, C. vulgaris grows best under cool white light compared to blue and red lights. When compared to the other light conditions, a significant higher growth rate was observed in the cool white illumination condition starting from day 5. After day 7, the growth tended to slow down due to nutrient depletion (Figure 3a and Figure 3b). C. vulgaris showed a decrease in biomass concentration under the red light condition after day 7. Figure 4 illustrates the concentration of cell numbers of C. vulgaris in different light regimes. C. vulgaris reached the highest cell numbers per ml in cool white light at day 10 of the cultivation period, with 2.19 x 10⁷ cells/ml (Table 2). The C. vulgaris cultivated in cool white light showed a higher specific growth and division rates.
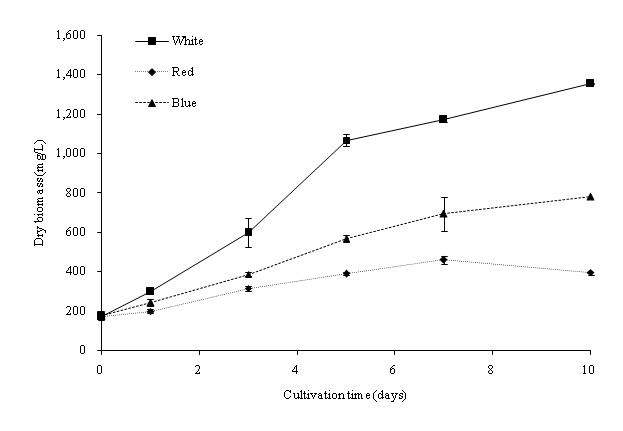
Figure 2a: Dry biomass concentration of C. vulgaris in different wavelengths.
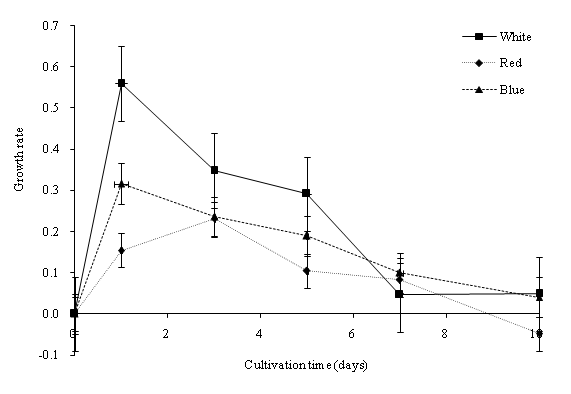
Figure 2b: Growth rate of C. vulgaris in different wavelengths.
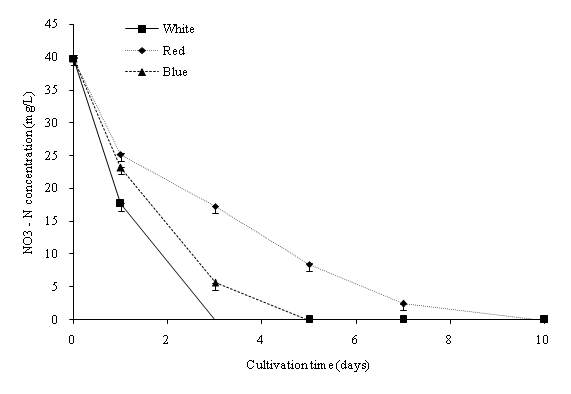
Figure 3a: NO3-N concentration (mg/L) in different wavelengths
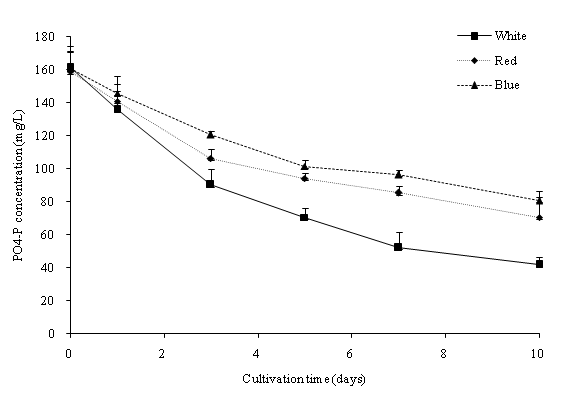
Figure 3b: PO4-P concentration (mg/L) in different wavelengths.
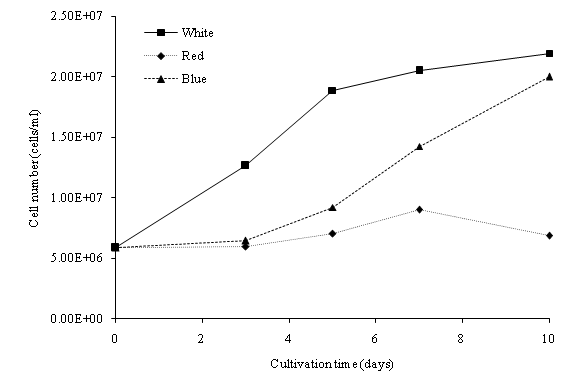
Figure 4: Growth curve (cells/ml) of C. vulgaris in different wavelength.
The absorption of light from the artificial LEDs is done by the photosynthetic organelles, depending on the chemical nature of pigments in C. vulgaris. The pigment group includes chlorophylls, carotenoid and phycobilins[24]. For a better growth of the microalgae, the exposure of light regimes (wavelengths) in the cultivation period should match the pigments absorption band. The absorption band of the chlorophyll of C. vulgaris is blue and red region[11]. Cool white LEDs provide both the red and blue spectrums which are the most efficient light source[11,24]. In recent studies, red light has been reported more effective than blue light for photosynthesis and biomass production[17,25]. Red emission spectrum fits the excited states of ‘a and b’ chlorophylls, which is the pigment in light harvesting antenna complexes (LHC) of green microalgae[11]. However, in our study, C. vulgaris worked more efficiently in blue light than in red light. Overall, cool white light (composed of red, blue and visible light wavelengths) showed a better growth rate of C. vulgaris in our PBR system.
Table 2: Cell concentration, dry weight and end point pH value of C. vulgaris cultured under different light regimes.
| Treatment | Cell concentration (x 107cells/ml) | Dry weight (mg/L d-1) | Maximum dry weight (mg/L) | End point pH |
|---|---|---|---|---|
| Cool White | 2.19 ± 0.15a | 118.33 ± 1.75a | 1170 ± 10.00a | 8.85 ± 0.15 |
| Blue | 2.00 ± 0.05a | 60.33 ± 2.08a | 780.00 ± 5.88a | 8.95 ± 0.10 |
| Red | 0.68 ± 0.03b | 22.67 ± 1.52b | 458.33 ± 18.92b | 8.95 ± 0.12 |
Each value is the mean of triplicated results. For each factor, different superscripts across a column indicate significant differences between means (ANOVA, Tukey’s test, p < 0.05). Data are mean ± standard deviation.
Optimization of the biomass production with increasing light intensity
Light is important for C. vulgaris photosynthesis: excess or insufficiency results in a poor performance of the biomass yield. The increasing light intensity can further increase the biomass production of C. vulgaris. However, microalgae growth is inefficient at an extreme high light intensity due to the occurrence of photo inhibition, and this also affects the growth of microalgae[26]. At the second stage of the experiment, the cool white light intensity varied with 50, 70, 90 and 110 μmol m-2 s-1. We assumed that the biomass production in the cultivation period gently increased to the optimal point and then decreased afterward. One-way analysis of variance (ANOVA) revealed that the variation of light intensity (cool white light) was significant (p < 0.05) for the dry biomass concentration in the cultivation period. A three-dimensional plot of the response surface methodology (RSM) was used to analyze the effects between varied light intensity, cultivation time (day) and the dry biomass concentration. The response surface plot for the evaluated response of the light intensity is presented in Figure 5. The correlation coefficient (R²) gives an indication of the regression of the model. In optimizing a response surface, a second degree fit of the model was applied to avoid poor or ambiguous results[27]. The value of the correlation coefficient (R2) of the response surface plot was 0.9297. It additionally showed that 7.03% of the total variability could not be explained by the model. Moreover, R² value was adjusted to correct the response surface plot for the light intensity and cultivation time relative to the dry biomass concentration. This resulted with R2adj = 0.9101. When the values of R2 and R2adj were higher, the degree of fitness was closer to the model[28]. This model diagnostic is appropriate to explain the effect of the changing light intensity. Deduced by the optimal point of the response surface plot, the dry biomass concentration was the highest at 1503 mg/L, at the cultivation time 10.32 day, and light intensity of 107 μmol m-2 s-1.
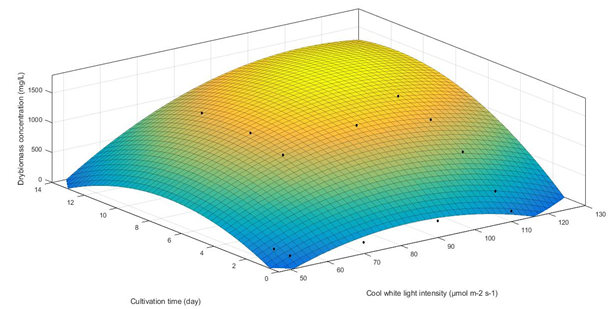
Figure 5: Effect of cool white light intensity and cultivation (day) on growth (dry biomass) concentration of C. vulgaris. Predicted response surface plot, light intensity range from 50 to 130 μmol m-2 s-1 and cultivation time range from 0 to 14 days. The dots indicate the actual readings from our experiment. Yellow color represents the highest flocculant concentration, while dark blue represents the lowest.
Higher irradiance positively affected the dry biomass concentration and growth rate of C. vulgaris within the cultivation period. In our experiment result, a maximum biomass concentration of 1353.33 mg/L was observed at 110 μmol m-2s-1 during the 7th culture day (Figure 6a). The overall dry biomass productivity (mg/L d-1) observed was 50 μmol m-2s-1, 21.70; 70 μmol m-2s-1, 110.67; 90 μmol m-2s-1, 106.53; 110 μmol m-2s-1, 117.23. In comparison with stage one of our studies, the C.vulgaris achieved a higher growth rate with an increased light intensity. A higher light intensity is enough to saturate the large volume fraction of the PBR, and result in a higher growth rate[26]. The dry biomass concentration of C. vulgaris increased until the saturation intensity and nitrogen depletion were observed. The light intensity of 50 μmol m-2s-1 showed a slow growth rate of C. vulgaris. However, at a 110 μmol m-2s-1 light intensity, the growth rate was slower when compared with a 90 μmol m-2s-1 light intensity during the first seven days of cultivation time (Figure 6b). High light intensity resulted in photo oxidation reaction in the microalgae cells and caused the excess light not to be absorbed by the photosynthesis apparatus[29,30]. Excessive light intensity causes the photosystem to overload, with pigments bleach and a break down in the photosystem II (PS II). It was also observed that the maximum growth of C. vulgaris in 70, 90 and 110 μmol m-2s-1 light intensities occurred during the 7th day of cultivation. The growth rate of C. vulgaris dropped drastically after the 7th day of cultivation (Figure 6b). An optimized light intensity is approximately 110 μmol m-2s-1 to cultivate C. vulgaris in the PBR system, to lower the cost of biomass production and to obtain the highest biomass yield.
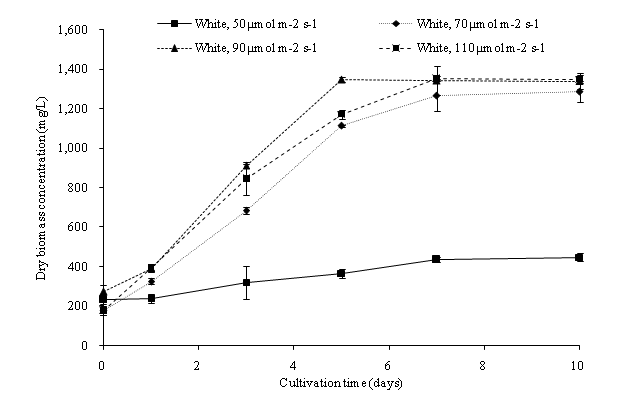
Figure 6a: Dry biomass concentration of C. vulgaris in different light intensity of cool white light.
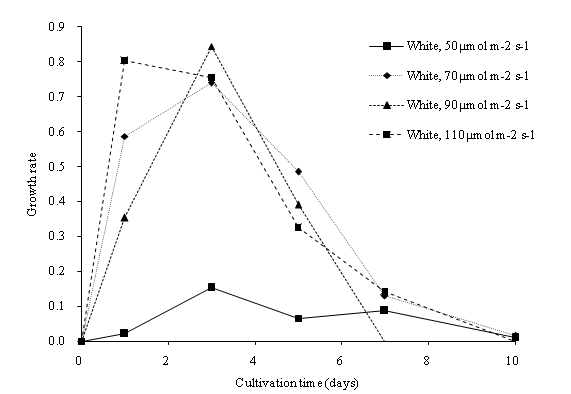
Figure 6b: Growth rate of C. vulgaris in different light intensity of cool white light.
Lipid yield and lipid productivity on different light wavelengths and intensities
Dry lipid weights indicate the amount of lipid accumulated within the cultivation period. One-way analysis of variance (ANOVA) revealed that the variation of light wavelength was significant (p < 0.05) to the lipid content of C. vulgaris. The initial lipid content on day 0 of all the cultures was 15.88%. On day 10, the percentage of lipid ranged from 23.55% to 34.06% (Figure 7a). The maximum lipid yield was obtained with the blue color at 34.06% with an 18.18% increase during the cultivation period. Cultivations in the three light colors (cool white, blue and red), both observed an increase of the lipid yield (%) in C. vulgaris. The lipid productivity of C. vulgaris was shown in Figure 7b. The initial lipid productivity on day 0 was 5.90 mg/L. The highest lipid productivity observed was with the white color of 318.63 mg/L. Overall, the lipid productivity was observed with cool white light at 31.86 mg/L d-1, blue light at 25.56 mg/L d-1 and red light at 12.90 mg/L d-1. The total lipid productivity is closely related to the dry biomass production and the lipid yield in C. vulgaris cells. C. vulgaris cultivated under blue light had the highest lipid content. However, due to the lower biomass productivity, cool white light produced the maximum lipid productivity within the cultivation period. The blue spectrum LED light affects the enzymes (Ribulose bisphosphate carboxylase/oxygenase and carbonic anhydrase) activity, and trigger a higher accumulation of triglycerides[31,32]. We found that the LED wavelengths significantly affected the biomass and lipid production of C. vulgaris cultivated in PBR.
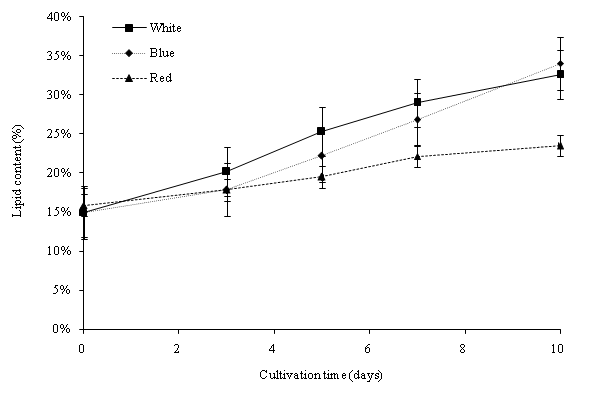
Figure 7a: Lipid content of C. vulgaris in 50 μmol m-2 s-1 in different light wavelengths
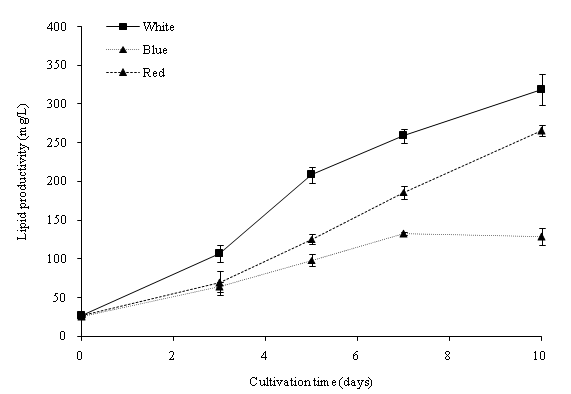
Figure 7b: Lipid productivity of C. vulgaris in 50 μmol m-2 s-1 in different light wavelengths.
The lipid productivity can be further optimized by increasing the cool white light intensity of the PBR setting and observing the change of biomass and lipid content of C. vulgaris. One-way analysis of variance (ANOVA) revealed that different cool white light intensity was significant (p < 0.05) to the lipid content of C. vulgaris. The initial lipid content on day 0 of all the cultures was 16.99%. On day 10, the percentage of lipid ranged from 32.12% to 48.79% (Figure 8a). The maximum lipid yield was obtained in cool white light of 110 μmol m-2 s-1 at an intensity of 48.79% with a 31.8% increase during the cultivation period. Cultivation in all the intensities of cool white light led to an observed increase of the lipid yield (%) in C. vulgaris. The lipid productivity of C. vulgaris is shown in Figure 8b. The initial lipid productivity on day 0 was 35.99 mg/L. The highest lipid productivity of 658.99 mg/L was observed at 110 μmol m-2 s-1 light intensity. Higher irradiance on cultivation of C. vulgaris displayed higher growth rate of microalgae cells and higher lipid productivity. Moreover, a continued increase of light intensity induces the formation of storage lipid, triglycerides. The Triacylglycerol (TAG) production acts as a protective mechanism for the cells to prevent further damage from photo oxidation[13].
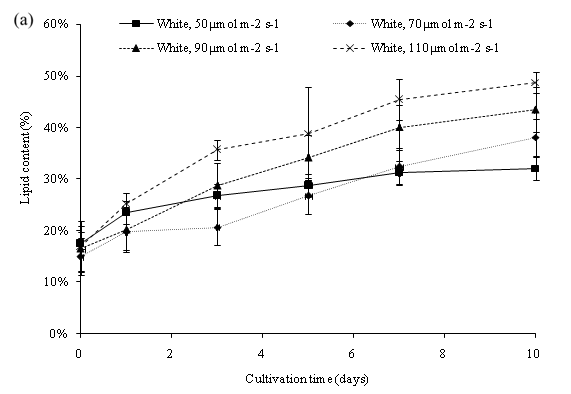
Figure 8a: Lipid content of C. vulgaris cultivated in different light intensity.
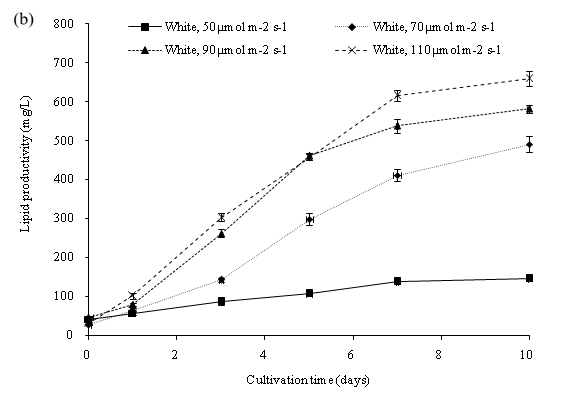
Figure 8b: Lipid productivity of C. vulgaris cultivated in different light intensity.
Wastewater treatment of Chlorella vulgaris on nutrient removal In the final stage of our study, we studied the cultivation of C. vulgaris in primary settled wastewater collected from Hong Kong - Shek Wu Hui Sewage Treatment Works (SWHSTW). The wastewater collected had passed the preliminary screening, grit removal and sedimentation process. The batch culture of C. vulgaris cultivated in our PBR under 110 μmol m-2 s-1 was studied for the uptake of nutrient in wastewater. The nutrient removal was indicated by the measurement of Total Nitrogen (TN), Total Phosphorus (TP), NO3-N, NH3-N and PO4-P.
The data presented in Figure 9 indicates that the NO3-N, NH3-N and PO4-P was significantly reduced up to 100% nutrient removal and a high dry biomass concentration of 2600.33 mg/L on the 10th day of cultivation. All nutrient concentration decreased rapidly by the assimilation of C. vulgaris within the first 6 culture days. Our study showed that C. vulgaris could use either ammonia or nitrate to be the major source of nitrogen for the growth of algal biomass[3]. However, the growth of C. vulgaris was observed under stress of nutrient limitation. The culture medium (wastewater) with higher nutrient concentration input may further achieve a higher algal biomass concentration. The results of our study showed that C. vulgaris cultivate with wastewater in PBR was efficient in producing algal biomass, and in removing nitrogen and phosphorus nutrient in wastewater sewage collected after the primary treatment process. The application of algal cultivation could be the new idea for the treatment of wastewater. The abundance of the nutrient in primary settled wastewater was sufficient for the cultivation of C. vulgaris combined with the cultivation in the PBR. Overall, microalgae could become beneficial in nutrient removal in wastewater and achieved a cost effective algal biomass production.
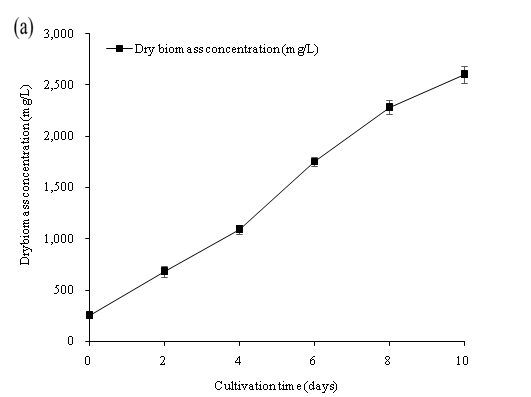
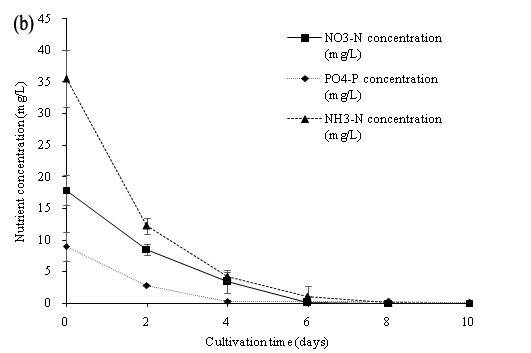
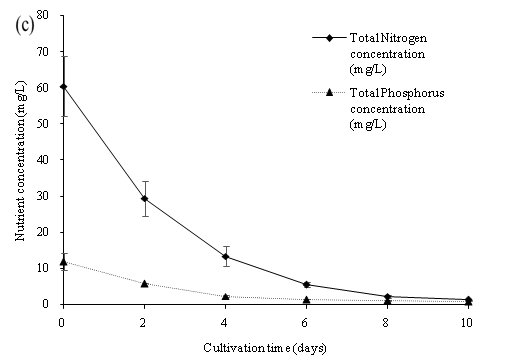
Figure 9: (a) Dry biomass concentration, (b) Nutrient concentration (NO3-N, PO4-P, NH3-N), (c) Nutrient concentration (TN and TP) of C. vulgaris cultivated in primary settled wastewater collected from SWHSTW.
Conclusion
Cool white light was the optimal LED regime (wavelength) for biomass production of C. vulgaris. Predicted from the response surface plot, the highest dry biomass concentration of 1503 mg/L was reached at cultivation time 10.32 days, at the optimal light intensity of 107 μmol m-2 s-1 for C. vulgaris cultivation in PBR. For the lipid production, cultivation under cool white light (110 μmol m-2 s-1), resulted in a highest total lipid productivity of 658.99 mg/L during the 10th culture day. To conclude, C. vulgaris cultivated with wastewater collected from SWHSTW in PBR was successful in producing algal biomass and in removing nitrogen and phosphorus nutrient in wastewater sewage.
Acknowledge:
We would like to thank The Institute for Research in Innovative Technology and Sustainability (IRITS) of OUHK for their support.
References
- 1. Zhu, L. Microalgal culture strategies for biofuel production: a review. (2015) Biofuels, Bioproducts & Biorefining 9(6): 801-814.
- 2. Jorquera, O., Kiperstok, A., Sales, E. A., et al. Comparative energy life-cycle analyses of microalgal biomass production in open ponds and photobioreactors. (2010) Bioresource technol 101(4): 1406-1413.
- 3. Wang, L., Min, M., Li, Y., et al. Cultivation of green algae Chlorella sp. in different wastewaters from municipal wastewater treatment plant. (2010) Appl biochem biotechnol 162(4): 1174-1186.
- 4. Yang, J., Xu, M., Zhang, X., et al. Life-cycle analysis on biodiesel production from microalgae: water footprint and nutrients balance. (2011) Bioresour technol 102(1): 159-165.
- 5. Lau, P.S., Tam, N.F.Y., Wong, Y.S. Effect of carrageenan immobilization on the physiological activities of Chlorella vulgaris. (1998). Bioresour technol 63(2): 115-121.
- 6. Marchello, A.E., Lombardi, A.T., Dellamano-Oliveira, M.J., et al. Microalgae population dynamics in photobioreactors with secondary sewage effluent as culture medium. (2015) Braz J Microbiol 46(1): 75-84.
- 7. Boonchai, R., Seo, G. Microalgae membrane photobioreactor for further removal of nitrogen and phosphorus from secondary sewage effluent. (2015) Korean J Chem Engg 32(10): 2047-2052.
- 8. Nave, R. Band theory of solids. HyperPhysics. Georgia State University. (2014)
- 9. Chen, C.Y., Yeh, K.L., Aisyah, R., et al. Cultivation, photobioreactor design and harvesting of microalgae for biodiesel production: a critical review. (2011) Bioresour technol 102(1): 71-81.
- 10. Kim, D.G., Lee, C., Park, S.M., et al. Manipulation of light wavelength at appropriate growth stage to enhance biomass productivity and fatty acid methyl ester yield using Chlorella vulgaris. (2014) Bioresour technol 159: 240-248.
- 11. Khalili, A., Najafpour, G.D., Amini, G., et al. Influence of nutrients and LED light intensities on biomass production of microalgae Chlorella vulgaris. (2015) Biotechnology and Bioprocess Engineering 20(2): 284-290.
- 12. Liang, Y., Sarkany, N., & Cui, Y. Biomass and lipid productivities of Chlorella vulgaris under autotrophic, heterotrophic and mixotrophic growth conditions. (2009) Biotechnol letters 31(7): 1043-1049.
- 13. Sharma, K. K., Schuhmann, H., Schenk, P. M. High lipid induction in microalgae for biodiesel production. (2012) Energies 5(5): 1532-1553.
- 14. Wong, Y.K., Yung, K.K.L., Tsang, Y.F., et al. Scenedesmus quadricauda for Nutrient Removal and Lipid Production in Wastewater. (2015) Water Environ Res 87(12): 2037-2044.
- 15. Wong, Y.K., Tsang, Y.F., Leung, C.C., et al. Enhanced Biomass and Lipid Production of Chlorella vulgaris by Adjustment of Cultivation Conditions. (2014) International Conference on Biological Waste as Resource, with a Focus on Food. Hong Kong 121.
- 16. Rippka, R., Deruelles, J., Waterbury, J.B., et al. Generic assignments, strain histories and properties of pure cultures of cyanobacteria. (1979) Microbiology 111(1): 1-61.
- 17. Koc, C., Anderson, G.A., Kommareddy, A. Use of red and blue light-emitting diodes (LED) and fluorescent lamps to grow microalgae in a photobioreactor. (2013) Isr J Aquac-Bamidgeh 65: 797-805.
- 18. Yee-keung, W., Kin-chung, H. Optimization for cultivation of microalgae Chlorella vulgaris and lipid production in photobioreactor. (2015)
- 19. American Public Health Association, America Water Works. (1995). 10200 F. Phytoplankton Counting Techniques. Washington, DC, USA.
- 20. American Public Health Association, America Water Works. (1998). Standard methods for the examination of water and wastewater. NO3- spectrophotometric screening method. Washington, DC, USA.
- 21. American Public Health Association, America Water Works. (1995). Standard methods for the examination of water and wastewater. Phosphorus-Orthophosphate, PO43-P ascorbic acid method. Washington, DC, USA.
- 22. Bligh, E.G., Dyer, W.J. A rapid method of total lipid extraction and purification. (1959) Canadian j biochem physiol 37(8): 911-917.
- 23. Lohman, E.J., Gardner, R.D., Pedersen, T., et al. Optimized inorganic carbon regime for enhanced growth and lipid accumulation in Chlorella vulgaris. (2015) Biotechnology for biofuels 8: 22.
- 24. Carvalho, A.P., Silva, S.O., Baptista, J.M., et al. Light requirements in microalgalphotobioreactors: an overview of biophotonic aspects. (2011) Appl microbiol biotechnol 89(5): 1275-1288.
- 25. Hultberg, M., Jönsson, H.L., Bergstrand, K.J., et al. Impact of light quality on biomass production and fatty acid content in the microalga Chlorella vulgaris. (2014) Bioresour technol 159: 465-467.
- 26. de Mooij, T., de Vries, G., Latsos, C., et al. Impact of light color on photobioreactor productivity. (2016) Algal Research 15: 32-42.
- 27. Myers, R.H., Montgomery, D.C., Anderson-Cook, C.M. Response surface methodology: process and product optimization using designed experiments (Vol. 705). (2009). John Wiley & Sons.
- 28. Coward, T., Lee, J.G., Caldwell, G.S. Development of a foam flotation system for harvesting microalgae biomass. (2013) Algal Research 2(2): 135-144.
- 29. Richmond, A. Biological principles of mass cultivation. (2004) Handbook of microalgal culture: Biotechnology and applied phycology 125-177.
- 30. Seyfabadi, J., Ramezanpour, Z., Khoeyi, Z.A. Protein, fatty acid, and pigment content of Chlorella vulgaris under different light regimes. (2011) Journal of Applied Phycology 23(4): 721-726
- 31. Atta, M., Idris, A., Bukhari, A., et al. Intensity of blue LED light: a potential stimulus for biomass and lipid content in fresh water microalgae Chlorella vulgaris. (2013) Bioresour technol 148: 373-378.
- 32. Teo, C.L., Atta, M., Bukhari, A., et al. Enhancing growth and lipid production of marine microalgae for biodiesel production via the use of different LED wavelengths. (2014) Bioresour technol 162: 38-44.


