
Effect of Four Different Meal Types on Postprandial Oxidative Stress: A Randomized Crossover Study with Healthy Subjects
Ruth Chan1*, Sin Li1, Siu-Wai Choi2, Erica Weilan Wang2, Jason Leung11, Iris Benzie2, Mandy Sea1, Jean Woo1
Affiliation
- 1The Chinese University of Hong Kong, Hong Kong
- 1The Hong Kong Polytechnic University, Hong Kong
Corresponding Author
Ruth Chan, Address: Rm 124021, 10/F Lui Che Woo Clinical Sciences Building, Prince of Wales Hospital, Shatin, Hong Kong, Tel: +852 2632 2190; E-mail: ruthchansm@cuhk.edu.hk
Citation
Chan, R., et al. Effect of Four Different Meal Types on Postprandial Oxidative Stress: A Randomized Crossover Study with Healthy Subjects. (2016) 3(2): 320-330.
Copy rights
© 2016 Chan, R. This is an Open access article distributed under the terms of Creative Commons Attribution 4.0 International License.
Keywords
Postprandial oxidative stress; Diet; Allantoin; F2-isoprostanes
Abstract
Diet is one factor influencing postprandial oxidative stress (POS). Previous trials mainly used 'artificial meals' to examine the effect of diet on POS, which could give results that are not representative of the real life postprandial situation. This study evaluated the acute effect of four distinct 'real-life' meal types on POS. Thirty three heathy non-obese adults were randomized to receive one of the tested meals capturing distinct features of meals of Cantonese, Northern Chinese, South Indian and American in a series of four one-day studies. Fasting, two, four and six hours postprandial responses of biomarkers of oxidative stress, plasma glucose, lipids and high-sensitivity C-reactive protein (hsCRP) were measured. Mean plasma allantoin concentration significantly increased for all meals at two-hours after ingestion, levels peaked at four-hours and declined by 6-hours post-ingestion, though baseline levels regained only with the Cantonese meal. The magnitude of postprandial increase in plasma allantoin concentration was smallest with the Cantonese meal and greatest with the American meal. These was less marked differences in postprandial changes in urine F2-isoprostanes (F2-IsoPs) across meals, but urine F2-isoPs concentrations significantly increased for each meal during the six-hour postprandial period. There were differential meal effects on the postprandial changes in plasma glucose and triglyceride concentrations. Postprandial triglyceride levels significantly increased for all meals except for the Cantonese meal. Plasma hsCRP did not change with time or meal type. Our study demonstrates significant differential acute effects of four distinct meal types on POS in healthy adults.
Introduction
Cardiovascular and metabolic diseases are the major global health burden. One of the important causal factors underlying development of these diseases is oxidative stress, and this is known to increase after intake of food and be affected by the meal components[1]. This state of ‘postprandial oxidative stress’ (POS) can trigger inflammation, endothelial dysfunction and a series of other atherogenic changes, which in turn increases risk of NCDs[2]. In modern societies, most individuals spend a significant part of the day in the postprandial state[2,3]. It is common that people living in a particular region usually consume certain typical meals of such region for the three meals a day. It can therefore be assumed that if certain meal types may result in a chronically higher level of POS, such meal types could possibly trigger the predisposition to chronic diseases[4].
Dietary habits and food cultures vary greatly in the world. A typical contemporary American diet is generally characterized by larger portion sizes and foods that are usually high in fat, low in fiber and extremely heavy in refined carbohydrates[5]. Meanwhile, diets in Southeast Asia are generally of smaller portion size, rice based and are characterized by a wide variety of vegetables[5,6]. Similarly there is a wealth of evidence documenting geographic variations in dietary habits and food cultures observed within populations of the same ethnicity[5,6]. For instance, regional cultural differences vary greatly within China, giving rise to the different styles of food across the nation. Diets in Southern China are rice based and characterized by a greater variety of vegetables and less oily dishes. In contrast, diets in the north are wheat based, more oily and feature less variety of vegetables.
Over the past decades, several controlled human trials have compared the effect of various dietary components on POS[7,8], but most focused on examining how a single nutrient component or factor affected POS, for example, low glycemic index (GI) meal vs. high GI meal[7], low fat meal vs. high fat meal[9]. Furthermore, the majority have used solid or liquid ‘artificial meals’, which could give results that are not representative of the real life postprandial situation[3,4,9,10]. Very few studies have investigated the effects on POS of meals from different regions or ‘mixed meals’. This was the main focus of the current study, in which the effect of four mixed-food meals on POS was studied in a ‘real-life’ approach. It should be highlighted that this study did not aim to examine the effect of single nutrient component or dietary factor on POS. In contrast, this study used a meal type approach instead of a single nutrient component approach since people consume meals with combinations of various nutrients and it may be unnecessary to elucidate every mechanism of every individual nutrient or foods. Therefore, the meals in the study were designed to be distinct in terms of content and quantity and were from four different regions of the world, namely; American (Western), South Indian, Northern Chinese and Southern Chinese (Cantonese). The hypothesis was that different types of meals would induce different degrees of POS measured using plasma allantoin and urine F2-isoprostanes (F2-IsoPs). Effects on plasma glucose, lipids, and high-sensitivity C-reactive protein (hsCRP), a biomarker of inflammation, were also investigated.
Materials and Methods
Study population
Thirty-three healthy, non-obese Chinese adults (eight male and 25 female) were recruited for the study through emails and posters between January and June 2014. Subjects had to meet the following inclusion criteria: aged between 18 and 45 years for female (to avoid menopausal effects) and 18 to 50 years for male, without known major medical or psychological illness, and with normal glucose tolerance as assessed by fasting HbA1c of less than 6% at screening. Those who were current smokers, had regular or current use of vitamin or antioxidant supplements, concurrently participating in any clinical trial or dietary intervention program, and who were physically active as defined by three days or more of at least 30 minutes of moderate to vigorous activity weekly in the past three months, were excluded from the study. All participants were informed of all procedures, potential risks, and benefits associated with the study, and provided written consent form. The study protocol conformed to the ethical guidelines of the Declaration of Helsinki, was approved by the Clinical Research Ethics Committee of The Chinese University of Hong Kong, and was registered at Clinical Trials.gov (NCT02006771).
Sample size calculation
To the best of our knowledge, no study has examined the postprandial changes in biomarkers of oxidative stress as proposed in the present study. Therefore, we used two approaches for sample size determination. First, most trials examining how a single nutrient component or a tested meal affected POS, using artificial solid or liquid ‘meals’ in healthy subjects had showed significant results with a sample size of 20 or below[4,7,9]. Second, considering that the present study was of exploratory in nature, a minimum sample size of 30 was chosen[11].
Trial procedures
A series of four one-day studies, with each study day separated by at least one week washout for each participant was conducted. Participants were asked to maintain their usual diet and physical activity level between study days. On each study day, participants reported to the study clinic in the morning after at least 10-hour overnight fast. After pre-meal blood and urine samples were collected, participants were assigned randomly to one of the four meals, namely Southern Chinese (i.e. Cantonese), Northern Chinese, South Indian and American, and were asked to consume the freshly prepared meal within 30 minutes. Randomization of tested meals was done using a random number selection process generated by the study staff. Neither the study staff nor the participants could be blinded to the content of the meals. During the 6-hour postprandial period, three additional blood and urine samples were collected at 2, 4 and 6 hours. During this time, participants remained supervised in the study clinic or in close proximity and were kept as sedentary as possible. No other foods or beverages were allowed during the 6 hours period, except water, which was allowed ad libitum. Participants returned after at least a seven day washout period and the procedures outlined above were repeated with a different type of meal for each participant. Over the course of the study, all 33 participants took all four meals.
Meal composition and nutrient profile of the cultural meals
Four meals originated from different regions, namely Southern Chinese (i.e. Cantonese), Northern Chinese, South Indian and American were chosen based on the distinct features of these meals and the feasibility of providing such meals in the study. The meals were designed to be broadly representative of a mixed meal from each region, both in content and in quantity. All meals were prepared by the research team and experienced chefs using standardized recipes. Duplicate food samples of each meal were sent to a local accredited laboratory for nutrient composition analysis. General meal composition and nutrient composition of each meal are shown in Table 1. Since the present study did not aim to examine the effect of single nutrient component or dietary factor on POS and did not intend to control for the confounding effects arising from the variations of nutrient composition among the four types of meal, the portion of each meal given to the participants were not calorie or body weight adjusted. Instead, a standard portion capturing the usual portion and the common features of a meal of each region was designed and given to the participants.
Table 1: Meal composition and nutrient content of four meals.
| Southern Chinese (i.e. Cantonese) | Northern Chinese | South Indian | American | |
|---|---|---|---|---|
| General meal composition | Jasmine rice, stir fried vegeteable with lean meat | Noodle with shredded pork in sweet sauce | Basmati rice, chicken curry, stir fried bean string, plain yogurt and Indian style pickle | Cheese hamburger, French fries and classic coke |
| Cooked weight per meal (g) | ~327 | ~642 | ~484 | ~340 plus 2 cans (660 ml) of classic coke |
| Main ingredients per meal | Cooked jasmine rice (150 g), Stir fried vegetable (0.5 medium bowl) with: - Raw Choi Sum (120 g) -Maize oil (0.5 table spoon) Stir fried meat (0.5 medium bowl) with : -Raw lean pork (100 g) -Maize oil (1 tablespoon) |
Raw Shanghai noodle (200 g) Raw shredded pork (80 g) Sweet sauce(20 g) Raw bean sprout(100 g) Vegetable blended oil (25 g) |
Cooked basmati rice( 150 g) Chicken curry (0.5 medium bowl) cooked with: -Raw chichen breast (80 g) -Raw mashed ginger( 5 g) -Raw mashed garlic (5 g) -Plain yogurt (15 g) -Turmeric powder (0.5 teaspoon) -Curry powder (0.5 teaspoon) -Raw chopped purple onion (50 g) -Raw chopped tomato (50 g) -Dried bay leaves (0.25 g) -Dried cloves (2 pieces) -Dried black pepper (3 pieces) -Dried cinnamon (1 g) -Dried cardamom (2 pieces) -Ghee (10 g) -Coconut oil (1 tablespoon) Stir fried bean string (0.5 medium bowl) with: -Raw and chopped bean string (80 g) -Dried mustard seed (0.5 teaspoon) -Dried urdhal (0.5 teaspoon) -Dried bay leaves (0.25 g) -Dried red pepper (0.125 g) -Turmeric powder (0.125 teaspoon) -Dried and shredded coconut (0.5 tablespoon) -Coconut oil (1 tablespoon) Plain yogurt (100 g) Canned Indian style pickle made with lemon, salt, chilli powder, Asafoetida and vegeteable based oil (10 g) |
Hamburger with cheese (221 g) French fries (117 g) served with 1 pack of ketchup and deep fried with canola blend oil Classic coke (2 cans) |
| Energy (kcal/meal) | 454.5 | 789.7 | 745.4 | 1127.2 |
| Protein (g/meal) | 32.7 | 35.3 | 36.3 | 31.3 |
| % protein² | 28.8 | 17.9 | 19.5 | 11.1 |
| Total fat (g/meal) | 10.1 | 17.3 | 29.5 | 37.7 |
| % total fat² | 20.1 | 19.8 | 35.6 | 30.1 |
| Saturated fat (g/meal) | 2.0 | 3.2 | 30.3 | 10.9 |
| % saturatede fat | 3.9 | 3.7 | 24.5 | 8.7 |
| Available carbohydrates (g/meal) | 57.9 | 121.3 | 82.8 | 166.2 |
| % available carbohydrates² | 50.9 | 61.5 | 44.4 | 59.0 |
| Sugar (g/meal) | 2.0 | 23.1 | 11.1 | 84.2 |
a The percentabe of macronutrient composition may not add up to 100% due to rounding up.
Sample collection and biomarker testing
On each study day, 5 ml venous blood (4 ml in heparinized tube and 1ml in a sodium fluoride container) were collected at pre-meal, and at 2, 4 and 6 hours postprandially to assess the changes in plasma allantoin, plasma glucose, lipid profile, uric acid and hsCRP. Spot urine samples (~10 ml) were collected into clean containers without preservative at as near to the same blood sampling times as possible for the measurement of F2-IsoPs and creatinine (Cr).
Blood samples were kept at 4°C before centrifugation and plasma separation. Plasma was aliquoted and stored at -80°C until thawed (once only) for testing of lipids, uric acid, hsCRP and allantoin. Glucose (in fluoride oxalate plasma) was measured on the day of collection. Urine samples were also kept at 4°C before centrifugation. Aliquots of urine for F2-IsoPs were stored at -80°C until thawed (once only) for testing. Urine Cr was measured on the day of collection. A total of 528 plasma and 528 urine samples (33 participants × 4 types of meals × 4 time points/meal) were analyzed for several biomarkers. Plasma glucose, total cholesterol (TC), high density lipoprotein cholesterol (HDLC), triglycerides (TG), uric acid, hsCRP and urine Cr were measured by commercial test kits (Roche Diagnostics). Low density lipoprotein cholesterol (LDLC) was calculated by the Friedewald calculation. Plasma allantoin and urine F2-IsoPs were measured by liquid chromatography with tandem mass spectrometry (LC-MS/MS) following published procedures[12,13]. Allantoin and F2-IsoPs are both specific biomarkers of oxidative stress. The sole source of allantoin in human plasma is from the non-enzymatic oxidation of uric acid[13]. F2-IsoPs are formed by non-enzymatic oxidation of membrane-bound arachidonic acid. F2-IsoPs are released by phospholipases, enter the circulating plasma, and are excreted in a chemically stable form in urine[14,15]. Urine F2-IsoPs are expressed as nmol/mmol Cr to adjust for differences in water content of urine.
Statistical analysis
All statistical analyses were performed using the statistical software SPSS version 21.0 (SPSS Inc., Illinois, US). For each biochemical parameter, the area under the curve (AUC) was calculated using the trapezoidal method[16]. The meal × time effect was examined using a 4 (meal) × 4 (time points) for blood and urine samples by repeated-measures analysis of variance (ANOVA). Logarithmic transformation of data was applied where appropriate. Pair wise correlations were made between biomarkers of oxidative stress and all other parameters using AUC data. All statistical tests were two-tailed, and significance was set at p < 0.05. Continuous variables are presented as mean (standard deviations) for parametric data and as median (interquartile range) for nonparametric data. Categorical variables are presented as number of subjects and percentages.
Results
Table 2 shows the general characteristics of the participants. The majority of the participants were female (75.8%). The average age of the participants was 30.2(6.1) years, and the average BMI was 20.4(2.1) kg/m².
Table 2: Characteristics of the participants (n = 33).
| Characteristic | Mean / n | SD / % |
|---|---|---|
| Age (years) | 30.2 | 6.1 |
| Weight (Kg) | 52.5 | 7.3 |
| Height (cm) | 160.3 | 7.3 |
| BMI (kg / m²) | 20.4 | 2.1 |
| Body fat (%) | 23.0 | 4.5 |
| SBP (mmHg) | 108.1 | 9.6 |
| DBP (mmHg) | 59.2 | 6.0 |
| Male | 8 | 24.2 |
| HbA1c (%) | 5.4 | 0.2 |
| Energy intake (kcal / d) | 1788.1 | 330.1 |
| % of energy from carbohydrate | 46.2 | 5.5 |
| % of energy from total fat | 35.9 | 4.9 |
| % of energy from saturated fat | 9.1 | 1.6 |
| % of energy from protein | 18.1 | 2.3 |
| Cholesterol intake (g/d) | 324.7a | 297.4 - 414.7 |
| Fiber intake (g/d) | 12.4 | 4.8 |
| Vitamin C intake (mg/d) | 54.4a | 37.4 - 78.3 |
a Data are presented as median and IQR.
The mean plasma allantoin concentration increased significantly (p < 0.05) for all meals at 2 hours after ingestion, levels peaked at 4 hours post-ingestion and had declined by 6 hours post-ingestion; however, baseline levels were regained only in the case of the Cantonese meal (Figure 1a). The 6-hour levels of allantoin remained significantly higher (p < 0.05) than at baseline with the American, South Indian and Northern Chinese meals. The magnitude of postprandial increase (as AUC) in plasma allantoin concentration after the different meals was markedly different, with the smallest value with the Cantonese meal and the highest value with the American meal. The Northern Chinese and the South Indian meals showed similar levels of postprandial change in plasma allantoin concentration (as AUC) (Table 3).
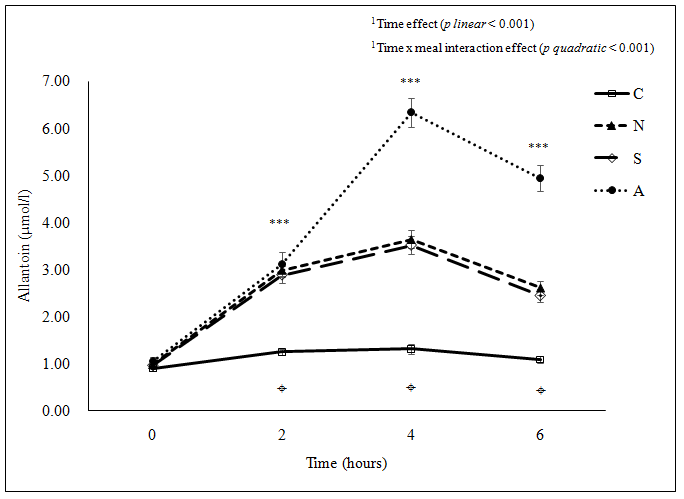
Figure 1a: (a) Plasma allantoin concentration ***Significant difference among the four meals at the same time point examined using ANOVA (p < 0.001 for 2, 4 and 6 hours); ¤Significant difference between C and all three other meals (p < 0.001) at 2 hours postprandial, between C and all three other meals (p < 0.001), between N and A (p < 0.001), and between S and A (p < 0.001) at 4 and 6 hours postprandial examined using ANOVA pair wise comparison. C: Cantonese, N: Northern Chinese, S: South Indian, A: American
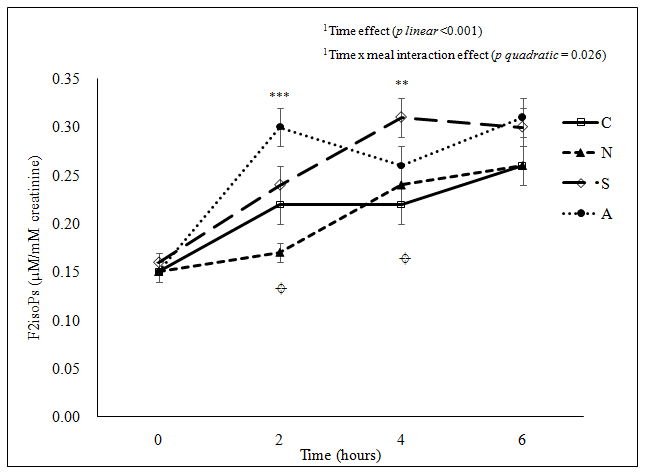
Figure 1b: (b) Urine F2-IsoPs concentration
***Significant difference among the four meals at the same time point examined using ANOVA (p < 0.001) at 2 hours; **Significant difference among the four meals at the same time point examined using ANOVA (p < 0.01) at 4 hours; ¤Significant difference between C and A (p = 0.031), between N and S (p = 0.047), and between N and A (p < 0.001) at 2 hours postprandial, and between C and S (p = 0.005) at 4 hours postprandial examined using ANOVA pair wise comparison.
C: Cantonese, N: Northern Chinese, S: South Indian, A: American
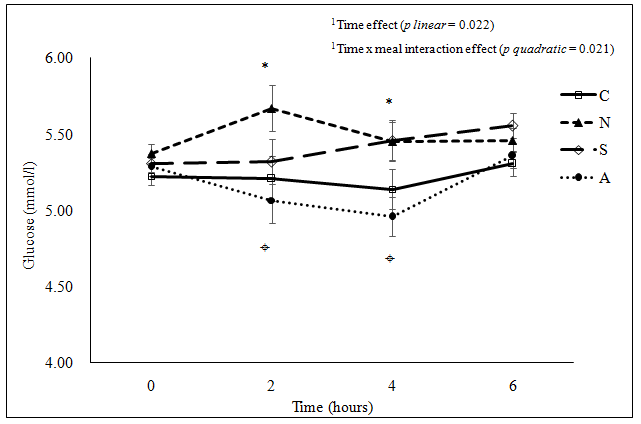
Figure 1c: (c) Plasma glucose concentration
*Significant difference among the four meals at the same time point examined using ANOVA (2 hours p = 0.042, 4 hours p = 0.014); ¤Significant difference between A and N (p = 0.037) at 2 hours postprandial, between A and N (p = 0.045) and between A and S (p = 0.039) at 4 hours postprandial examined using ANOVA pair wise comparison.
C: Cantonese, N: Northern Chinese, S: South Indian, A: American
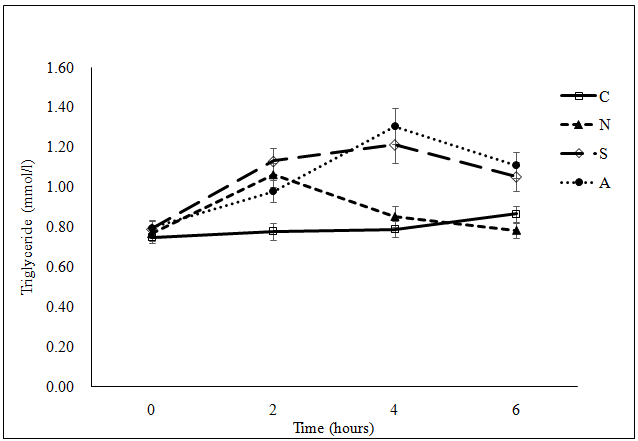
Figure 1d: (d) Plasma triglyceride concentration
***Significant difference among the four meals at the same time point examined using ANOVA (p < 0.001) at 2, 4 and 6 hours; ¤Significant difference between C and N (p = 0.003), and between C and S (p < 0.001) at 2 hours postprandial, between C and S (p < 0.001), between C and A (p < 0.001), between N and S (p = 0.003) and between N and A (p < 0.001) at 4 hours postprandial, and between C and A (p = 0.017), between N and S (p = 0.006) and between N and A (p < 0.001) at 6 hours postprandial examined using ANOVA pair wise comparison.
C: Cantonese, N: Northern Chinese, S: South Indian, A: American
Figure 1: Postprandial change in (a) plasma allantoin concentration(μmol/l), (b) urine F2-IsoPs concentration(nmol/mmol creatinine), (c) plasma glucose concentration (mmol/l) and (d) plasma triglyceride concentration(mmol/l) following the consumption of each meal type (n = 33).
Table 3: Comparison of area under curve(AUC0 - 6 hours) of postprandial changes in each parameter among the four meals (n = 33).
| Parameter | Mena | SD | p by ANOVA | pa vs. Cantonese meal | pa vs. Northern Chinese meal | pa vs. South Indian meal |
|---|---|---|---|---|---|---|
| Allantoin (μmol- h/l) | ||||||
| Cantonese | 7.13 | 2.26 | < 0.001 | ... | ... | ... |
| Northern Chinese | 16.86 | 4.30 | < 0.001 | ... | ... | |
| South Indian | 16.24 | 5.12 | < 0.001 | ns | ... | |
| American | 24.88 | 7.24 | < 0.001 | < 0.001 | < 0.001 | |
| F2IsoPs (nmol-h/ mmol creatinine) | ||||||
| Cantonese | 1.29 | 0.47 | 0.004 | ... | ... | ... |
| Northern Chinese | 1.25 | 0.46 | ns | ... | ... | |
| South Indian | 1.56 | 0.46 | 0.020 | 0.008 | ... | |
| American | 1.58 | 0.49 | 0.013 | 0.005 | ns | |
| Glucose (mmol-h/l) | ||||||
| Cantonese | 31.23 | 2.63 | 0.009 | ... | ... | ... |
| Northern Chinese | 33.07 | 2.72 | 0.018 | ... | ... | |
| South Indian | 32.42 | 3.50 | ns | ns | ... | |
| American | 30.68 | 3.53 | ns | 0.002 | 0.025 | |
| Triglyceride (mmol-h/l) | ||||||
| Cantonese | 4.74 | 1.24 | 0.009 | ... | ... | ... |
| Northern Chinese | 5.37 | 1.59 | ns | ... | ... | |
| South Indian | 6.53 | 2.40 | < 0.001 | 0.013 | ... | |
| American | 6.47 | 2.03 | < 0.001 | 0.018 | ns | |
| Total cholesterol (mmol-h/l) | ||||||
| Cantonese | 27.85 | 4.43 | 0.888 | ... | ... | ... |
| Northern Chinese | 27.00 | 50.17 | ns | ... | ... | |
| South Indian | 27.69 | 5.19 | ns | ns | ... | |
| American | 27.75 | 4.40 | ns | ns | ns | |
| HDLC (mmol-h/l) | ||||||
| Cantonese | 8.99 | 1.71 | 0.881 | ... | ... | ... |
| Northern Chinese | 8.73 | 1.71 | ns | ... | ... | |
| South Indian | 8.67 | 1.78 | ns | ns | ... | |
| American | 8.81 | 1.66 | ... | ... | ... | |
| LDLC(mmol-h/l) | ||||||
| Cantonese | 16.67 | 3.93 | 0.847 | ... | ... | ... |
| Northern Chinese | 15.80 | 4.50 | ns | ... | ... | |
| South Indian | 16.01 | 4.36 | ns | ns | ... | |
| American | 16.02 | 3.92 | ns | ns | ns | |
| Uric acid (µmol-h/l) | ||||||
| Cantonese | 1827.49 | 380.75 | 0.701 | ... | ... | ... |
| Northern Chinese | 1717.56 | 428.20 | ns | ... | ... | |
| South Indian | 1798.43 | 413.94 | ns | ns | ... | |
| American | 1757.69 | 375.73 | ns | ns | ns | |
| hsCRPb (mg-h/l) | ||||||
| Cantonese | 1.90 | 1.22 - 3.29 | 0.978 | ... | ... | ... |
| Northern Chinese | 1.96 | 1.10 - 3.65 | ns | ... | ... | |
| South Indian | 1.81 | 0.92 - 5.21 | ns | ns | ... | |
| American | 1.94 | 0.92 - 5.43 | ns | ns | ns | |
a pairwise comparison
b data are presented as median and IQR
A significant time effect and meal effect on postprandial glucose response was observed (Figure 1c). However, each meal showed a different pattern of postprandial glucose change. No appreciable change was observed in plasma glucose concentration for the American meal. Plasma glucose concentration for the Northern Chinese meal was highest at 2 hours post-ingestion and the peak level after the Cantonese and the South Indian meals was at 6 hours after ingestion (all p < 0.05 compared to the baseline value). There was significant time effect and time x meal interaction effect on postprandial change in TG concentration (Figure 1d). Postprandial TG levels significantly increased (p < 0.05) for all meals except for the Cantonese meal. The postprandial increase was greater and more prolonged for the South Indian and the American meals compared to the Northern Chinese meal.
The postprandial changes in TC, HDLC, LDLC, uric acid and hsCRP concentrations are summarized in Table 4. A significant time effect and time × meal interaction effect was observed for the postprandial changes in TC, HDLC and LDLC concentrations. Postprandial decrease in TC and HDLC concentrations was greater in the Northern Chinese meal compared to the rest of meals. The Cantonese, South Indian and American meals showed significant decrease in LDLC level at 2 and/or 4 hours post-ingestion compared to the baseline level. The Northern Chinese meal showed significantly lower LDLC concentration throughout the 6 hours postprandial period compared to the baseline value. While there was a significant time effect on postprandial uric acid response, there was no significant time x meal interaction effect detected. No significant time effect and time x meal interaction effect was detected for the postprandial change in hsCRP concentration. Results of the AUC also showed that there were significant meal differences in the postprandial changes in plasma allantoin, glucose, TG concentrations and urine F2-IsoPs level (Table 3). When considering all four meals combined and using values generated using the AUC analysis, a significant positive correlation was noted between plasma allantoin concentration and plasma TG concentration (r = 0.304, p < 0.001; n = 33).
Table 4 : Postprandial changes in total cholesterol, HDLC, LDLC, uric acid and hsCRP concentrations for each meal (n = 33).
| Parameter | 0 h | 2 h | 4 h | 6 h | Time a p linear | Time x Meala p quadratic | ||||
|---|---|---|---|---|---|---|---|---|---|---|
| Mean | SD | Mean | SD | Mean | SD | Mean | SD | |||
| Total Cholesterol (mmol/ l) | ||||||||||
| Cantonese | 4.65 | 0.79 | 4.61 | 0.72 | 4.60 | 0.75 | 4.78** | 0.74 | 0.013 | 0.007 |
| Northern Chinese | 4.61 | 0.91 | 4.46*** | 0.85 | 4.48*** | 0.86 | 4.52*** | 0.86 | ||
| South Indian | 4.61 | 0.85 | 4.57 | 0.88 | 4.59 | 0.86 | 4.75*** | 0.89 | ||
| American | 4.60 | 0.75 | 4.66 | 0.75 | 4.58 | 0.74 | 4.67 | 0.78 | ||
| HDLC (mmol/l) | ||||||||||
| Cantonese | 1.49 | 0.29 | 1.48 | 0.28 | 1.49 | 0.29 | 1.55*** | 0.29 | < 0.001 | 0.001 |
| Nothern Chinese | 1.48 | 0.30 | 1.43*** | 0.28 | 1.45*** | 0.29 | 1.49 | 0.28 | ||
| South Indian | 1.45 | 0.29 | 1.42* | 0.29 | 1.43 | 0.30 | 1.50*** | 0.32 | ||
| American | 1.47 | 0.28 | 1.48 | 0.28 | 1.45 | 0.28 | 1.49** | 0.27 | ||
| LDLC (mmol/l) | ||||||||||
| Cantonese | 2.82 | 0.71 | 2.77* | 0.64 | 2.74** | 065 | 2.83 | 0.66 | 0.002 | 0.014 |
| Northern Chinese | 2.77 | 0.81 | 2.54*** | 0.74 | 2.64*** | 0.73 | 2.67** | 0.76 | ||
| South Indian | 2.79 | 0.74 | 2.63*** | 0.74 | 2.60*** | 0.71 | 2.67 | 0.74 | ||
| American | 2.77 | 0.67 | 2.75 | 0.69 | 2.54*** | 0.64 | 2.67 | 0.71 | ||
| Uric acid (μmol/l) | ||||||||||
| Cantonese | 298.32 | 65.86 | 314.84*** | 63.81 | 302.20* | 62.34 | 295.09 | 64.05 | < 0.001 | 0.983 |
| Northern Chinese | 292.22 | 74.21 | 299.01*** | 72.48 | 280.55*** | 70.58 | 266.23*** | 68.75 | ||
| South Indian | 298.37 | 73.07 | 309.92*** | 69.83 | 297.66 | 68.04 | 286.11*** | 66.32 | ||
| American | 297.58 | 67.27 | 306.19*** | 66.23 | 287.31*** | 63.56 | 273.11** | 65.11 | ||
| hsCRPb (mg/l) | ||||||||||
| Cantonese | 0.33 | 0.20 - 0.53 | 0.31 | 0.21 - 0.54 | 0.31 | 0.21 - 0.56 | 0.30 | 0.20 - 0.59 | 0.784 | 0.688 |
| Northern Chinese | 0.36 | 0.19 - 0.61 | 0.34 | 0.17 - 0.60 | 0.29 | 0.18 - 0.62 | 0.32 | 0.18 - 0.68 | ||
| South Indian | 0.32 | 0.16 - 0.94 | 0.31* | 0.15 - 0.85 | 0.29** | 0.14 - 0.86 | 0.31 | 0.17 - 0.87 | ||
| American | 0.36 | 0.16 - 0.83 | 0.32 | 0.15 - 0.76 | 0.31* | 0.15 - 0.76 | 0.28 | 0.16 - 0.75 | ||
a Time effect and time x meal interaction effect were examined using repeated measures of ANOVA
b Data are presented as median and IQR, the original data of hsCRP were logarithmic transformed for repeated measures of ANOVA
*p < 0.05 vs. 0 h; **p < 0.01 vs. 0 h; ***p < 0.001 vs. 0 h examined using pair sample t text for parametric data and Wilcoxon signed rank test for non-parametirc data.
Discussion
To our knowledge, this is the first study to compare the postprandial change in specific biomarkers of oxidative stress with distinct meals originated from different regions, using a ‘real-life’ study approach. Our findings show marked differences in the postprandial change in plasma allantoin among the four tested meals, whereas there was less marked difference in the postprandial changes in urine F2-IsoPs among the meal types. Of particular importance, while the plasma allantoin concentration of the Cantonese meal returned to the baseline level at 6 hours post-ingestion, the concentration remained high for the other three meals compared to their corresponding baseline values. Furthermore, urine F2-IsoPs level, considered as a biomarker of oxidative stress and lipid peroxidation, remained high for all meals at 6 hours post-meal period. It is unknown whether or not the urine F2-IsoPs values would have continued to increase beyond this period, due to our cessation of sample collection at the 6-hour postprandial time. Besides, there were differential meal effects on the postprandial changes in plasma triglyceride concentration. A significant positive correlation between plasma allantoin concentration and plasma triglyceride concentration was also noted. There were no significant postprandial differences in plasma hsCRP concentration among the tested meals.
As to our hypothesis, the POS was different among the four tested meals. The magnitude of postprandial increase in plasma allantoin concentration was lower for the Cantonese meal when compared to that of the other three meals. This could be due to the lower quantity of fat in the Cantonese meal, especially of saturated fat, or its lower energy content, or a combination of both, when compared to the other three types of meals. There have been few studies examining the effect of meals on POS with study design similar to a ‘real-life, cultural meal’ approach[1,3,4,17]. Our findings are consistent with those previously reported and generally support that a meal rich in fat, in particular saturated fat and carbohydrate is associated with greater increase in POS[1,3,4]. Devaraj et al. compared the postprandial effects of a fast-food-style (FFS) meal (consisting of burger, fries, and drink) with a heart-healthy (HH) meal (consisting of bagel, cheese, fruit, and milk) on biomarkers of oxidative stress in 11 subjects with metabolic syndrome in a randomized crossover study. Plasma concentrations of biomarkers of oxidative stress after consuming the FFS meal were significantly higher at the postprandial state than those following the HH meal[3]. Ursini et al. (1998) also demonstrated a significant 123% postprandial increases in plasma lipid peroxides at 2 hours after consuming a tested meal (English breakfast providing 11% protein, 34% carbohydrate, and 55% fat, approximately 1200 kcal) in 9 healthy males, and the lipid peroxides concentration returned to baseline levels, corresponding to the usual postprandial hyperlipidemia[1].
In this current study, the American meal showed the greatest postprandial change in both biomarkers of oxidative stress, possibly due to its relatively large meal size and high total fat, carbohydrate as well as sugar content in comparison to the other three meals. Despite the similar energy content between the Northern Chinese and the South Indian meals, the amount of total fat and saturated fat is higher in the South Indian meal compared to the Northern Chinese meal. Thus, it is reasonable to expect a greater POS in the South Indian meal than in the Northern Chinese meal as previous studies have shown greater POS following lipid rich meals compared to carbohydrate rich meals[9]. While the postprandial changes in both biomarkers of oxidative stress tended to be higher in the South Indian meal than the Northern Chinese meal, the differences were not as large as expected. The antioxidant properties of culinary spices used in the South Indian meal may attenuate in vivo oxidative stress, possibly through decreasing the magnitude of postprandial increases in circulating triglycerides and insulin and increasing plasma antioxidant status[17]. Further studies with inclusion of biomarkers of antioxidant activity are warranted.
Our observations that LDLC and HDLC generally decreased postprandially are consistent with those reported in other studies[18,19]. Studies have demonstrated that the induction of postprandial lipemia is accompanied by a transient increase in plasma lecithin: cholesterol acyltransferase (LCAT) and cholesteryl ester transfer protein (CETP) activities, which results in a net decrease in cholesteryl ester concentrations in both LDL and HDL[20,21]. Although our study failed to show a postprandial increase in hsCRP concentration, many studies have indicated that the transient increase in POS acutely triggers inflammation, endothelial dysfunction, and a series of atherogenic changes both in vitro and in vivo[2,22]. Of particular importance is the observation that while the plasma allantoin concentration of the Cantonese meal returned to the baseline level at 6 hours post-ingestion, the concentration remained high for the other three meals compared to their corresponding baseline values. Moreover, urine F2-IsoPs level remained high for all meals at 6 hours post-meal period. Therefore, our data support previous studies that most individuals in modern societies spend a significant part of the day in the postprandial state of elevated oxidative stress[2,3].
Compared to previous studies, our multiple cross-over study had a relatively large sample size and included common and accurate biomarkers of oxidative stress. We also used a ‘real-life, mixed meal’ approach. Our findings would therefore be much more useful and translational to individuals consuming mixed meals in a free living environment as compared to previous studies using laboratory or experimental settings[9]. However, our study has several limitations. First, we did not measure the antioxidant level and the polyunsaturated fatty acid levels of the tested meals and did not include measures of biomarkers of antioxidant capacity, specific apolipoproteins (e.g. apoB48 particles) as well as functional endpoints (e.g. endothelial function) that are of public health relevance. Second, the time points for capturing postprandial changes in plasma glucose were relatively late to detect direct meal-induced changes as the first postprandial plasma glucose sample was collected at 2 hours post-ingestion. Third, our study sample was healthy and normal weight individuals and predominated by female participants. Previous studies have suggested that postprandial responses vary with sex[23], BMI status[8], ethnicity[24] as well as metabolic status[10]. Our study included only Chinese subjects. Potential of Chinese subjects to metabolize other food type is different than their respective food eaters. Similarly South Indian subjects metabolize Chinese food differently than that of Chinese subjects. In this regard, further trials aiming to evaluate POS and other parameters by different diets would include equal number of South Chinese, Americans, South Indians and North Chinese subjects eating respective diet and all different diets to compare POS and all other parameters. Moreover, we were unable to capture the postprandial changes beyond the 6-hour postprandial time. It is unknown whether or not the urine F2-IsoPs values would have continued to increase beyond this period. Besides, our results were based on only one single meal in the morning. The effect of consecutive meals on postprandial changes in oxidative stress remains to be explored[4].
Conclusion
The present study demonstrates significant differential effects of four meal types on the POS in healthy Chinese adults. Further studies are warranted to extend the scope of this study to other populations with different ethnicity, weight and metabolic status. Inclusion of measures of biomarkers of antioxidant capacity, inflammatory status as well as functional endpoints in future studies will definitely provide valuable insight into the interplay of POS and these factors on the development of chronic diseases.
Acknowledgement:
The work was supported by funding from the General Research Fund for 2013/2014 from the Research Grants Council (CUHK 461813). We wish to thank all participants for their participation. Special thanks are given to Mr Ivan Ho, Ms Macy Kwan, Ms Suey Yeung, Ms Krystal Zhang and all phlebotomists for their assistance in the study. The skilled technical assistance of Dr Chung Wai Yuen, Mr Katherine Hiu Laam Lam, Mr Wong Chi Keung and Mr Raymond Chan Wai Ming is gratefully acknowledged.
Declaration of Conflict of Interest:
All authors declare no conflict of interest associated with this manuscript.
References
- 1. Ursini, F., Zamburlini, A., Cazzolato, G., et al. Postprandial plasma lipid hydroperoxides: a possible link between diet and atherosclerosis. (1998) Free Radic Biol Med 25(2): 250-252.
- 2. O'Keefe, J.H., Bell, D.S. Postprandial hyperglycemia/hyperlipidemia (postprandial dysmetabolism) is a cardiovascular risk factor. (2007) Am J Cardiol 100(5): 899-904.
- 3. Devaraj, S., Wang-Polagruto, J., Polagruto, J., et al. High-fat, energy-dense, fast-food-style breakfast results in an increase in oxidative stress in metabolic syndrome. (2008) Metabolism 57(6): 867-870.
- 4. Tushuizen, M.E., Nieuwland, R., Scheffer, P.G., et al. Two consecutive high-fat meals affect endothelial-dependent vasodilation, oxidative stress and cellular microparticles in healthy men. (2006) J Thromb Haemost 4(5): 1003-1010.
- 5. Albala K. Food cultures of the world encyclopedia. (2011) California: Greenwood.
- 6. Nam, K.C., Jo, C., Lee, M. Meat products and consumption culture in the East. (2010) Meat Sci 86(1): 95-102.
- 7. Botero, D., Ebbeling, C.B., Blumberg, J.B., et al. Acute effects of dietary glycemic index on antioxidant capacity in a nutrient-controlled feeding study. (2009) Obesity 17(9): 1664-1670.
- 8. Bloomer, R.J., Fisher-Wellman, K.H. Systemic oxidative stress is increased to a greater degree in young, obese women following consumption of a high fat meal. (2009) Oxid Med Cell Longev 2(1): 19-25.
- 9. Bloomer, R.J., Kabir, M.M., Marshall, K.E., et al. Postprandial oxidative stress in response to dextrose and lipid meals of differing size. (2010) Lipids Health Dis 9:79.
- 10. Belinova, L., Kahleova, H., Malinska, H., et al. Differential acute postprandial effects of processed meat and isocaloric vegan meals on the gastrointestinal hormone response in subjects suffering from type 2 diabetes and healthy controls: a randomized crossover study. (2014) PLoS ONE 9(9): e107561.
- 11. Lancaster, G.A., Dodd, S., Williamson, P.R. Design and analysis of pilot studies: recommendations for good practice. (2004) J Eval Clin Pract 10(2): 307-312.
- 12. Riso, P., Visioli, F., Grande, S., et al. Effect of a tomato-based drink on markers of inflammation, immunomodulation, and oxidative stress.(2006) J Agric Food Chem 54(7): 2563-2566.
- 13. Chung, W.Y, Benzie, I.F. Plasma allantoin measurement by isocratic liquid chromatography with tandem mass spectrometry: method evaluation and application in oxidative stress biomonitoring. (2013) Clin Chim Acta 424: 237-244.
- 14. Morrow, J.D., Hill, K.E., Burk, R.F., et al. A series of prostaglandin F2-like compounds are produced in vivo in humans by a non-cyclooxygenase, free radical-catalyzed mechanism. (1990) Proc Natl Acad Sci USA 87(23): 9383-9387.
- 15. Il'yasova, D., Scarbrough, P., Spasojevic, I. Urinary biomarkers of oxidative status. (2012) Clin Chim Acta 413(19-20): 1446-1453.
- 16. Pruessner, J.C., Kirschbaum, C., Meinlschmid, G., et al. Two formulas for computation of the area under the curve represent measures of total hormone concentration versus time-dependent change. (2003) Psychoneuroendocrinology 28(7): 916-931.
- 17. Skulas-Ray, A.C., Kris-Etherton, P.M., Teeter, D.L., et al. A high antioxidant spice blend attenuates postprandial insulin and triglyceride responses and increases some plasma measures of antioxidant activity in healthy, overweight men. (2011) J Nutr 141(8): 1451-1457.
- 18. Chung, B.H., Cho, B.H., Liang, P., et al. Contribution of postprandial lipemia to the dietary fat-mediated changes in endogenous lipoprotein-cholesterol concentrations in humans. (2004) Am J Clin Nutr 80(5): 1145-1158.
- 19. Cohn, J.S., McNamara, J.R., Cohn, S.D., et al. Postprandial plasma lipoprotein changes in human subjects of different ages. (1988) J Lipid Res 29(4): 469-479.
- 20. Castro, G.R., Fielding, C.J. Effects of postprandial lipemia on plasma cholesterol metabolism. (1985) J Clin Invest 75(3): 874-882.
- 21. Tall, A.R. Plasma cholesteryl ester transfer protein. (1993) J Lipid Res 34(8): 1255-1274.
- 22. Esposito, K., Nappo, F., Giugliano, F., et al. Meal modulation of circulating interleukin 18 and adiponectin concentrations in healthy subjects and in patients with type 2 diabetes mellitus. (2003) Am J Clin Nutr 78(6): 1135-1140.
- 23. Bloomer, R.J., Fisher-Wellman, K.H. Blood oxidative stress biomarkers: influence of sex, exercise training status, and dietary intake. (2008) Gender Med 5(3): 218-228.
- 24. Bloomer, R.J., Cole, B., Fisher-Wellman KH. Racial differences in postprandial oxidative stress with and without acute exercise. (2009) Int J Sport Nutr Exerc Metab 19(5): 457-472.


