
Effect of Obesity on the Time Required Achieving a FEO2 of 90% during Preoxygenation
Roya Yumul1, Ofelia L. Elvir-Lazo2, Xuezhao Cao3, Paul F. White4*, Jun Tang2, Thomas Jacques2, Daniel O. Iyayi2, Xiao Zhang5, Ronald H. Wender2
Affiliation
- 1Department of Anesthesiology, Charles R, Drew University of Medicine and Science, Los Angeles, CA, USA
- 2Department of Anesthesiology, Cedars-Sinai Medical Center, Los Angeles, CA
- 3Department of Anesthesiology, First Affiliated Hospital of China Medical University, Shenyang, China
- 4Department of Anesthesiology, Cedars Sinai Medical Center in Los Angeles, President, White Mountain Institute, The Sea Ranch, CA, USA
- 5Department of Biostatistics & Bioinformatics, Cedars-Sinai Medical Center, Los Angeles, CA
Corresponding Author
Paul F. White, PhD, MD, FANZCA, Department of Anesthesiology, Cedars Sinai Medical Center in Los Angeles, President, The White Mountain Institute, The Sea Ranch, CA, USA, Tel: +1 (214)-770-3775; FAX: +1 (310)-423-4119; E-mail: Paul.White@cshs.org; Whitemountaininstitute@hotmail.com
Citation
White, P.F., et al. Effect of Obesity on the Time Required Achieving a FEO2 of 90% during Preoxygenation. J Diabetes Obes (2015) 2(2): 102- 107.
Copy rights
© 2015 White, P.F. This is an Open access article distributed under the terms of Creative Commons Attribution 4.0 International License.
Keywords
Obesity; BMI; Pre oxygenation; End-tidal expiratory oxygen; Oxygen desaturation
Abstract
An end-expiratory oxygen (FEO2) concentration > 90% is desirable prior to tracheal intubation. We hypothesized that the time required for pre oxygenation to achieve an FEO2 of 90% was related to patient Body Mass Index (BMI). Seventy- seven consenting patients undergoing a rapid sequence induction were enrolled. After the anesthesia rebreathing circuit was filled with 100% oxygen for 4 min, these unpremeditated patients were instructed to breathe normally following application of a tight-fitting face mask with oxygen flowing at 10 L min-1. End-tidal oxygen and carbon dioxide values were recorded during the pre oxygenation period. Induction of anesthesia was performed when the FEO2 reached 90% or after 5 min of pre oxygenation in a standardized fashion. The times to achieve an FEO2 of 90% were 152 ± 57, 136 ± 62 and 136 ± 70 sec in the normal, overweight and obese subgroups, respectively. A total of 7 patients failed to achieve an FEO2 90% after 5 min of preoxygenation. Four patients also experienced a decrease in SpO2 < 95% during the apneic period prior to tracheal intubation (3 in the obese group and 1 in the overweight group). The mean BMI (± SD) of the patients who failed to achieve a FEO2 of 90% was 40 ± 9 kg/m². The time required to achieve an FEO2 of 90% during preoxygenation period was unrelated to the patient’s BMI. However, morbidly obese patients were more likely to experience a fall in their SpO2 to < 95% during the induction period.
Introduction
Preoxygenation prior to tracheal intubation increases the volume of stored oxygen and prolongs the time interval prior to oxygen desaturation[1-3]. Previous studies have demonstrated the importance of preoxygenation in maintaining oxygenation of vital organs during the intubation process[4,5]. The duration of apnea is influenced by atelectasis, as well as the volume of oxygen in the Functional Residual Capacity (FRC) of the lung[6]. Other contributing factors include obesity, metabolic rate, blood hemoglobin concentration and supine position[5].
Obesity is associated with decreased in the upper airway space due to a large tongue, excessive upper airway soft tissue, and reduced pharyngeal dilator muscle function[7]. Obese patients are also at risk to difficult mask ventilation and at a greater risk for oxygen desaturation during apnea due to the aforementioned anatomic changes[8]. Failure to administer high Fractional Inspired Oxygen (FiO2) concentration, and/or the presence of leak under the mask can result in suboptimal alveolar oxygenation in obese patients[9]. Even with standard preoxygenation, the duration of apnea prior to desaturation can be significantly shorter in the morbidly obese compared to patients of normal weight (196s vs. 595s)[10].
Earlier studies of preoxygenation have focused on measurements of indices reflecting on its efficacy and efficiency[11-14]. Arterial oxygen saturation[13] , pulse oximetry (SpO2)[11], alveolar de nitrogenation[14] and end-tidal expiratory oxygen (FEO2)[12] have all been used as end-points for evaluating preoxygenation. Arterial oxygen saturation is a gold standard to measure of the concentration of oxygen in the blood, but this approach is not practical in everyday clinical practice[15] SpO2 lacks sensitivity with respect to determining adequate preoxygenation[10]. FEO2, an indicator of the completeness of preoxygenation, is convenient and easy to monitor[2] Clinically, preoxygenation is considered adequate when FEO2 achieves a value > 90%[2].
Therefore, we measured the time required to achieve an FEO2 of 90% in patients with a Body Mass Index (BMI) varying from 19 - 49 kg/m2 during a standardized preoxygenation period. We sought to investigate the relationship between the time required for preoxygenation to achieve an FEO2 of 90% and the patient Body Mass Index (BMI).
Materials and Methods
After obtaining IRB approval and written informed consent, a total of 77 unpremedicated patients were recruited to participate in this study. Exclusion criteria included age < 18 yr or more than 50 yr; premedication, the presence of pre-existing pulmonary or cardiovascular disease; history of difficult tracheal intubation; history of substance abuse or smoking; and hemoglobin ≤ 12g/dl. Demographic data (e.g., age, gender, race, height, weight) were collected.
Preoxygenation and induction of anesthesia were both performed with the patients in the head-up position using multiple folded blankets. Standard monitoring equipment included an automated blood pressure cuff, ECG, SpO2 (on the index finger), and skin temperature monitor. A face mask connected to a circle breathing circuit with a Draeger Apollo’s Anesthesia Machine was used for oxygen delivery. The circuit was filled with 100% oxygen for 4 min at a rate of 10 liter min-1 to keep the reservoir bag filled and minimize rebreathing[12]. Patients were instructed to take normal breathe through a tight-fitting face mask. FEO2 and End-Tidal Carbon Dioxide (ETCO2) were both recorded at 10 s intervals during preoxygenation period using the Draeger Apollo’s Anesthesia Machine Patient Gas Monitor. Upon achieving an FEO2 ≥ 90% or at the end of a 5 min preoxygenation period, anesthesia was induced with a combination of lidocaine 100 mg, fentanyl 1.5 ug/kg, and propofol 2 mg/kg, and succinyl choline 1.5 mg/kg IV (based on Lean Body Weight [LBW]. During the apneic period prior to tracheal intubation, patients were not ventilated and airway patency was maintained with a jaw lift. Physiologic data [Mean Arterial Pressure (MAP), Heart Rate (HR), SpO2, FiO2, and Respiratory Rate (RR)] were recorded at 1 min intervals throughout the study period and FEO2, ETCO2 values were recorded at 10s interval for 5 min. For purposes of data analysis, patients were subsequently stratified into three weight categories based on their BMI: normal weight (BMI of 19-24.9 kg/m2), overweight (BMI of 25 - 29.9 kg/m2) and obese (BMI > 30 kg/m2). A post-hoc subset analysis was also performed for male and female subjects.
Sample size and power calculation
The main hypothesis is to test if the obese patients [body mass index (BMI) > 30 kg/m2] would require a longer time period to achieve an FEO2 of > 90% than non-obese patients with a BMI < 30 kg/m2. We assume that the hazard ratio is constant throughout the study and that Cox proportional hazards regression is used to analyze the data. Assuming the hazard ration is 2.0 for the non-obese versus obese group and the percentage of reaching FEO2 of > 90% is 95% for each group, a two-sided test of an overall sample size of 77 subjects (of which 50 are in the non-obese group and 27 are in the obese group) achieves 81% power at a 0.05 significance level.
Statistical analysis
Kaplan-Meier estimate and Cox regression analysis are conducted for obese group versus non-obese group and for normal weight, overweight, and obese groups as well. The distribution of variables was checked for normality by histograms and standard normality tests. If the distributions satisfy normality, then linear regression analysis was used to assess the relationship between BMI and gender with the time to achieve an FEO2 of 90%. If there was evidence against normality for either of the variables, Spearman correlation analysis was applied to assess the relationship. Analysis of variance (ANOVA) was used to compare the continuous variables (time to achieve an FEO2 of 90%) among the three groups, and when significant differences were determined, a Newman-Keuls multiple-comparison test was used to determine intergroup differences. Continuous data against normally distributed were analyzed by Kruskal-Wallis test, and when a significant difference was found, a Mann-Whitney U test was applied for post hoc comparisons between the inter-groups. Data are presented as mean ± SE. P values < 0.05 were considered statistically significant.
Results
A total of 77 patients were enrolled in the study. With the exception of mean BMI values, the resultant three subgroups were similar with respect to demographic characteristics, including baseline SpO2 (%), FEO2 (%) values and ETCO2. (Table 1) There is higher respiratory rate in the obese subpopulation compared to the normal or overweight subpopulation.
Table 1: The demographic and experimental data in the normal (BMI 19 - 24.9 kg/m2), overweight (BMI 25 - 29.9 kg/m2), and obese (BMI > 30 kg/m2) groups.
| Normal | Overweight | Obese | |
|---|---|---|---|
| Numbers(F/M) | 25(16/9) | 26(16/10) | 26(19/7) |
| BMI (kg/m2) | 22 ± 2 | 27 ± 1* | 39 ± 6* |
| Age (yr) | 42 ± 11 | 45 ± 10 | 41 ± 7 |
| SpO2 < 95% during tracheal process (n) | 0 | 1 | 3 |
| Mask fit | |||
| Good | 21 | 22 | 23 |
| Fair | 4 | 4 | 2 |
| Poor | 0 | 0 | 1 |
| Values | |||
| FEO2 (%) baseline | 65 ± 18 | 59 ± 14 | 60 ± 10 (p 0.5) |
| FEO2 (%) at 3 minutes | 85 ± 5 | 82 ± 8 | 85 ± 4 (p 0.6) |
| Time to reach FEO2 90% (sec) | 152 ± 57 | 136 ± 62 | 136 ± 70 |
| Patients never reached FEO2 90% (n) | 3 | 1 | 3 |
| SpO2 (%) | 99 ± 1 | 99 ± 2 | 99 ± 2 |
| ETCO2 (torr) baseline | 33 ± 5 | 32 ± 4 | 31 ± 5 |
| ETCO2 (torr) at 3 minutes | 30 ± 2 | 31 ± 1 | 32 ± 2 (p 0.24) |
| RR (bpm) | 16 ± 3 | 16 ± 2 | 18 ± 1* |
| HR (bpm) | 79 ± 14 | 82 ± 8 | 79 ± 14 |
| SBP (mmHg) | 124 ± 17 | 129 ± 16 | 132 ± 12 |
| DBP (mmHg) | 70 ± 12 | 77 ± 12 | 73 ± 9 |
| Pre-induction SpO2 (%) | 100 ± 0 | 100 ± 0 | 98.8 ± 0.6 |
| Post-intubation SpO2 (%) | 99.8 ± 0.6 | 99.5 ± 1.9 | 99.7 ± 0.5 |
| Apnea time (sec) | 125 ± 70 | 129 ± 48 | 128 ± 73 |
A total of 7 patients (3 in the normal, 1 in the overweight and 3 in the obese group) failed to achieve an FEO2 of 90% after 5 min of preoxygenation. (Table 1 & 2) The average FEO2 value after 5 min of preoxygenation was 0.84 ± 0.05 (0.75 - 0.89) in these 7 patients. However, this subset of 7 patients did not require a longer period of time to secure their airway with a tracheal tube 111 ± 46 sec vs.130 ± 63 of the remaining 70 patients (p = 0.45). Four patients who failed to achieve an FEO2 of 0.90 also experienced a decrease in SpO2 < 95% after tracheal intubation (3 in the obese group and 1 in the overweight group). No patients experienced a decrease in SpO2 < 90% during apnea period. The BMI of the 7 patients who failed to achieve an FEO2 of 90% within 5 min during tracheal intubation was 40 ± 9 kg/m2.
Table 2: Frequencies and percentages of the numbers that reach FEO2 of 90% and those that fail to reach FEO2 of 90% for each group during a 5 min preoxygenation period.
| One-minute | ||||
|---|---|---|---|---|
| Groups | Total | FEO2 of 90% succeeded | FEO2 of 90% failed | Percent of FEO2 of 90% failed |
| Normal | 25 | 1 | 24 | 96.00 |
| Overweight | 26 | 0 | 26 | 100.00 |
| Obese | 26 | 3 | 23 | 88.46 |
| Two-minute | ||||
| Normal | 25 | 4 | 21 | 84.00 |
| Overweight | 26 | 12 | 14 | 53.85 |
| Obese | 26 | 11 | 15 | 57.69 |
| Three-minute | ||||
| Normal | 25 | 16 | 9 | 36.00 |
| Overweight | 26 | 20 | 6 | 23.08 |
| Obese | 26 | 17 | 9 | 34.62 |
| Four-minute | ||||
| Normal | 25 | 20 | 5 | 20.00 |
| Overweight | 26 | 23 | 3 | 11.54 |
| Obese | 26 | 20 | 6 | 23.08 |
| Five-minute | ||||
| Normal | 25 | 22 | 3 | 12.00 |
| Overweight | 26 | 25 | 1 | 3.85 |
| Obese | 26 | 23 | 3 | 11.54 |
Excluding these 7 patients, the time needed to achieve an FEO2 of 90% did not differ among the three subgroups. (Figure 1) The times to achieve an FEO2 of 90% were 152 ± 57, 136 ± 62 and 136 ± 70 sec in the normal weight, overweight and obese subgroups, respectively. However, there was no statistically- significant difference among the three groups. After 3 min of preoxygenation, there were higher percentage of overweight patients that had reached an FEO2 of 90% than in the normal or obese subgroups. (Table 3) After 4.4 min (260 seconds) of preoxygenation, 90% of all patients had achieved an FEO2 greater than 90%. (Figure 1 and 2) Similarly, the duration of apnea and post-intubation SpO2 did not differ between the three subgroups. (Table 1) Male patients required longer time to achieve an FEO2 of 90% compared to female patients in the overweight subgroup [p < 0.05]. The mean SBP values during induction were higher in female patients while mean DBP values during induction were higher in male patients. (Table 3)

Figure 1: The average FEO2 values by time points for three groups: normal weight, overweight and obese. There was no significant difference at each time point.
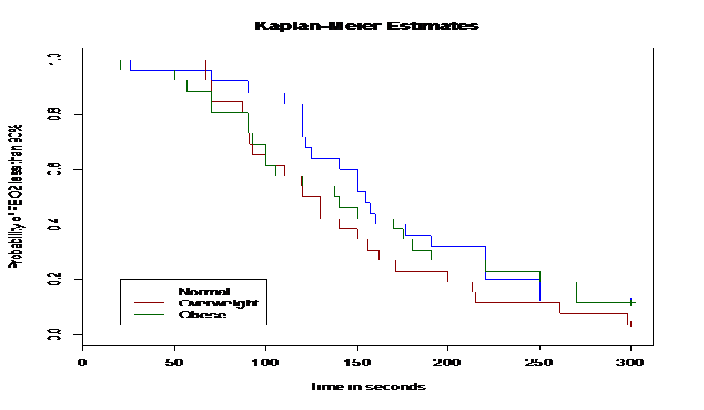
Figure 2: The Kaplan-Meier curve for the estimated probabilities of FEO2 less than 90% for three groups: normal weight, overweight and obese. There was no significant difference at each time point.
Table 3: The demographic and experimental data in the normal (BMI 19-24.9), overweight (25-29.9), and obese (> 30) subgroups. A subset analysis was performed for male (M) vs. female (F) patients.
| Normal (n = 25) | Overweight (n = 26) | Obese (n = 26) | ||||
|---|---|---|---|---|---|---|
| Gender | F (16) | M (9) | F (16) | M (10) | F (19) | M (7) |
| BMI (kg/m²) | 21 ± 1.8 | 23 ± 1.4* | 27 ± 1.5 | 27 ± 1.1 | 40 ± 5 | 37 ± 7 |
| 0.04 | 0.55 | 0.16 | ||||
| Age (yr) | 43 ± 8 | 40 ± 15 | 43 ± 10 | 46 ± 9.5 | 41 ± 8 | 41 ± 5 |
| p | 0.55 | 0.44 | 0.83 | |||
| SpO2 < 95% during tracheal process (n) | 0 | 0 | 1 | 0 | 1 | 2 |
| Mask fit | ||||||
| Good | 15 | 6 | 15 | 7 | 18 | 5 |
| Fair | 1 | 3 | 1 | 3 | 1 | 1 |
| Poor | 0 | 0 | 0 | 0 | 0 | 1 |
| FEO2 (%) baseline | 68 ± 22 | 61 ± 9 | 59 ± 16 | 60 ± 9 | 59 ± 11 | 63 ± 4 |
| 0.5 | 0.8 | 0.4 | ||||
| FEO2 (%) at 3 minutes | 83 ± 4 | 90 ± 1 | 87 ± 1 | 80 ± 8 | 84 ± 4 | 85 ± 4 |
| 0.1 | 0.3 | 0.9 | ||||
| Time to reach FEO2 90% (sec) | 171 ± 54 | 125 ± 52 | 110 ± 39 | 183 ± 69* | 125 ± 67 | 174 ± 78 |
| 0.06 | 0.003 | 0.2 | ||||
| Patients never reached FEO2 90% (n) | 3 | 0 | 0 | 1 | 1 | 2 |
| SpO2 (%) | 98.6 ± 1.6 | 98.6 ± 1.3 | 98.6 ± 1.9 | 99.6 ± 0.9 | 98.5 ± 1.7 | 98.6 ± 1.6 |
| 0.9 | 0.2 | 0.9 | ||||
| Pre-induction SpO2 (%) | 100 ± 0 | 100 ± 0 | 100 ± 0 | 100 ± 0 | 99.9 ± 0.2 | 99.9 ± 0.2 |
| - | - | 0.06 | ||||
| Post-intubation SpO2 (%) | 99.7 ± 0.6 | 99.8 ± 0.3 | 99.3 ± 2.2 | 99.7 ± 0.6 | 99.7 ± 0.4 | 99.5 ± 0.5 |
| 0.6 | 0.6 | 0.4 | ||||
| ETCO2 (torr) baseline | 34 ± 5 | 32 ± 6 | 33 ± 5 | 32 ± 1 | 31 ± 5 | 29 ± 1 |
| 0.42 | 0.6 | 0.6 | ||||
| ETCO2 (torr) at 3 minutes | 29 ± 2 | 31 ± 2 | 31 ± 1 | 30 ± 1 | 32 ± 3 | 30 ± 2 |
| 0.5 | 0.7 | 0.3 | ||||
| RR (bpm) | 17 ± 3 | 16 ± 3 | 16 ± 2 | 16 ± 2 | 18 ± 2 | 17 ± 1 |
| 0.3 | 0.9 | 0.3 | ||||
| HR (bpm) | 77 ± 15 | 82 ± 11 | 81 ± 8 | 83 ± 9 | 80 ± 5 | 77 ± 9 |
| 0.4 | 0.5 | 0.7 | ||||
| SBP (mmHg) | 115 ± 11* | 114 ± 14 | 127 ± 19 | 131 ± 12 | 132 ± 12 | 133 ± 10 |
| 0.000 | 0.6 | 0.7 | ||||
| DBP (mmHg) | 65 ± 9 | 80 ± 11* | 78 ± 14 | 76 ± 10 | 72 ± 9 | 78 ± 6 |
| 0.002 | 0.7 | 0.2 | ||||
| Apnea time (sec) | 104 ± 51 | 150 ± 76 | 131 ± 53 | 148 ± 65 | 116 ± 65 | 153 ± 59 |
| 0.08 | 0.5 | 0.2 | ||||
Discussion
Although some experts have reported that obese patients are not at risk for difficult intubation[16]. This patient population present other challenges with respect to airway management, including difficulty with mask ventilation, more frequent oxygen desaturation, increased oxygen consumption, and increased sensitivity to the respiratory depressant effects of anesthetic and analgesic drugs[17]. Preoxygenation prior to tracheal intubation is intended to increase oxygen reserves and delay the onset of hypoxemia during the apneic period prior to tracheal intubation. Adequate preoxygenation depends on several factors such as fresh gas flow, time of preoxygenation, type of ventilation, and patient characteristics[18,19]. Failure to breathe a high inspired O2, insufficient time of preoxygenation, and the presence of leak under the mask can result in sub maximal alveolar oxygenation[19-21].
In this study, 92% of both normal and healthy obese patients and 88% of obese patients were able to achieve an FEO2 of 90% within a 5 min preoxygenation period when using a tight fitting face mask delivering 100% oxygen at 10 L/min. These data suggests that breathing 100% O2 for 5 min (or less) through a tight-fitting face mask provides adequate arterial oxygenation for rapid sequence induction of anesthesia and tracheal intubation in obese and over-weight patients. Therefore, these data failed to demonstrate the significant difference in time required to achieve an FEO2 > 90% in normal: normal weight, overweight and obese groups. The obese subpopulation did not require more time for adequate preoxygenation (FEO2 of 90% or more).
An earlier study found preoxygenation time is crucial to reach the desired FEO2 level, which is important for maximal alveolar preoxygenation[22]. The traditional period recommended for preoxygenation is 3 - 5 min[23]. There is a low risk of desaturation after standard 3-minute preoxygenation in patients without pulmonary pathology and adequate hemoglobin[23]. Hamilton and Eastwood demonstrated that 95% completion de nitrogenation occurs within 2-3 minutes of tidal breathing of 100%[13]. Interestingly, after 3 min of preoxygenation, only 69% of their patients had achieved an FEO2 > 90% in our study. At 4.4 min, 90% of patients achieved an FEO2 greater than 90%. It is evident from the current investigation that maximal alveolar preoxygenation cannot be reliably achieved with tidal volume breathing with a 3 min preoxygenation interval irrespective of the patient’s BMI.
It has been reported that FEO2 rises faster in obese patients due to a decrease in FRC[24]. Jense et al[24] demonstrated that the time to reach maximum FEO2 was less with increasing body weight, with mean time intervals of 3.9, 3.7, and 2.9 min in lean, healthy obese and morbidly obese patients, respectively. In this study, the time to achieve an FEO2 of 90% was shorter in obese group compared to the normal group (136 ± 70 vs. 152 ± 57 sec); however, this difference was not statistically-significant. The safety margin for maintaining the SpO2 > 90% following apnea is diminished by the reduced FRC[25]. However, there is no evidence to support the notion that a more prolonged preoxygenation period can more reliably achieved adequate alveolar preoxygenation in obese patients.
Previous studies have demonstrated that morbidly obese patients are significantly more likely to de saturate (SpO2 < 90%) during periods of apnea at induction of anesthesia despite achieving an FEO2 of 90% during preoxygenation[26]. The thorax is compressed by the weight of surrounding tissues, and abdominal content pushes the diaphragm upward in the supine position, which result in the reduction of FRC in morbidly obese patients by two-third compared to non-obese patients[27]. A decrease in FRC reduced the duration of apnea in obese patients[25]. Furthermore, increased metabolic activity of this excess fat increases the rate of oxygen consumption[28]. A higher respiratory rate was found due to increased metabolic activity in the obese subpopulation. Due to the combination of a smaller lung capacity[29,30] and a higher metabolic rate[31], obese patients experience more rapid oxygen desaturation than patients of normal body weight. Of the 7 patients who were not able to achieve a FEO2 of 90% in this study, four patients who were either overweight or obese also experienced a decrease in SpO2 < 95% after tracheal intubation. Jense et al[24] found apneic intervals without desaturation of 6.1 min in lean patients (mean BMI = 22 kg/m2), 4.1 min in moderately obese patients (mean BMI =32 kg/m2), and 2.7 min in morbidly obese subjects (mean BMI = 43 kg/m2).
One of the major limitations of this study was the failure to evaluate the relationship between the preoxygenation in the normal weight, overweight and obese patients and the duration before subsequent arterial hemoglobin desaturation during apnea. However, previous investigations have demonstrated that FEO2 < 90% during the routine induction of general anesthesia is associated with a short time interval prior to oxygen desaturation[25]. In the present study, additional possible predictive factors, such as history of difficult tracheal intubation, were also excluded. Other potential limitations of our study design included the inability to detect minor leaks, failure of patients to comply with the breathing instructions, and the inability to continuously monitor arterial oxygen content.
In conclusion, obese patients can achieve an FEO2 of 90% with normal spontaneous ventilation during a 5 min preoxygenation period by administering 100% oxygen at 10 L/min in the head up position. However, morbidly obese patients were more likely to experience a fall in their SpO2 to < 95% during apnea time despite achieving an FEO2 of 90% during preoxygenation.
Disclosures: This study was unfunded. IRB Study # Pro00011544 Approval date: 11/19/2008
References
- 1. De Jong, A., Futier, E., Millot, A., et al. How to preoxygenate in operative room: Healthy subjects and situations ‘‘at risk’’. (2014) Ann Fr Anesth Reanim 33(7-8): 457-461.
- 2. Tanoubi, I., Drolet, P., Donati, F. Optimizing preoxygenation in adults. (2009) Can J Anaesth 56(6): 449-466.
- 3. Gebremedhn, E.G., Mesele, D., Aemero, D., et al. The incidence of oxygen desaturation during rapid sequence induction and intubation. (2014) World J Emerg Med 5(4): 279-285.
- 4. McGowan, P., Skinner, A. Preoxygenation-The importance of a good face mask seal. (1995) Brit J Anaesth 75(6): 777-778.
- 5. Davis, D.P., Lemieux, J., Serra, J., et al. Preoxygenation Reduces Desaturation Events and Improves Intubation Success. (2015) Air Med J 34(2): 82-85.
- 6. Farmery, A.D., Roe, P.G. A model to describe the rate of oxyhaemoglobin desaturation during apnea. (1996) Br J Anesth 76(2): 284-291.
- 7. Benumof, J.L. Obesity, sleep apnea, the airway and anesthesia. (2004) Curr Opin Anaesthesiol 17(1): 21-30.
- 8. Murphy, C., Wong, D.T. Airway management and oxygenation in obese patients. (2013) Can J Anesth 60(9): 929-945.
- 9. Gautam, P., Gaul, T.K., Luthra, N. Prediction of difficult mask ventilation. (2005) European Journal of Anesthesiology 22(8): 638-640.
- 10. Benumof, J.L. Preoxygenation: best method for both efficacy and efficiency. (1999) Anesthesiology 91(3): 603-605.
- 11. Goldberg, M.E., Norris, M.C., Larijani, G.E., et al. Preoxygenation in the morbidly obese: a comparison of two techniques. (1989) Anesth Analg 68(4): 520-522.
- 12. Hirsch, J., Führer, I., Kuhly, P., et al. Preoxygenation: a comparison of three different breathing systems. (2001) Brit J Anaesth 87(6): 928-931.
- 13. Hamilton, W.K., Eastwood, D.W. A study of denitrogenation with some inhalation anesthetic systems. (1955) Anesthesiology 16(6): 861-867.
- 14. Berry, C.B., Myles, P.S. Preoxygenation in healthy volunteers: a graph of oxygen ‘washin’ using end-tidal oxygraphy. (1994) Br J Anaesth 72(1): 116-118
- 15. Schutz, S.L. Oxygen Saturation Monitoring by Pulse Oximetry. (2001) Procedure Manual for Critical Care. 4th Ed 77-82.
- 16. Brodsky, J.B., Lemmens, H.J.M., Brock-Utne, J.G., et al. Morbid Obesity and Tracheal Intubation. (2002) Anesth Analg 94(3): 732-736.
- 17. Aceto, P., Perilli, V., Modesti, C., et al. Airway management in obese patients. (2013) Surg Obes Relat Dis 9(5): 809-815.
- 18. Baraka, A.S., Taha, S.K., Aouad, M.T., et al. Preoxygenation: comparison of maximal breathing and tidal volume breathing techniques. (1999) Anesthesiology 91(3): 612-616.
- 19. Altermatt, F.R., Muñoz, H.R., Delfino, A.E., et al. Pre-oxygenation in the obese patient: effects of position on tolerance to apnoea. (2005) Br J Anaesth 95(5): 706-709.
- 20. Gander, S., Frascarolo, P., Suter, M., et al. Positive end-expiratory pressure during induction of general anesthesia increases duration of nonhypoxic apnea in morbidly obese patients. (2005) Anesth Analg 100(2): 580-584.
- 21. Bell, M.D. Routine pre-oxygenation: a new ‘minimum standard’ of care?. (2004) Anaesthesia. 59(10): 943-945.
- 22. Nimmagadda, U., Salem, M.R., Joseph, N.J., et al. Efficacy of preoxygenation with tidal volume breathing. Comparison of breathing systems. (2000) Anesthesiology 93(3): 693-698.
- 23. Ramkumar, V., Umesh, G., Philip, F.A. Preoxygenation with 20º head-up tilt provides longer duration of non-hypoxic apnea than conventional preoxygenation in non-obese healthy adults. (2011) J Anesth 25(2): 189-194.
- 24. Jense, H.G., Dubin, S.A., Silverstein, P.I., et al. Effect of obesity on safe duration of apnea in anesthetized humans. (1991) Anesth Analg 72(1): 89-93.
- 25. Edmark, L., Kostova-Aherdan, K., Enlund, M., et al. Optimal oxygen concentration during induction of general anaesthesia. (2003) Anesthesiology 98(1): 28-33.
- 26. Jung, B., Azuelos, I., Chanques, G., et al. How to improve preoxygenation before intubation in patients at risk? (2012) Trends in Anaesthesia and Critical Care 2(1): 20-24.
- 27. Jones, R.L., Nzekwu, M.M. The effects of body mass index on lung volumes. (2006) Chest 130(3): 827-833.
- 28. Dority, J., Hassan, Z.U., Chau, D. Anesthetic implications of obesity in the surgical patient. (2011) Clin Colon Rectal Surg 24(4): 222-228.
- 29. Bone, H.G., Freyhoff, J., Utech, M. The Obese Patient in the Intensive Care Unit– What is Different? (2014) Anasthesiol Intensivmed Notfallmed Schmerzther 49(5): 288-296.
- 30. Melo, L.C., Silva, M.A., Calles, A.C. Obesity and Lung Function: a Systematic Review. (2014) Einstein 12(1): 120-125.
- 31. Bhatia, P.K., Bhandari, S.C., Tulsiani, K.L., et al. End-tidal oxygraphy and safe duration of apnoea in young adults and elderly patients. (1977) Anesthesia 52(2): 175-178.


