
Effects of nano-silica on cement-fly ash modified crushed rocks base materials
Alireza Rezagholilou1*, Hamid Nikraz1 and Philip Paige Green2
Affiliation
- 1Dept. of Civil Engineering, Curtin University, P.O. Box U1987, Perth, WA 6102, Australia.
- 2Dept. of Civil Engineering, Tshwane University of Technology, Private Bag X680, Pretoria 0001, South Africa.
Corresponding Author
Alireza Rezagholilou, Dept of Civil Engineering, Curtin University., P.O. Box U1987, Perth, WA 6102, Australia; E-mail: rezagholilou@postgrad.curtin.edu.au
Citation
Rezagholilou. A ., et al. Effects of nano-silica on cement-fly ash modified crushed rock base materials.(2015) J Nanotech Mater Sci 2(1): 6-11.
Copy rights
© 2015 Rezagholilou. A. This is an Open access article distributed under the terms of Creative Commons Attribution 4.0 International License.
Keywords
Crushed Rock Base; CRB material; Spectroscopy
Abstract
Cement modification of Crushed Rock Base (CRB) material is required to improve some characteristics such as water susceptibility or stiffness. This kind of soil stabilisation can be more effective if other pozzolanic products can also contribute to the mixture to achieve the desired aims. In this research, both of fly ash and nano-silica material was added to a CRB material to investigate the variation of design parameters and internal microstructures. Fly ash particles are often coarser than nano-silica particles, thus the presence of these produces provide a broad range of particle size distributions of pozzolanic material in cement modified CRB material. The benefit of this idea is generation of less porous material with high strength which is favorable.
Thus, different trial batches of this material were subjected to resilient modulus (Mr) and Unconfined Compressive Strength (UCS) to study the changes in design parameters. Furthermore, different techniques of scanning electron microscopy (SEM) imaging methods were utilized to investigate the micro structural changes of hydration products.
Introduction
Soils are generally modified in terms of their plasticity index, water susceptibility and stiffness characteristics by the application of lime or cement. In Australia, this purpose is usually achieved by mixing 2% cement with crushed rock base (CRB) material in pavements (Jameson & Shackleton, 2009). A lower amount of cement content can also be used upon structural considerations.
For instance, in Western Australia, the 7-days strength of this material should be less than 1.0 MPa (Main Roads of Western Australia (MRWA), 2012a) which often leads to cement content in the range of 0.5% to 1.0%.
Thus to adhere to the earlier requirement of 2% binder, a compound binder including 0.9% cement and 1.1% fly ash (by dry weight of CRB material) was considered in this investigation. This binder composition was also examined and optimised further by adding 0.3%, 0.6% and 0.9% nano-silica (by dry weight of cement), respectively.
This examination started with laboratory tests such as UCS (according to AS 1141.51—1996) and MR (according to AASHTO T307-99 (2005)). Then, SEM images were taken with the methods of Secondary Electron (SE) and Back Scattered Electrons (BSE) and Energy Dispersive X-Ray Spectroscopy (EDS) mapping. These methods revealed better understandings of the microstructural changes in the mixtures and seems to be better than indirect methods by porosimetry measurements such as the mercury intrusion method which measure pores size distribution in the mixture (Diamond & Kjellsen, 2006). The reason is partly due to isolated pores that are difficult to trace by common measurement techniques, such as mercury, nitrogen or water intrusion porosimetry methods. These methods are usually applied to indicate the pore size distribution and surface area of paste samples.
Properties of material
Cement
The cement used was typical General Purpose (GP) cement supplied in West Australia. Its chemical properties are given in Table 1. Typical results comply with standard limits. Moreover, the sizes of cement particle were varying from 2μm to 100μm.
Table 1: Chemical properties of GP cement (Cockburn Cement, 2007)
| Parameter | Units | Minimum | Typical | Maximum | AS 3972 limit | Test Method |
|---|---|---|---|---|---|---|
| CaO | % | 63.1 | 63.7 | 64.4 | - | AS 2350.2 |
| SiO2 | % | 20.0 | 20.4 | 20.8 | - | AS 2350.2 |
| Al2O3 | % | 5.1 | 5.4 | 5.8 | - | AS 2350.2 |
| Fe2O3 | % | 2.6 | 2.8 | 3.0 | - | AS 2350.2 |
| MgO | % | 1.1 | 1.3 | 1.5 | - | AS 2350.2 |
| SO3 | % | 2.3 | 2.7 | 3.0 | < 3.5 | AS 2350.2 |
| Na2O equivalent | % | 0.4 | 0.5 | 0.6 | - | AS 2350.2 |
| Chloride | % | 0.00 | 0.01 | 0.04 | < 0.10 | AS 2350.2 |
| Loss on ignition | % | 1.5 | 2.2 | 2.7 | - | AS 2350.2 |
Fly ash
Fly ash was sourced from the Collie power station, located in the South of Perth in WA. It was a fine cream/gray powder with low lime content. According to Table 2, it has a re-active amorphous content (SiO2) of 51.8% by mass and secondary phases of alumina (Al2O3), hematite (Fe2O3), etc. Since the calcium oxide content is less than 20%, this fly ash does not have self-cementing capability and requires an activator like cement or lime.
Table 2: Chemical properties of fly ash
| Parameter | Content (%) |
|---|---|
| Si02 | 51.8 |
| Al203 | 26.4 |
| Fe203 | 13.2 |
| CaO | 1.61 |
| Ti02 | 1.4 |
| P205 | 1.39 |
| MgO | 1.17 |
| K20 | 0.68 |
| Na20 | 0.31 |
| MnO | 0.1 |
About 80% of the fly ash particles were finer than 45 μm as required by ASTM C 618 and about 50% of the particles are less than 11μm in diameter. The coarse sizes of the cement or fly ash particles suggest the idea of nano-silica effectiveness in the filling of the binder paste pores up to nano scales.
Nano-Silica
The applied nano-silica was Aerosil 200 that meets the ASTM E2456-06 definition for nano-particles. Its particle size varies from 1 to 100ηm. It consists of spherical particles with an average primary particle size of 12ηm and the specific surface area of about 200m²/g.
CRB Material
Crushed rock base (CRB) material was sourced from Gosnell's quarry in Perth. It is mainly granite and dolerite particles, which are mechanically crushed and processed. This complies with the requirements of material specification Main Roads of Western Australia (MRWA) (2012b), in terms of particle size distribution and soil plasticity limits.
Mixing Details and Sample Preparation
Three batches of B2, B3 and B4 were considered as shown in Table 3. Batch B1 included no nano- silica as a control batch with only 0.9% cement and 1.1% fly ash (by dry mass of CRB material) for comparison of test results.
Table 3: Chemical properties of fly ash
| Batch | B1 | B2 | B3 | B4 |
|---|---|---|---|---|
| Nano Content | 0.0% | 0.3% | 0.6% | 0.9% |
Note: Nano content is the percentage of nano-silica by dry weight of cement.
Before preparation of test samples, it was required to have the Optimum Moisture Content (OMC) and maximum dry unit weight (γdmax) of each batch according to AS 1289.5.1.1 standard test method. Results of various compaction tests showed that the OMC of batches has little variations around 6% with γdmax about 23.2 KN/m³.
During preparation of each mixture for compaction test, nano-silica was added to water separately and extremely mixed with water in a shaker. This solution was then added to dry mix of cement, fly ash and aggregates. Blending of each batch continued in a 60 L mixer for five minutes.
This method of blending of mixtures was kept for UCS and MR tests, as well. The samples for UCS tests were cylindrical, with a diameter of 105 mm and a height of 115.5 mm. These samples were compacted according to standard proctor energy level in three layers with same thickness. But the samples of MR tests had a diameter of 100 mm and a height of 200 mm, compacted in five layers.
After compaction, samples were cured in moulds for one day and then wrapping in a plastic sheet for longer times with a temperature of between 21°C and 24°C. Just before the test, samples were kept soaked in water for about 5 hours before loading and breaking at any required ages. For UCS, the rate of loading was 1 mm/ min.
For SEM imaging process, samples were prepared in the same manner. The differences were in max size of aggregates which was limited to 1.18 mm and casting in 50 cubes due to the size limitation of final specimens as below. However, the samples cured for less than 28 days had not enough strength for handling during preparation stage of SEM specimens.
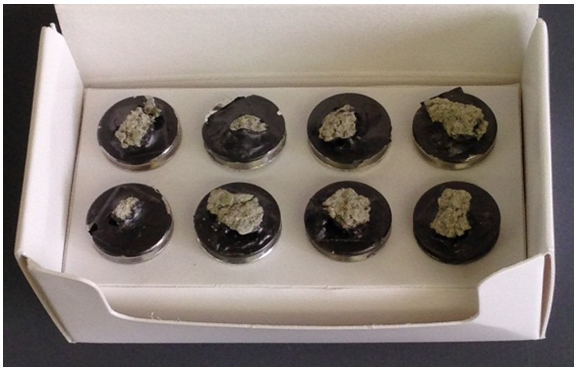
Fractured specimens for SE images
These specimens were taken from fractured pieces of cubes. Due to the low strength of material, it was carried out picking by hand cutters to take small pieces as shown in Figure 1. All of the fractured specimens were mounted on the aluminium stubs with carbon conductive tape on the bottom and sides of each crushed piece. After that, carbon coating was applied to ensure full conduction of electrons over the samples. The stubs' box was kept in high vacuum desiccators for some days to ensure a dry condition.
Polished specimens for BSE images
The same procedure was tried for fractured pieces of about 10 mm size for SE analysis. They were cast in 27 mm diameter polypropylene tubes with epoxy impregnation. The tubes were cured for 8-12 hours to remove entrapped air while resin the penetrated into the voids of specimens.
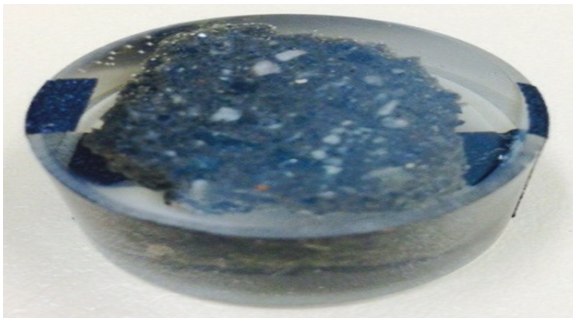
The surface of the solid specimens was then ground mechanically in seven steps, each for no longer than five minutes. The coarseness of the diamond carbide grinding papers was reduced stepwise from 240, 320, 400, 600, 800, and 1000 to 1200 (standard ANSI grits). During grinding, water was used as a coolant with limited rotation (about 200 rpm) to minimize heating of the sample faces. Polishing was then carried out using a polycrystalline diamond suspension to provide different coarseness such as 9 μm, 6 μm, 3 μm and 1 μm, respectively. All samples were polished with an applied force of 20N for 2–4 minutes. After polishing, the specimens were platinum-coated for conduction purpose as shown in Figure 2.
UCS test results
For each test two samples broken and average of results are depicted as Figure 3.
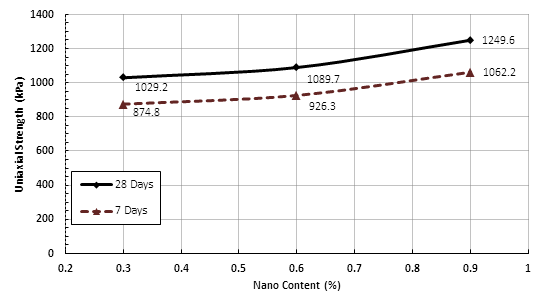
The UCS of batch B1 was 711 kPa at 7-days and 1009 kPa at 28-days. This figure demonstrates the increasing trend of strength versus nano-silica content of batches. In addition, the 7-days and 28-days strengths have increased for about 23% and 2% at lowest nano content in comparison with control batch B1, respectively. All of results are satisfying the design requirement of note No.9 by Main Roads of Western Australia (MRWA) (2012a).
Mr Results
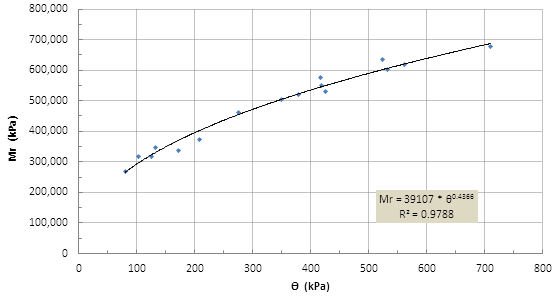
In this test, specimens are subjected to cyclic loads in 16 stages in triaxial condition, according to test protocol T307- 99 (AASHTO, 2003). Typically, its detailed results for batch B2 are represented in Figure 4 to Figure 6. As it can be seen in this figure, MR is function of bulk stress θ as described by Hicks and Monismith (1971).
Other results of axial permanent strains are also recorded as figure 5 during the progress of the test. These deformations are plastic deformations that can be indicative of surface rutting in pavements.
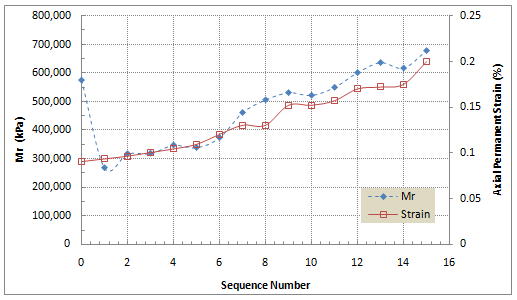
Comparison of different batches requires considering the same condition of bulk stress that is a function of the configuration of pavement layers such. In other word, the stress in base course layer depends on the asphalt thickness and subgrade resilient modulus. As such some references such as National Cooperative Highway Research Program (NCHRP) suggests considering bulk stress θ of 205 (kPa) for comparison purpose (Witczak, 2004). Based on this consideration the variation MR of different batches with nano content can be illustrated as Figure 6.
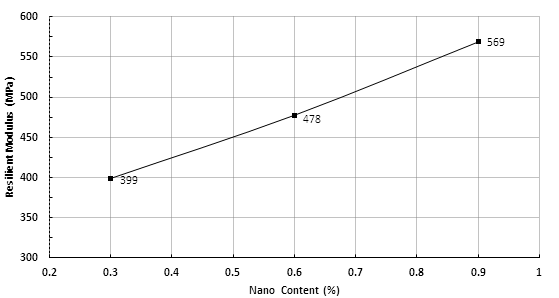
The MR of batch B1 in bulk stress of 205 kPa, was about 267 MPa at 28-days specimens. Thus the increasing trend of MR versus nano-silica content of batches is at least 50% in the case of batch B2. Figure 6 and Figure 3 commonly point out the advantages of nano-silica in increasing design parameter of pavements.
Evaluation of SEM Images
In this research, a Zeiss Neon EsB focussed ion beam scanning electron microscope (FIBSEM) was used. This microscope has a field emission electron gun providing high brightness and high resolution (0.8 ηm achieved). It has the usual array of SE and BSE detectors as an integrated EDS/EBSD facility.
Secondary Electron (SE) Analyses
SE images were taken on fractured or unpolished samples to investigate surficial features such as texture and crystal morphology. Magnification of SE images was about 1.5 kX originally. However, scale bars are also utilised to rectify likely resizing changes during reproduction. Figures 7 to 10 show the changes and variations in the microstructure of batches as the nano-silica content increases.
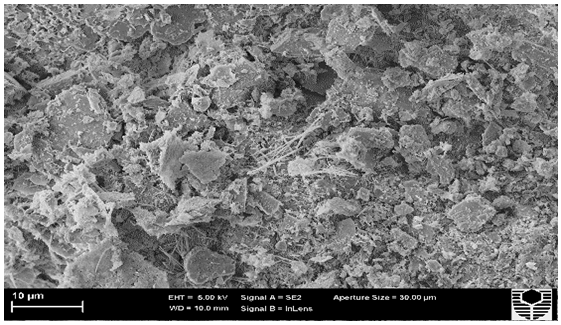
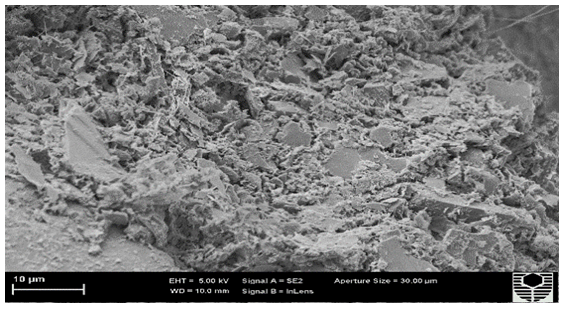

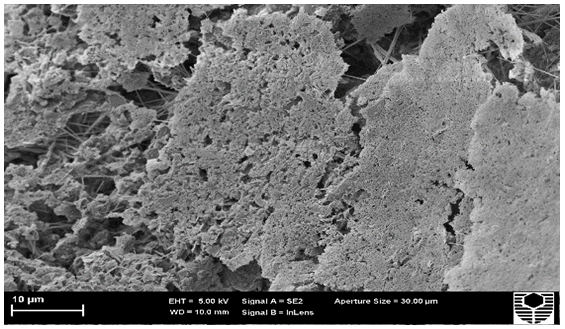
Through Figure 7 to Figure 10, euhedral crystal formation starts being disrupted by adding and increasing nano silica. There are some obvious and well-developed crystals in Figure 7, which shrink and gradually become surrounded with more silica gel as the nano silica content increases. It seems that nano silica causes a massive and dense structure for CSH as shown in Figure 14 compared with the sparse structures before. The majority of CSH is type II with an increasing trend towards a more massive structure. The lack of CSH type I material is easily recognised and is considered to be the result of the ages of the specimens (28 days) which are probably well-outside the initial hydration stages.
The other feature of these figures is the presence of rod like crystals of Ettringite with no obvious change in terms of their size or quantity. It should be borne in mind that the ettringite is the product of the reaction of the gypsum in the cement with the hydrated alumino silicates. Gypsum is used to retard these reactions and as such should not be affected by the other reactions being studied. Pore sizes seem to have a steadily reducing trend, as a result of the distribution of the finer pores within paste. In Figure 7, sufficient pore space is available to allow the development of euhedral crystals. However, as the nano content increases, the reduction in available pore space results in deformation of and restriction of crystal growth and the resulting subhedral and anhedral shapes increasing the nano content, larger pores are steadily replaced by smaller ones, which provide a denser structure for more massive CSH
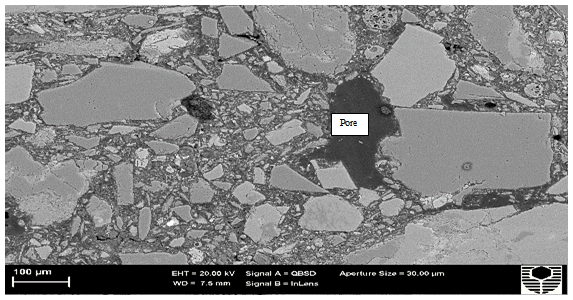
Backscattered electron analyses (BSE)
In this method, high voltage and powerful electrons penetrate more deeply into the specimens and to show surficial composition of the specimen or internal architecture of hydrated cement systems (Diamond, 2004).
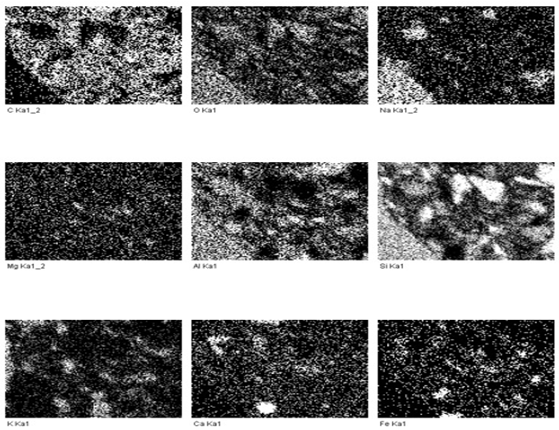
In images by this method, anhydrous cement grains appear as the brightest particles (white) which are followed by other constituents like calcium hydroxide (CH) and calcium-silicate-hydrate (CSH) which appear as different shades of grey colour levels (Stutzman, 1994). In this condition, the darkest colours relate to voids or epoxy-filled pores and chemical composition microanalyses can be done by using the Energy Dispersive X-Ray Spectroscopy (EDS) facility. This is to obtain the phase type and distribution. The limitation of EDS is effectively detected radius of examination, which is about 1–2μm. This radius sometimes is larger than the size of many of the hydrate phases, and thus microanalyses will typically describe a mixture of phases in the area analysed.
Figures 11 to 20 show the changes and variations in mix microstructure affected by increasing the nano-silica content.
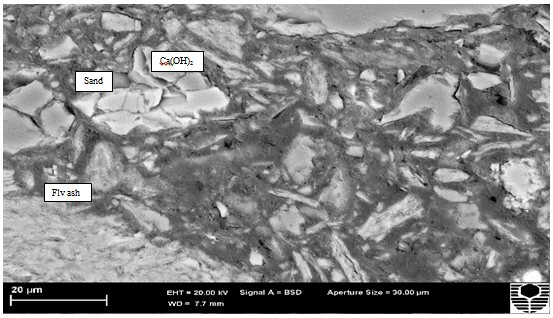
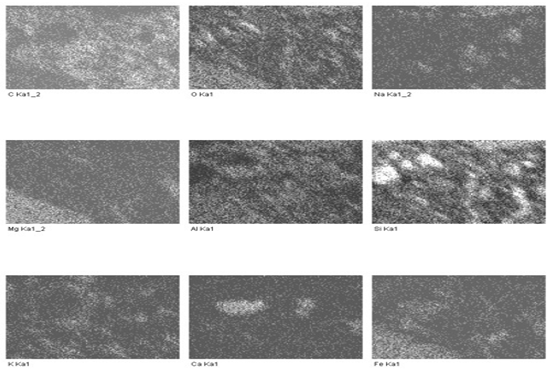
On EDS maps, finding of some compositions such as CSH depend to presence of Si, Ca, O elements in interested spots. Similarly, significant presence of Ca and O elements may highlight calcium hydroxide or CH crystals and presence of Fe, Mg or Al can be signs of fly ash particles as shown in Figure 12.
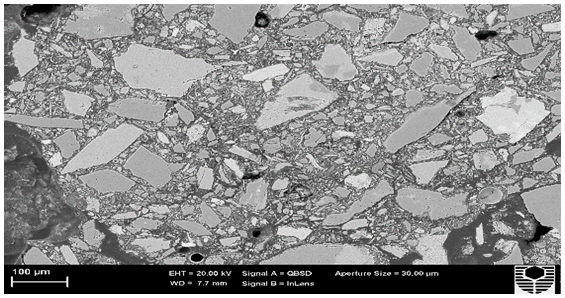
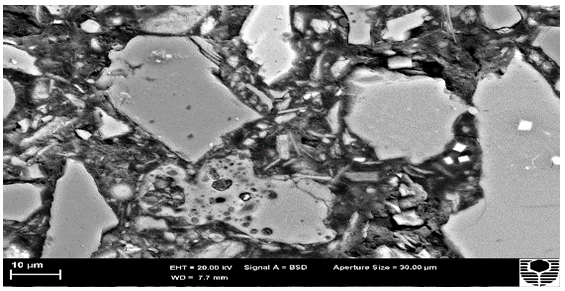
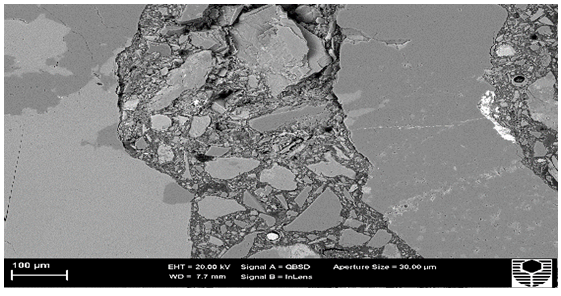
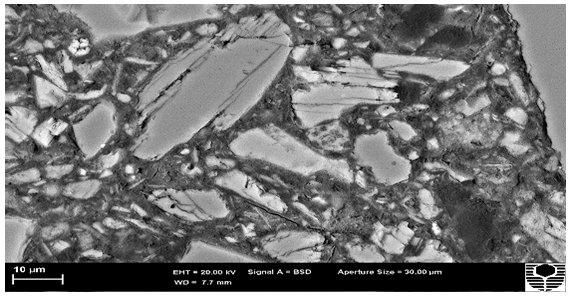
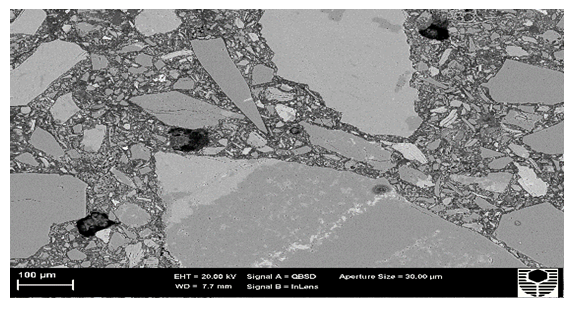
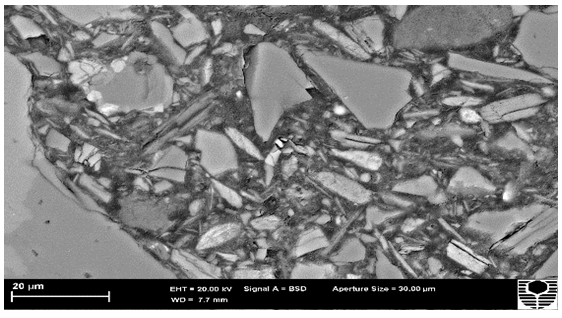
Comparison of the BSE images under low magnification, shows those large continuous pores existing in Figure 11 to be scattered as smaller sized pores by adding nano silica. Under high magnification images, the lack of a continuous structure of the binder around particles is clearly shown by the presence of black voids that might be due to a low cement content of modified CRB materials.
The dispersion of CH is so sparse and localised that it was not possible to see its trends with the increasing nano content in the mixtures. The likely reason can be the consumption of the CH by the nano silica during 28 days of curing/hydration of the specimens.
Conclusion
The following conclusions can be drawn in this paper; It is seen that nano-silica improves the hydration reactions in term of UCS and Mr as design parameters. It causes production of low porous paste with dense microstructure. It effectively strengthens the bonds between aggregates and cement.
The addition of nano-silica material has shown good potential to reduce the calcium hydroxide crystals which can easily be dissolved in water. This makes high durable cementitous material.
The authors acknowledge the use of equipment, scientific and technical assistance of the Curtin University Electron Microscope Facility, which has been partially funded by the University, State and Commonwealth Governments.
References
- 1. AASHTO. Standard Method of Test for Determining the Resilient Modulus of Soils and Aggregate materials. (2003) T: 307-99.
- 2. Cockburn Cement. General Purpose Cement (2007). Product Information
- 3. Diamond, S. The microstructure of cement paste and concrete-a visual primer. (2004) Cement and Concrete Composites 26(8): 919-933.
- 4. Diamond, S., Kjellsen, K. O. Resolution of fine fibrous C-S-H in backscatter SEM examination. (2006) Cement and Concrete Composites 28 (2): 130-132.
- 5. Hicks, R. G., Monismith, C. L. Factors Influencing the Resilient Properties of Granular Materials. (1971) Transportation Research Board (345): 15-31.
- 6. Jameson, G., Shackleton, M. Guide to Pavement Technology Part 4L: Stabilising Binders. (2009) Austroads Incorporated 1-28.
- 7. Engineering Road Note 9: Procedure for The Design Of Road Pavements. (2012) Main Roads Western Australia.
- 8. Specification 501 Pavements. (2012) Main Roads of Western Australia (18): 1-56.
- 9. Stutzman, P. E. Applications of Scanning Electron-Microscopy in Cement and Concrete Petrography. (1994) Petrography of Cementitious Materials ASTM STP (1215): 74-90.
- 10. Witczak, M. W. Laboratory Determination of Resilient Modulus for Flexible Pavement Design (2004). Final Report. 1-48.


