
Efficiency of Atmospheric Pressure Nitrogen Gas Remote Plasma Sterilization and the Clarification of Sterilization Major Factors
Naohiro Shimizu , Shouji Tange , Nobuo Takahashi, Akikazu Sakudo , Akira Mizuno , Eiki Hotta
Affiliation
- 1Department of Science and Engineering, Chuo University, Kasuga Bunkyo Tokyo, Japan
- 2NGK Insulators, Suda Mizuho Nagoya, Japan
- 3Medical Department, Uehara Nishihara Nakagamigun Okinawa, Japan
- 4Applied Electrostatistics Laboratory, Toyohashi University of Technology, Hibarigaoka, Tempaku, Toyohashi, Aichi, Japan
- 5Department of Energy Sciences, Tokyo Institute of Technology, Nagatsuta Midoriku Yokohama, Japan
Corresponding Author
Hideharu Shintani, Department of Science and Engineering, Chuo University, Kasuga Bunkyo 112-0003, Tokyo, Japan, Tel: +81338171733; E-mail: shintani@mail.hinocatv.ne.jp ; hshintani@jcom.zaq.ne.jp
Citation
Shintani, H., et al. Efficiency of Atmospheric Pressure Nitrogen Gas Remote Plasma Sterilization and the Clarification of Sterilization Major Factors. (2015) J Pharm Pharmaceutics 2(1): 22- 28.
Copy rights
© 2015 Shintani, H. This is an Open access article distributed under the terms of Creative Commons Attribution 4.0 International License.
Keywords
Atmospheric nitrogen gas plasma sterilization; Remote gas plasma sterilization; Sterilization major factors; Peroxynitrite anion radical; Relative humidity
Abstract
Experiments reported here were conducted using atmospheric nitrogen gas remote plasma with a pulsed power source. The sterilization efficiency, major sterilization factors and most appropriate sterilization conditions were determined. By varying several factors such as hotplate temperature; relative humidity, water vapor supply location, etc., the most appropriate sterilization conditions were identified. The temperature of the hotplate was varied from 55°C to 75°C and with this 20°C increase in temperature, sterilization was completed in half the time. In this experiment, it was confirmed that the combined effect of a relative humidity (RH) of 0.5% and nitrogen gas was superior to the use of nitrogen gas alone. Furthermore, it was clarified that the optimal humidity was in the range of 0-5 % RH. When RHs of 0, 0.5 and 5% were tested, 0.5% RH was found to be optimal for sterilization. The location of the water vapor supply was changed relative to the hotplate, and use of the most remote port upstream of the reactor resulted in the most efficient sterilization. In addition, the results correlated with the amount of NO radicals generated. The NO radical is the precursor of OONO•- (peroxynitrite anion radical). The sterilization factors associated with this experiment were NO radicals, H2O2, OH radicals, O2•- (superoxide anion radicals) and OONO•- only OONO•- production correlated with sterilization efficiency. Therefore, OONO•- is thought to be the major factor for nitrogen gas plasma sterilization. In addition, as already described, the highest sterilization efficiency was with 0.5% RH and the amount of OONO•- produced correlated with the RH. These data support the idea that OONO•- is the major contributing factor for nitrogen gas plasma sterilization. The D values for this experiment were approximately 10 min.
Introduction
Several papers have been published on gas plasma sterilization[1-4]. The definition of sterilization can be found in the book published from NOVA[2]. The advantages of gas plasma are that sterilization with a sterility assurance level (SAL) of 10-6 and material/functional compatibility can be attained without any difficulty. This is because the penetration depth of gas plasma sterilization is quite shallow (10-20 nm)[4] and therefore only one layer of bioburden can be sterilized. The bioburden represents the type and number of viable microorganisms existing in/on products. Most of the bioburden exists as one layer; therefore, deeper penetration capability is unnecessary for efficient sterilization.
In contrast, existing sterilization procedures including gamma-ray irradiation sterilization, electron-beam sterilization, moist heat sterilization, dry heat sterilization, ethylene oxide gas sterilization, hydrogen peroxide gas sterilization and soon have the ability to penetrate deeper. Therefore, materials are easily sterilized using these methods and a SAL of 10-6 can be attained; however, the sterilized products are useless due to degradation of the product material during the sterilization process, a phenomenon called failure to attain material/functional compatibility[5,6]. Good manufacturing practice (GMP) and sterilization guidelines require simultaneous attainment of both a SAL of 10-6 and material/functional compatibility, but this requirement is difficult to attain with the existing sterilization procedures. Therefore, sterilization procedures using stable gases that are safe to handle and that have shallow penetration depths are needed. As described previously, gas plasma sterilization has the characteristics necessary to meet this requirements[1-4].
For the studies reported here, we used a remote type of nitrogen gas plasma sterilization procedure using a pulsed power supply of SIThy[7]. Several factors associated with the sterilization procedure were determined, and the main factors associated with sterilization were identified. In addition, appropriate sterilization conditions were identified and are reported herein.
Materials and Methods
In (Figure 1), the schema of the experimental system is shown. Remote gas plasma was utilized. The experimental system consists mainly of a humidity control device, plasma producer, and exhaust gas analyzer.
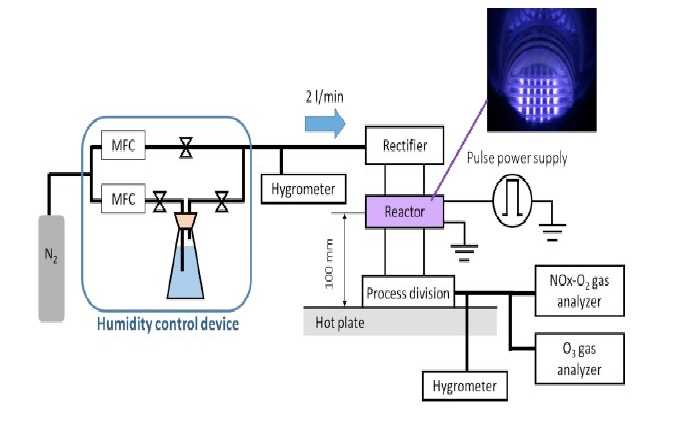
Figure 1: Schema of experimental system MFC stands for mass flow controller.
In (Figure 2) a photograph of the plasma generator parts is presented and the experimental conditions are presented in (Table 1). A detailed explanation of the experimental conditions can be found in the Master’s thesis of Takuya Uyama[8]. (Figure 3) presents the typical waveforms obtained when using the experimental conditions in Table1.
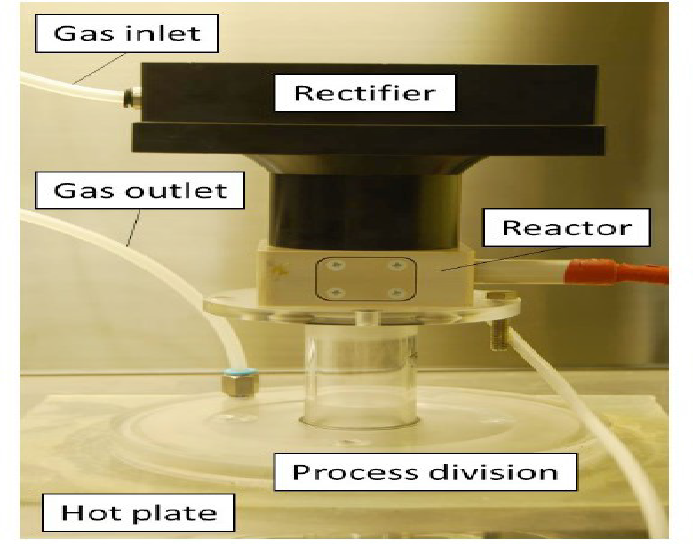
Figure 2 Plasma generation part
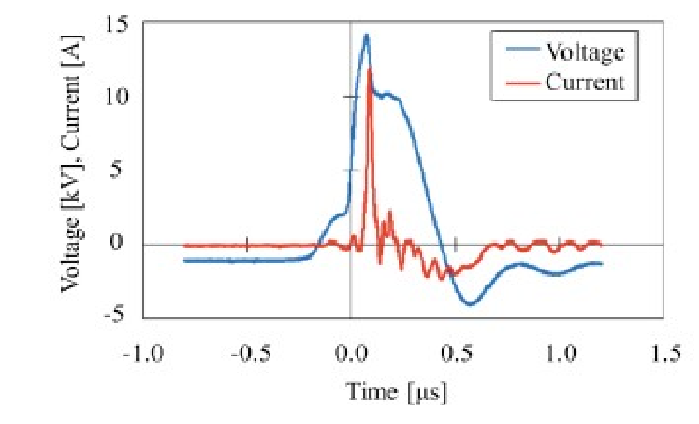
Figure 3: Waveform of voltage and that of current when plasma generated under the experimental conditions presented in Table 1
Table 1: Brief description of experimental conditions
| Types of gases | N2, N2+, H2O |
|---|---|
| Flow rate | 2 L/min |
| Pressure | Atmosphere (1 atm) |
| Distance between reactor and treatment area | 100 mm constant |
| Temperature of hotplate | 55-75° C |
| Humidity | 0.0- 5.0% RH |
| Electric discharge of voltage | 13- 15 kV |
| Electric discharge of current | 7- 12 A |
| Repeated frequency | 1 KHz |
The relative humidity (RH) was measured at the upper and lower sites of the reactor with BKPRECISION Ltd., 725 digital temperature/humidity sensors. Exhaust NOx gases were determined using a Shimadzu NOA-7000 analyzer and exhaust ozone gas was determined by using an EG-700EIII ozone monitor from Ebara Ltd.
Samples to be sterilized, including a biological indicator (BI), were placed on a hotplate (Figures 1 & 4). The distance between the reactor and hotplate was kept constant at 100 mm (Figure 1). The temperature of the hotplate was varied from 55- 75°C (Figure 8).
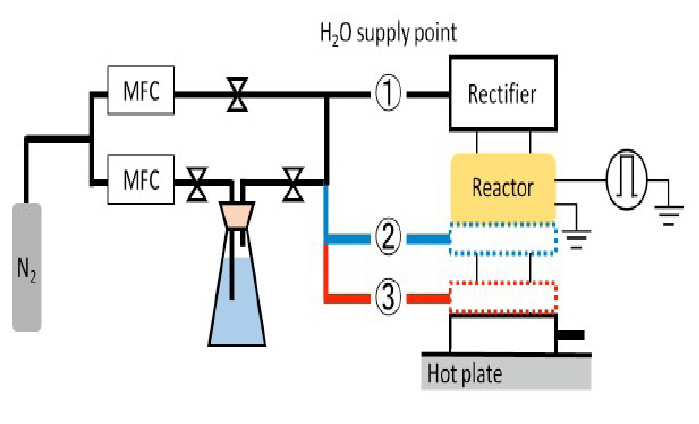
Figure 4: Water vapor supply locations
Nitrogen gas was chosen for use in these sterilization studies because of its higher dissociation energy, which makes it relatively stable compared with other gases, and therefore it is inert and safe to handle (Table 2).
Table 2: Dissociation energy of several types of gases
| Gas | Dissociation energy (eV) |
|---|---|
| N2 | 9.91 |
| O2 | 5.21 |
| H2O | 5.11 |
| NO | 6.50 |
| SO2 | 5.60 |
| N2O | 4.93 |
| CO2 | 5.52 |
| O3 | 1.05 |
| H2O2 | 2.21 |
The need for humidity in gas plasma sterilization has been reported[9,10]. A supply of water vapor was introduced at three locations as shown in (Figures 4& 5). The site of water vapor introduction was varied because water vapor can play a role in generating various reactive oxygen species that may function in the sterilization process. Location (1) was at the upper part of the reactor, location (2) was just below the reactor, and location (3) in (Figure 4) was just before the site of sample treatment. At location (1) of figure 5, NO radicals, which are actively involved in the sterilization process, may be produced[11,12]. In location (2), it can be speculated that N metastables or other reactive oxygen species (ROS) may be generated by reactions with water vapor. In location (3), short-lived OH radical may attack the biological indicator (BI) and result in its sterilization. The actual experimental set up with the different positions of water vapor introductionis shown in (Figure 5).
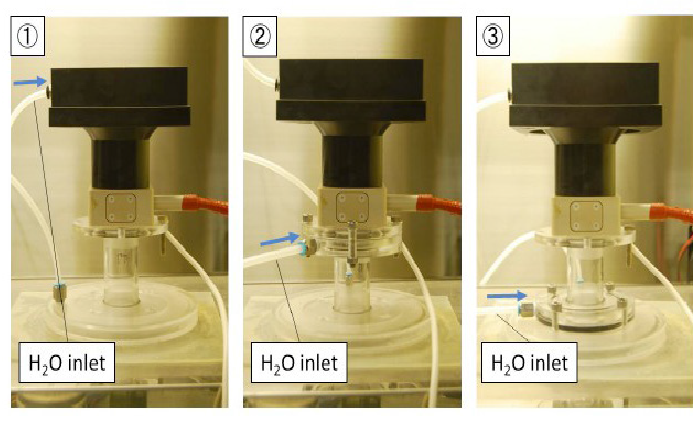
Figure 5: Photograph showing the differing location of water vapor supply
Sterilization evaluation was confirmed by using a BI of Geobacillus stearothermophilus ATCC 7953 with 106 CFU (colony forming unit)/carrier, which was obtained from MESA Lab. The D value (decimal reduction value) was obtained by two methods, the fraction negative method and survivor curve method[13,14]. In the case of the fraction negative method, the BI was incubated using SCDB (soybean casein digest broth) liquid medium at 58°C for 2 days. The result was confirmed using a chemical indicator CI, (Figure 6). When the BI survived, the color changed to yellow, whereas when sterilization was successful, the color remained unchanged (purple). This is due to the production of organic acids (mostly citric acid) from the TCA cycle (Figure 6). To generate the survivor curve, we used SCDA (soybean casein digest agar) solid medium. Ten-fold serial dilutions using SCDB were carried to achieve final plate counts of 30-300 CFU/plate as required in[13] ISO 14161. Spores were retrieved from the BI carrier by using the procedures described in[15]. According to[14] ISO 11138-1, the D value must be obtained using both the fraction negative method and the survivor curve method, so we carried out both methods following the[14] ISO 11138-1 requirement.
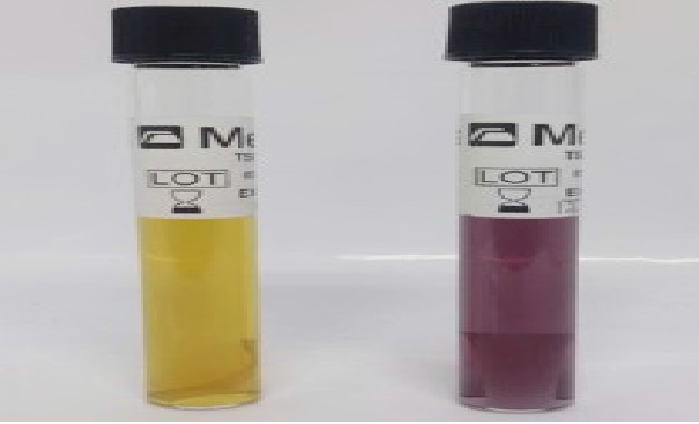
Figure 6: Color change of CI
The tube on the left indicates survival of the BI (acid produced) and that on the right is sterilized (color is unchanged)
Surfaces of spores were observed by using scanning electron microscopy (SEM; S-5500 Hitachi technologies Ltd).
Several reactive oxygen species (ROSs) were analyzed by using emission spectrophotometric analyzers from Maya 2000 Pro (Ocean Optics Ltd.) (Figure 7). A quartz window was incorporated into the reactor and analyses were conducted under the following conditions. The determination wavelength was 200-650 nm, grating was 600 lines/mm, entrance slit width was 10 μm, exposure time was 100 ms and analyses were repeated 5 times. Production of one type of ROS, H2O2, has been reported by nitrogen gas plasma sterilization[16-18], so we measured H2O2 by using a chemical indicator (CI). The CI for H2O2 analysis was from Quantofix Peroxide 25 (MACHEREY-NAGEL Ltd.) and the analysis range was 0-25 μg/mL.
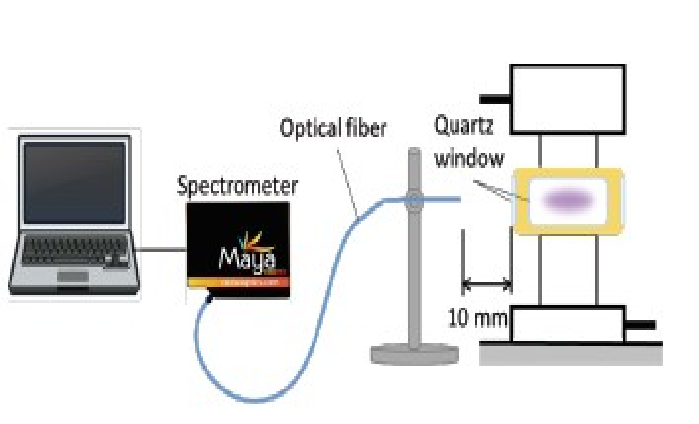
Figure 7: Analysis of reactive oxygen species (ROSs) by using emission spectrophotometric analyzers
All analyses described above are presented and explained in the Results and Discussion.
Results and Discussion
Relationship between sterilization efficiency and hotplate temperature
As shown in (Figure 8), it was determined that the higher the temperature, the greater the sterilization efficiency. From (Figure 8), it is seen that sterilization can be completed in 240 min, 150 min and 120 min at 55°C, 65°C and 75°C, respectively. These results indicate that 75°C is the best temperature for sterilization because an increase of 20°C from 55°C to 75°C resulted in a sterilization time that was half as long, and it is expected that the target materials including the BI are tolerant to this temperature.
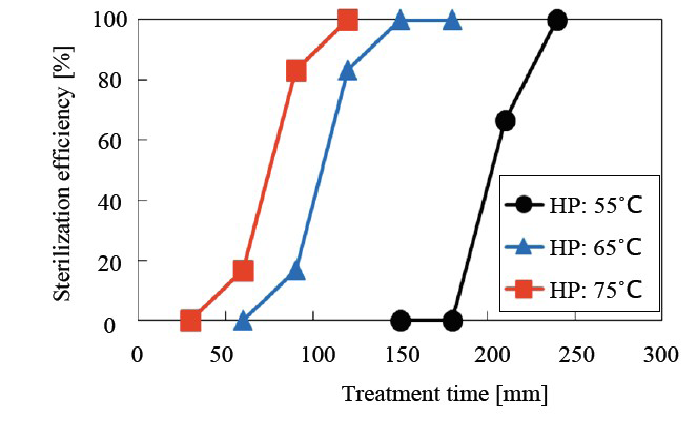
Figure 8: Relationship between sterilization efficiency and hotplate temperature 75°C was found to be the optimal temperature.
Relationship between sterilization efficiency and relative humidity As shown in (Figure 9), the optimum relative humidity (RH) was determined. A RH of 0.5% was the most appropriate for sterilization. This result has been confirmed in another experiment with consistent results.
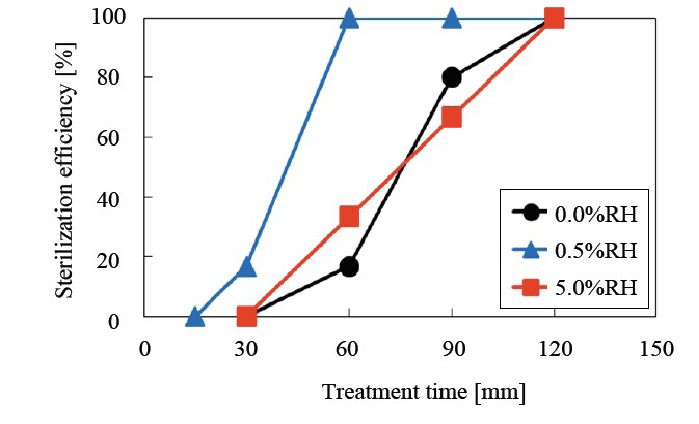
Figure 9: Relationship between sterilization efficiency and relative humidity (RH) 0.5% RH was found to be the optimal condition.
Determination of NOx and O3 (ozone) as exhaust gases NOx and ozone were determined and their amounts were less than 0.6 ppm and 0.04 ppm, respectively. Since the amounts generated were so low, it can be concluded that these ROSs do not contribute to nitrogen gas plasma sterilization.
Relationship between sterilization efficiency and water vapor supply location
As shown in (Figure 10), water vapor supply locations (1) and (2) in (Figure 4) were superior to that of (3) with respect to sterilization efficiency. The reason (2) in (Figure 4) was inferior to the others was likely due to N metastables or OH radicals being inactivated before reaching the BI target. Location(3) in (Figure 4) represents the shortest distance between the water vapor supply and the site of sterilization, whereas location (1) in (Figure 4) was the most remote, but the abundantly produced NO radicals are the precursors of OONO•- (peroxynitrite anion radicals), which are the real sterilization factors described later. Measurement of NO radicals was conducted using (Figures 7 & 14). NO radical detection using CI was also reported by[11]. Additional results supported the conclusion that water vapor supply location (1), rather than location (3) resulted in the best sterilization efficiency.
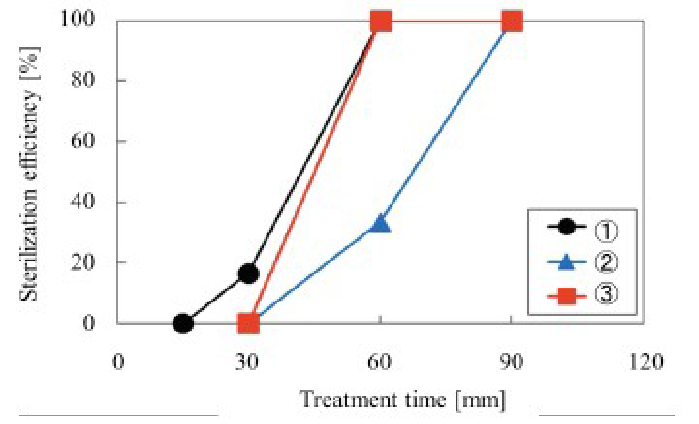
Figure 10: Relationship between sterilization efficiency and water vapor supply portion location C was found to be the most appropriate.
D value (decimal reduction value) determination by the fraction negative method
The D value was determined by the Stumbo Murphy Cochran Procedure, one of the fraction negative methods[13] (ISO 14161). The results are summarized in (Table 3). The D value was the lowest at a RH of 0.5% (~ 8.7 min). The others were approximately 10 min, indicating that a RH of 0.5% resulted in the most efficient sterilization.
Table 3: Determination of D value by using fraction negative method, Stumbo-Murphy-Cochran Procedure and sterilization efficiency The treatment period was 60 min. Initial population was 106 CFU/carrier.
| RH (%) | Non viable sheets | Viable sheets | Total sheets | D value (min) | Sterilization efficiency (%) |
|---|---|---|---|---|---|
| 0.0 | 1 | 11 | 12 | 10.71 | 8.3 |
| 0.5 | 8 | 1 | 9 | 8.66 | 88.9 |
| 5.0 | 3 | 6 | 9 | 10.07 | 33.3 |
D value determination using the survival curve method
The D value was determined under the following conditions: hotplate temperature, 75°C, RH, 0.5% or 0%, and water vapor supply location (1) or (3) as shown in (Figures 11 & 12).
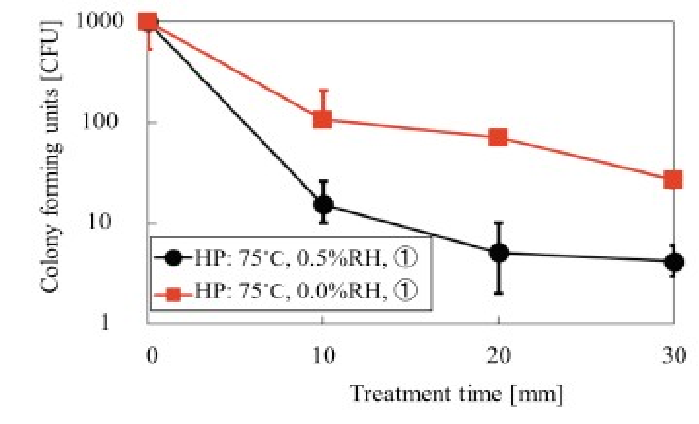
Figure 11: Relationship between treatment time and colony forming units at water vapor supply portion of C, RH of 0.5% and 0% and temperature at 75°C 0.5% RH was found to be the most appropriate. N = 10
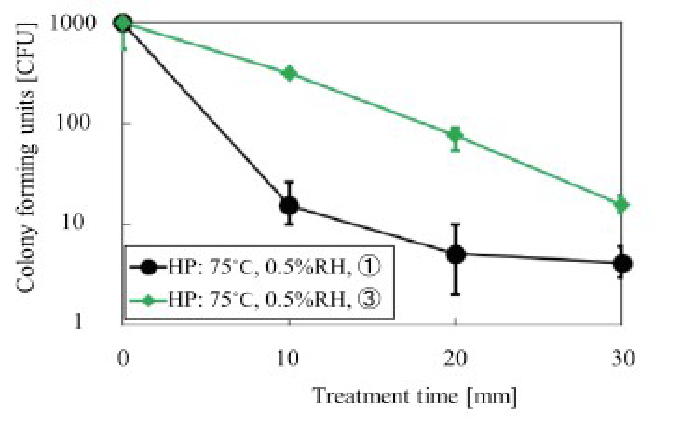
Figure 12: Relationship between exposure time and colony forming unit at water vapor supply locations C and ®, with a RH of 0.5% and a temperature of 75°C Location C was found to be the most appropriate. N = 10
From data in (Figure 11), it can be concluded that the use of a RH of 0.5% was superior to 0% RH, as the D was approximately 10 min. Results presented in (Figure 12) indicate that water vapor supply location (1) was superior to location (3), and the D value was approximately 10 min. These data are consistent with the D values obtained by the fraction negative method. The D value from the survivor curve method was determined using a regression line with a coefficient of correlation of greater than 0.8 as required in[14] ISO 11138-1.
SEM observation of spores
(Figure 13) shows the SEM observation of spores. Compared with the untreated control (left), sterilized spores showed no shrinkage, but some roughness of the surface was observed for spores that were treated for 30 min (middle). However, roughness did not always increase with increasing treatment time up to 90 min (right), indicating that roughness is a temporary rather than permanent phenomenon. It therefore appears that SEM observation does not provide any useful information regarding the success of the sterilization process. Nitrogen gas plasma does not cause any etching in contrast to O2 gas plasma[3,10].
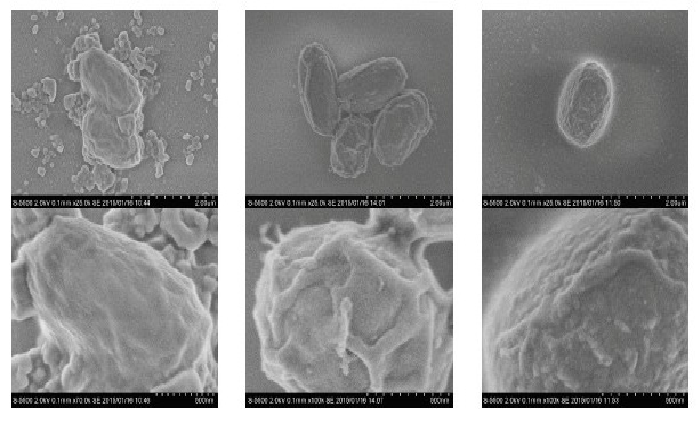
Figure 13: SEM observation of control and treated spores the left panel is the control, the middle is after a 30 min treatment and the right is after a 90 min treatment roughness did not always increase with increasing treated time, indicating roughness is not always a permanent factor.
Emission spectrum analysis
In (Figure 14), the emission spectrum at a RH of 0.5% is shown. By using the equipment shown in (Figure 7), the emission spectrum can be obtained. NO radicals, N2 second positives and N2+ were detected. However, no OH radicals were detected at 310 nm, indicating that OH radicals are not major contributors to nitrogen gas plasma sterilization.
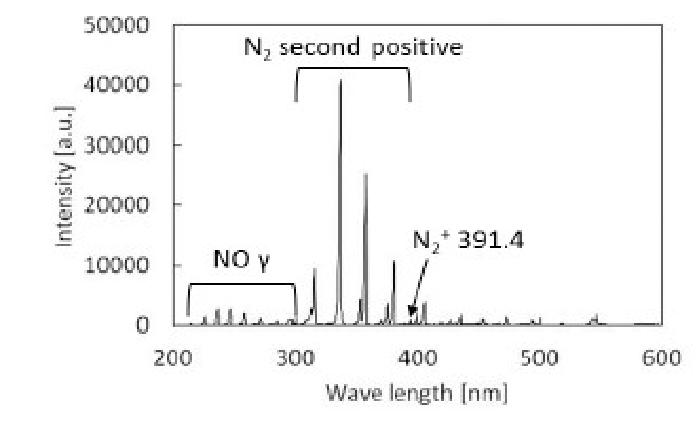
Figure 14: Emission spectrum at a RH of 0.5% OH radical was not detected at 310 nm.
Emission intensity depending on RH at 258.55 nm
A wavelength of 258.55 nm was used for the detection of NO radicals as shown in (Figure 14). In (Figure 15), the relationship between emission intensity at 258.55 nm and relative humidity is presented. As shown in (Table 3), sterilization efficiency was optimal at a RH of 0.5%, indicating that the NO radical itself does not function as a sterilization factor because results in (Figure 15) do not indicate that 0.5% RH was optimal. In addition, 258.55 nm is in the UV-C range and UV-C is thought to be effective for sterilization of microorganisms by causing thymine dimer formation. However, no role for UV-C in sterilization could be demonstrated in previous studies using E. coli and Bacillus atrophaeus ATCC 9372[19,20]
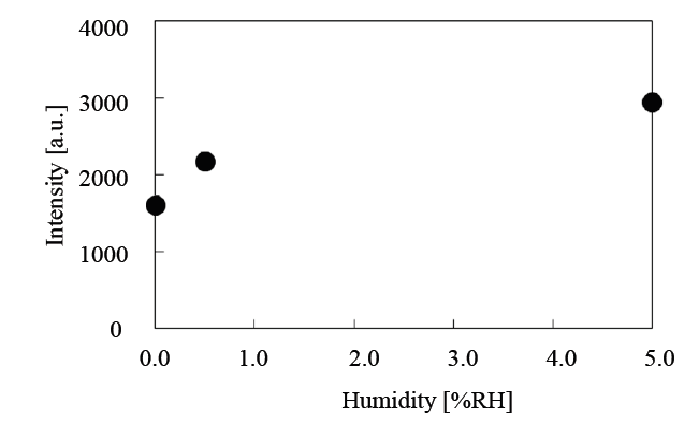
Figure 15: Relationship between emission intensity at 258.55 nm (NO radical formation) and relative humidity (RH)
H2O2 (hydrogen peroxide) determination
H2O2 formation was analyzed using a CI from Macherey-Nagel Ltd., and the relationship between H2O2 concentration and humidity is presented in (Figure 16). As shown in (Table 3), sterilization efficiency was optimal at a RH of 0.5%, indicating that H2O2 or OH radicals from H2O2 do not correlate with the RH tendency; therefore H2O2 or OH radicals do not appear to be major contributors in nitrogen gas plasma sterilization.
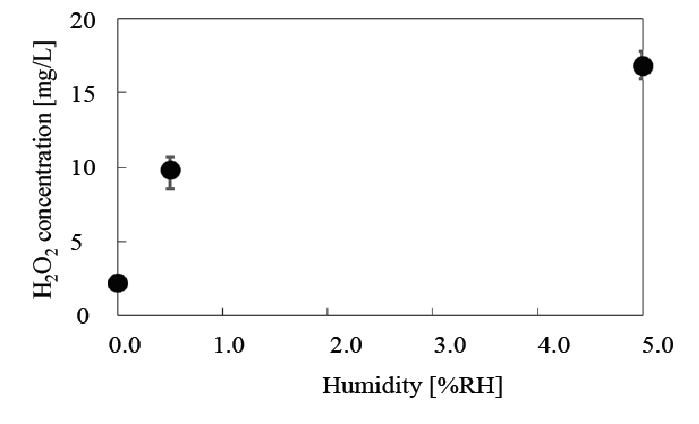
Figure 16: Relationship between H2O2 concentration and relative humidity (RH)
Formation of superoxide anion radicals (O2•-)
Superoxide anion radicals (O2•-) were speculated to be produced at the reactor site and reach the treatment location as shown in (Figure 17). NO• and O2•- were also speculated to be produced even when the water vapor was introduced at location 3; the lowest part in (Figure 4), because sterilization was successful at this location.
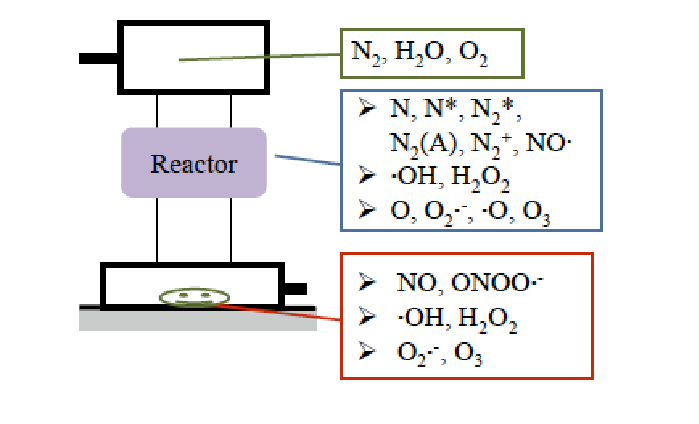
Figure 17: Speculated mechanism of formation of superoxide anion radical (O2•-) in the reactor O2•- produced in the reactor migrates to the treatment location and reacts with NO•, producing ONOO•- just before reaching the BI (Figures 18 and 19).
Measurement of O2•- was not successful; therefore, its effect on gas plasma sterilization remains uncertain, but it can be speculated that O2•- supports the production of peroxynitrite anion radicals (ONOO•-) as shown in (Figure 18).
Formation of OH radicals (HO•)
OH radicals may be formed by the reaction shown in (Figure 18) and/or from H2O2. However, as shown in (Figure 14) and mentioned in section of 8, OH radicals were not detected and therefore OH radicals do not appear to be major contributors to nitrogen gas plasma sterilization.
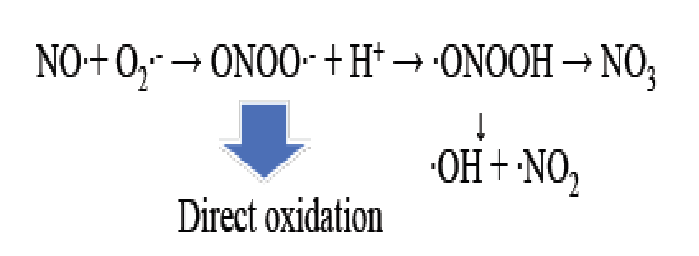
Figure 18: Production of peroxynitrite anion radical (ONOO•-) from NO radical combines with superoxide anion radical (O2•-) Peroxynitrite anion radical (ONOO • -) causes nitration and hydroxylation, which cases deformation of protein or nucleic acids and results in sterilization. Nitration and hydroxylation are oxidation reactions. Peroxynitrite anion radical (ONOO•-) may be the precursor of OH radical if H+ combines to ONOO•- and degrades to •OH and •NO2.
Evaluation of peroxynitrite anion radical (ONOO•-) formation
Peroxynitrite anion radicals (ONOO•-) can be formed from NO radicals + superoxide anion radicals (O2•-) (Figure 18)[21]. The reaction in (Figure 18) will occur just at the upper layer of bacteria (Figure 19), indicating that NO radicals and O2•- migrate from the reactor site to the treatment site and react as shown in (Figure 18) to produce OONO•-.
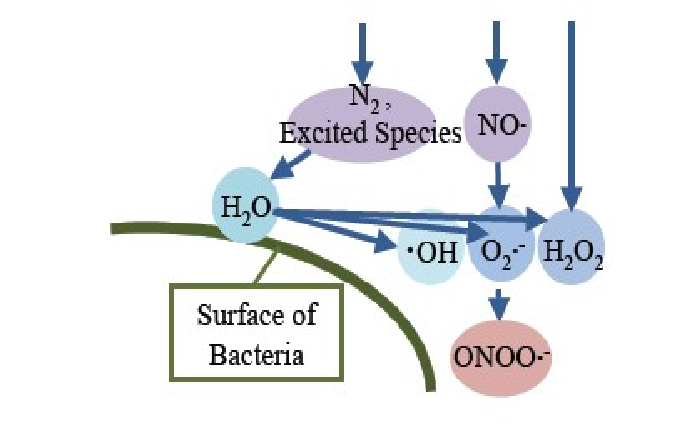
Figure 19: The series of reaction that produce HO•, O2•- , NO• and ONOO•- on the surface of bacteria
Peroxynitrite anion radicals were detected by using aminophenyl fluorescein (APF) reagent as shown in (Figure 20)[22]. The relationship between the peroxynitrite anion radical (ONOO•-) concentration and relative humidity is presented in (Figure 21). As shown in (Table 3), sterilization efficiency was optimal at a RH of 0.5%, indicating that the peroxynitrite anion radical concentration correlates with the RH level. Based on this finding it can be speculated that peroxynitrite anion radicals function as a major sterilization factor in nitrogen gas plasma sterilization. In addition, please refer to the footnote of (Figure 20) for further clarification of ONOO•- as a major sterilization factor.
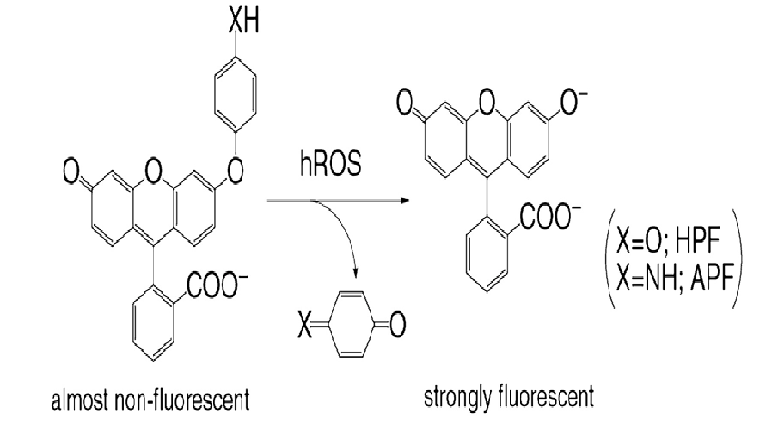
Figure 20: Peroxynitrite anion radical (ONOO•-) detection using aminophenyl fluorescein (APF)
X is NH for APF and O for HPF (hydroxyphenyl fluorescein). hROS is a highly reactive oxygen species. APF is specific to OH radical and ONOO•- and HPF is specific to OH radical. HPF does not detect OH radical, which indicates that the APF intensity is mostly due to ONOO•- formation. When ONOO• - combines with APF (the left reagent, X = NH), fluorescein compounds are produced at an excitation wavelength of 490 nm and emission wavelength of 515 nm.
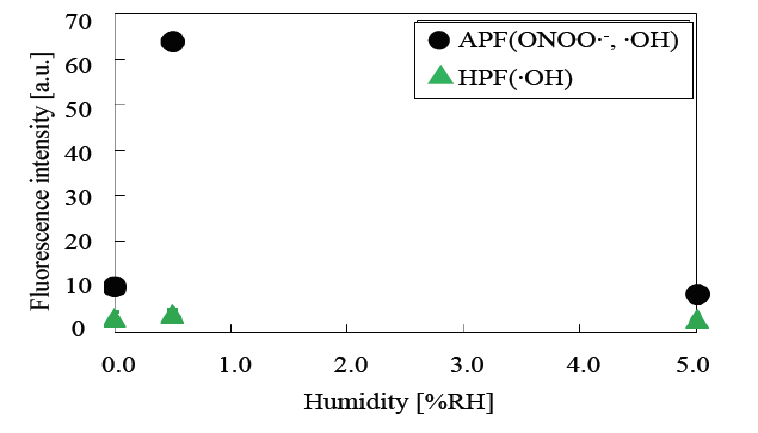
Figure 21: Relationship between fluorescence intensity and relative humidity (RH) for APF and HPF in Figure 20 HPF does not detect significantly •OH, indicating that the intensity of APF may be due to ONOO•- and the tendency of the ONOO•- produced coincides with that of RH, which indicates the optimum RH is 0.5%.
Relation between sterilization efficiency (%) and relative humidity (RH%)
The relationship between sterilization efficiency and relative humidity combined with several ROSs is presented in (Figure 22). The results indicate that sterilization efficiency coincides with the tendency of peroxynitrite anion radical (ONOO•-) formation; therefore, peroxynitrite anion radicals (ONOO•-) are thought to be the major factor of nitrogen gas plasma sterilization. Other factors such as NO radicals, H2O2, OH radicals or O2•- do not coincide with the % RH (Figures 14- 16). Peroxynitrite anion radicals (ONOO•-) react with tyrosine, causing nitration at the p site and with DNA bases, especially guanine, causing nitration (-NO2) and hydroxylation (-OH), which results in transcription failure.
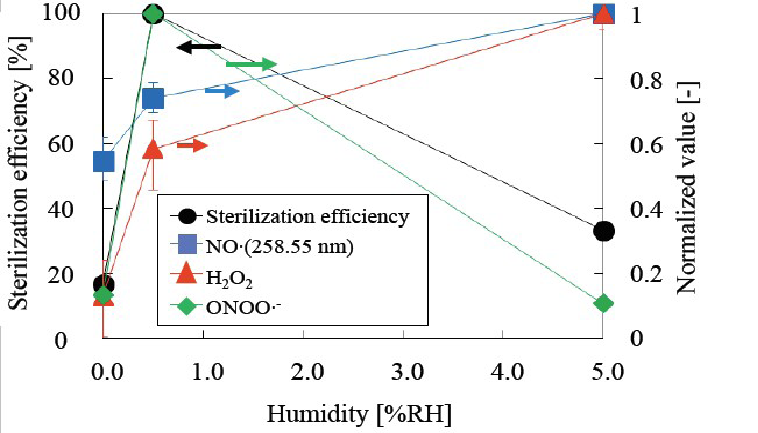
Figure 22: Relationship between sterilization efficiency and relative humidity (RH) for NO radical, H2O2 or ONOO•-. ONOO•- coincides with sterilization efficiency.
Conclusion
The experiments reported here were conducted to identify the nitrogen gas plasma sterilization factor(s) and the appropriate sterilization conditions. By varying hotplate temperature, relative humidity (RH) and water vapor supply location, sterilization efficiency was confirmed. In addition, SEM observation of spore surfaces, emission spectrophotometric analysis, and determination and evaluation of peroxynitrite anion radicals (ONOO•-) were conducted to determine which ROSs contribute to nitrogen gas plasma sterilization.
The sterilization times at 55°C, 65°C and 75°C were 240 min, 150 min, and 120 min, respectively, indicating that at higher hotplate temperatures, the sterilization periods were shorter. Increasing the temperature by 20°C reduced the sterilization period by half.
The sterilization efficiency was improved by using a combination of water vapor and nitrogen gas. Relative humidity (RH) was changed from 0.0% RH, 0.5% RH and 5% RH and the D values under these conditions were 10.71 min, 8.66 min and 10.07 min, respectively, indicating that the optimum RH is 0.5%. In order to identify the sterilization factors, the water vapor supply location was varied. The results indicate that the active species were relatively long-lived because the most efficient location was the most remote from the reactor.
SEM observation indicated that there was no significant difference in the appearance of control and treated spores, and no etching occurred. Treated spores seemed to have increased roughness compared with control spores, but this roughness did not always increase with increasing sterilization time, so roughness is not always an indication of sterilization. The reason has not been clarified, so no ROSs can be confirmed from SEM observation
By attaching a quartz window to the reactor, it was possible to carry out emission spectrophotometric analysis. Based on the emission spectrum at a RH of 0.5%, NO radicals, N2 second positives and N2+ were detected (Figure 14). In this experiment, NO radicals, which are detected at 258.55 nm in the UV-C range, increased with increasing relative humidity (Figure 15). This indicates that the tendency of NO radical formation does not coincide with that of the sterilization tendency as shown in (Figure 22). This result indicates that NO radicals do not participate directly as a major factor in nitrogen gas plasma sterilization.
ROSs such as NO radicals, H2O2, OH radicals, O2•- (super oxide anion radicals) or ONOO•- (peroxynitrite anion radicals) was compared for their contribution to sterilization (Figure 22). The RH tendency coincided with that of OONO•- (Figures 21 and 22); therefore, we conclude that OONO•- may be the major sterilization factor in nitrogen gas plasma sterilization.
Based on the experimental conditions for nitrogen gas plasma sterilization, the water vapor supply position was best at location (1) furthest from the reactor; (Figure 4) and the humidity was optimal at 0.5% RH (Figure 9). Hotplate temperature was optimal at 75°C (Figure 8). Together these results indicate that higher temperature and optimum RH at 0.5% were the best when using position (1) for the water vapor supply (Figures 10- 12). All results support the concluding data summarized in (Figure 22).
We reported the original description of ONOO•- (peroxynitrite anion radical), and demonstrated that ONOO•- is the major factor in nitrogen gas plasma sterilization. In contrast to ONOO•- (Figures 21 and 22), other ROSs do not have identical tendencies with respect to RH (Figure 9, 15 & 16) and only ONOO•- presents an identical tendency to the RH. Therefore, ONOO•- can be defined as the major sterilization factor in nitrogen gas plasma sterilization.
References
- 1. Shintani, H. and Sakudo, A. Gas Plasma Sterilization: Current Technology and New Perspective, in preparation from Horizon Scientific Press- Caister Academic Press in UK (2015).
- 2. Sakudo, A., Shintani, H. Sterilization and Disinfection by Plasma, Sterilization Mechanisms, Biological and Medical Applications. (2011) NOVA Science Publishers.
- 3. Shintani, H., Sakudo, A., Burke, P. et al. Gas plasma sterilization of microorganisms and mechanisms of action. (2010) Exp Ther Med 1(5): 731-738.
- 4. Shintani, H., Shimizu, N., Imanishi, Y., et al. Inactivation of microorganisms and endotoxins by low temperature nitrogen gas plasma exposure. (2007) Biocontrol Sci 12(4): 131-143.
- 5. Shintani, H. Comparison on safety concern among gamma-ray, autoclave and ethylene oxide gas sterilizations of thermosetting polyurethane. (2014) Pharmaceutical Regulatory Affairs: 2167-7689.
- 6. Shintani, H. The relative safety of gamma-ray, autoclave, and ethylene oxide gas sterilization of thermosetting polyurethane. (1995) Biomed Instrum Technol 29(6): 513-519.
- 7. Shimizu, N. The study of High-speed Switching Characteristics of Static Induction Thyristor and its Applications. (2010) Tohoku University, Dr. dissertation.
- 8. Uyama, T. Sterilization efficiency of atmospheric nitrogen remote plasma using pulsed discharge and study for sterilization factors. (2015) Tokyo Institute and Technology, Master Thesis.
- 9. Friedman, A and Friedman, G. (2013) (eds) Effects of water and its amount. In Plasma Medicine, pp.281-282, Wiley Ltd, UK.
- 10. Tamazawa, K., Shintani, H., Tamazawa, Y. et al. Sterilization effect of wet oxygen plasma on bubbling method. (2015) Biocontrol Science, in press.
- 11. Shintani, H., Saito, T., Nakamura, K. Chemical indicator and ink constitute to detect several radicals, metastables and ions produced by gas plasma sterilization. (2014) Japan Patent. 233387.
- 12. Shintani, H. Sterilization mechanisms of nitrogen gas plasma exposure. (2015) Int J BioAnalytical Methods and BioEquivalence Studies: 02-001e.
- 13. Sterilization of health care products—Biological indicators—Guidance for the selection, use and interpretation of results. (2009) ISO 14161: 2009.
- 14. Sterilization of health care products—Biological indicators—Part 1: General requirements. (2009) ISO 11138-1: 2006.
- 15. Sterilization of medical devices—Microbiological methods—Part 1: Determination of a population of microorganisms on products. (2010) ISO 11737-1: 2006.
- 16. Maeda, K., Toyokawa, Y., Shimizu, N., et al. Inactivation of Salmonella by nitrogen gas plasma generated by static induction thyristor as a pulsed power supply. (2015) Food Control 52: 54-59.
- 17. Sakudo, A., Shimizu, N., Imanishi, Y., et al. N2 gas plasma inactivate influenza virus by inducing changes in viral surface morphology, protein, and genomic RNA. (2013) BioMed Res Int 2013: 694269.
- 18. Sakudo, A., Misawa, T., Shimizu, N. et al. N2 gas plasma inactivates influenza virus mediated by oxidative stress. (2014) Front Biosci 6: 69-79.
- 19. Li, J., Sakai, N., Watanabe, M., et al. Study on plasma agent effect of a direct-current atmospheric pressure oxygen-plasma jet on inactivation of E.coli using bacterial mutant. (2013) IEEE Transact Plasma Sci 41: 935-941.
- 20. Deng, X., Shi, J., Kong, M.G. Physical mechanisms of inactivation of Bacillus subtilis spore using cold atmospheric plasma. (2006) IEEE Transactions Plasma Sci 34(4): 1310-1316.
- 21. Novo, E., Parola, M. Redox mechanisms in hepatic chronic wound healing and fibrogenesis. (2008) Fibrogenesis and Tissue Repair 1(1): 5.
- 22. Setsukinai, K., Urano, Y., Kakinuma, K., et al. Development of novel fluorescence probes that can reliably detect reactive oxygen species and distinguish specific species. (2003) J Biol Chem 278(5): 3170-3175.


