
Electricity Generation From Sugar Processing Wastewater Using Environmental Friendly Dual Chamber Microbial Fuel Cell
Affiliation
Department of Chemical Engineering, Mehran University of Engineering & Technology, Jamshoro, Pakistan
Corresponding Author
Anand, Parkash. Department of Chemical Engineering, Mehran University of Engineering & Technology, Jamshoro, Pakistan; E-mail: parwani_anand@yahoo.com
Citation
Parkash, A. Electricity Generation from Sugar Processing Wastewater Using Environmental Friendly Dual Chamber Microbial Fuel Cell. (2016) Lett Health Biol Sci 1(1): 18- 23.
Copy rights
© 2016 Parkash, A. This is an Open access article distributed under the terms of Creative Commons Attribution 4.0 International License.
Keywords
Microbial fuel cell; Sugar industry waste water; Electricity
Abstract
Energy crises in Pakistan are evaluated in terms of inclination since last few years and these crises mainly dependable on the depletion of petroleum. The focus of world is diverting towards the sustainable renewable energy sources. Microbial fuel cell is one of the emerging technologies that use the concept of clean energy using environmental friendly process with the utilization of microbes. In this research a microbial activity is observed that generates electricity from sugar processing wastewater using a dual chamber microbiological reactor. Different observations has been carried out to analyze the wastewater and microbiological parameters with respect to time and it was analyzed that fuel cell generates electricity of 1.28 mA, 0.9 volts and 0.304 Watt/m². Along with the energy generation, the waste water is also treated with this microbial cell having effectiveness of TDS 56.35%, COD 69.3% and BOD 68.1% removal. Due to this efficiency, the microbial fuel cell may replace the conventional harmful energy sources.
Introduction
The modern era is diverting towards the mechanization and metropolitanization specially the third world country like Pakistan. This industrial revolution causes the environmental issues and energy crises. The main reason for these crises is the reliance on the fossil fuels and untreated effluent disposal. Various organic wastes causes the problems like leachate that affects the constituents of biosphere[1-3]. The high valued organic wastes are most abundant in the effluents of industrial waste streams[4,5]. Sugar industry generates unwanted residual liquid waste during the production and processing of products. The waste water from sugar industry generated in the ratio of 1000 liters/ton of sugarcane[6-8]. Effluent water of sugar industry contains the high organic content that microbes utilize along with dissolve oxygen of water causes it inappropriate for the Biopsheric[9]. This contamination in the biosphere results as a habitat hazard[10]. Cleanup treatments like bioremediation of sugar industry’s wastewater are being under consideration[11]. The emerging bioremediation technology with the sustainable electricity generation is known as microbial fuel cell[12]. The fuel cell utilizing the microbes generates electrical energy by the organic waste using the microbial catalytic activity for free electrons generation by conversion of chemical energy of waste along with the sustainable treatment of wastewater[13]. The sustainable development of fuel cell technology using microbe scope towards the solution of energy crises by generating electricity and hydrogen along with the effluent treatment of organic wastes[14]. Treatment applications using MFCs applicable for domestic sewage, brewery, distillery, sugar, paper and pulp, rice mill, swine wastewater and phenolic wastewater[15]. Furthermore supremacy of MFCs is prospective of bio solid production in collation of Aerobic treatments.
Materials and Methodology
Wastewater collection
Wastewater was assembled from molasses creation plant, Malegaon Sugar Factory, in Maharashtra, India. The wastewater was used as substrate for all tests without additions of any other nutrient or trace metal. Wastewater effluent was refrigerated at about 4° C prior to processing.
Fabrication of Microbial Fuel Cell (MFC)
Duel Chamber Microbial fuel cell have been fabricated for the treatment of sugar and mill wastewater.
Components of MFC: Components for development of MFCs were as follows:
• Three Non-Reactive plastic boxes of seven liters capacity
• Agar
• Pencil leads 2 mm Diameter
• Copper wire
• PVC pipe 2 cm Diameter
• Sealants
• Multimeter
Role of components for the fabrication of MFC
Plastic body box: Main body of MFC includes anode chamber for holding wastewater.
Agar: It is basically a connection link for anode and cathode chamber that is permeable to protons only.
Pencil leads: Cathodic and anodic materials.
Copper wire: Used as a conductor for the completion of external circuit from multimeter to electrodes.
PVC pipe: Surrounds the agar salt bridge. Sealant: Epoxy sealant is used for making the jointing connection of Plastic boxes with PVC.
Multimeter: Voltage and current quantifying equipment.
Construction of Microbial Fuel Cell
Stride 1: Anodic compartment selection: Anodic chamber was selected as a plastic compartment with non-reactive nature.
Stride 2: Protonic permeable salt bridge path preparation: The Agar salt bridge was constructed using common salt, agar and water. 650 ml of water was boiled in a beaker, 65 grams of agar and75 grams of salt were added to the boiling water, the mixture was further boiled for 3 - 5 minutes. The mixture is placed in PVC pipe and allowed to solidify and was kept in the refrigerator for 24 hours.
Stride 3: Electrodes foregathering: Electrodic material was selected as graphite for both cathodic and anodic electrode. Ordering of electrodes was done in such a way it seems as a brush of graphite on plastic pipe as shown in Figure 1. The dimensions of graphitic rods are such as its length is 90 mm and diameter is 2 mm. Microbial fuel cell doesn’t contain a separate cathodic chamber but instead of it the rods of graphitic pencils were arranged on the protonic permeable salt bridge with the wounded copper wire that behaves like a cathode for the cell. Electronic acceptance from anodic chamber was boosted from the oxygenated air. Anodic chamber was all with Ditch on the top so that graphitic rods with plastic pipe and copper rounds can go through the ditch.
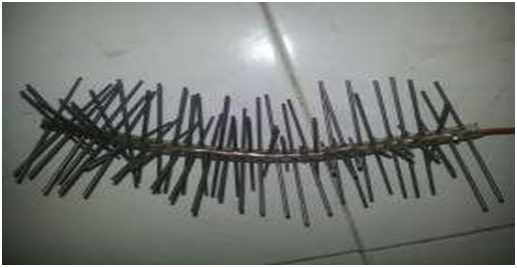
Figure 1: Arrangement of electrodes
Stride 4: Erection of microbial fuel cell: Microbiological fuel cell was fabricated and grouped together with cathodic and anodic chamber and jointed with the circular pathway of agar solution salt bridge acted as protonic permeable pathway and sealed for making no air induction. Water leakages were checked for this MFC reactor.
Results and Discussion
General
The characteristics of sugar wastewater and the experimental data relating to single chambered microbial fuel are discussed here.
Quality parameters of sugar wastewater: The qualitative parameters of sugar wastewater are presented in (Table 1).
Table 1: Parameters of sugar wastewater
| S.No | Parameters | Unit | Sugar Wastewater |
|---|---|---|---|
| 1 | TDS | (mg/L) | 1330 |
| 2 | TSS | (mg/L) | 1540 |
| 3 | 5 days BOD | (mg/L) | 1040 |
| 4 | COD | (mg/L) | 4647 |
| 5 | pH | - | 4.35 |
| 6 | Chlorides | (mg/L) | 258 |
| 7 | Color | - | Brownish |
Treatment and current generation using various concentrations of sugar wastewater: Feed concentration of wastewater was prepared by diluting it with water. Variation in the attentiveness of microbiological fuel cell’s substrate was regarded as feed concentration. The influent(I), effluent(E) and percent removal (%) of chemical oxygen demand, Total dissolved solids and Biochemical oxygen demand for various feed concentrations are presented in tables.
Table 2: Treatment efficiency of sugar wastewater and current generation for various feed concentration.
| Time (Day) |
COD (mg/L) | BOD (mg/L) | TDS (mg/L) | pH | Current (mA) |
Voltage (V) |
|||||||
|---|---|---|---|---|---|---|---|---|---|---|---|---|---|
| I | E | % | I | E | % | I | E | % | I | E | |||
| 0 - 4 | 200 | 127.8 | 36.1 | 200 | 131.6 | 34.2 | 423 | 312.69 | 26.1 | 6.8 | 6.9 | 0.20 | 0.16 |
| 4 - 8 | 400 | 245.6 | 38.6 | 400 | 252.4 | 36.9 | 514 | 393.40 | 29.3 | 6.9 | 7.1 | 0.32 | 0.23 |
| 8 - 12 | 600 | 343.8 | 42.7 | 600 | 362.4 | 39.6 | 623.2 | 420.03 | 32.6 | 7.1 | 7.3 | 0.36 | 0.36 |
| 12 - 16 | 800 | 413.6 | 48.3 | 800 | 456.8 | 42.9 | 716.5 | 452.82 | 36.8 | 7.4 | 7.4 | 0.49 | 0.39 |
| 16 - 20 | 1000 | 439 | 56.1 | 1000 | 536 | 46.4 | 824.9 | 493.29 | 40.2 | 7.6 | 7.6 | 0.57 | 0.42 |
| 20 - 24 | 1200 | 487.2 | 59.4 | 1200 | 610 | 49.1 | 944.6 | 542.20 | 42.6 | 7.8 | 7.8 | 0.62 | 0.59 |
| 24 - 28 | 1400 | 547.4 | 60.9 | 1400 | 693 | 50.5 | 1012 | 545.46 | 46.1 | 7.9 | 7.9 | 0.73 | 0.64 |
| 28 - 32 | 1600 | 585.6 | 63.4 | 1600 | 710.5 | 55.6 | 1196 | 595.60 | 50.2 | 8.0 | 8.0 | 0.91 | 0.83 |
| 32 - 36 | 1800 | 631.8 | 64.9 | 1800 | 712 | 60.4 | 1202 | 572.48 | 52.4 | 8.1 | 8.1 | 1.02 | 0.97 |
| 36 - 40 | 2000 | 694 | 65.3 | 2000 | 718 | 64.1 | 1364 | 622.25 | 54.4 | 8.3 | 8.3 | 1.26 | 1.01 |
| 40 - 44 | 2200 | 701.8 | 68.1 | 2200 | 720 | 67.3 | 1494 | 648.65 | 56.6 | 8.4 | 8.4 | 1.40 | 1.24 |
From the above data, it is seen as microbiological fuel cell containing sugar wastewater has ability to reduction of COD that pointed out that organic in waste were metabolized by the microorganism act as electronic donor. Total suspended solids along with the chemical and biochemical oxygen demand were analyzed linearly in MFC. The effectiveness of MFC analyzed day by day removal efficiency that BOD ranges as 34.6% to 68.1%, COD ranges as 35% to 69.3%, TDS ranges as 25.4% to 56.3%, pH ranges as 7.1% to 8.2%, current ranges as 0.11 to 1.28 mA, voltage ranges as 0.1 to 0.9 V and increment in the feed concentration is 200 mg COD/l to 1400 mg COD/l.
Effective analysis of feed concentration and time with respect to COD removal: The microbes in the fuel cell actively seen as working like metabolization agent for organic source and this behavior indicates the effectiveness of Chemical oxygen demand removal. Experimental values showed significant potential of COD removal along with current generation with respect to residence time in fuel cell. The feed concentration seems to increase from 200 mg COD/l to 1400 mg COD/l with the removal efficiency of COD from 35 % to 69.3% as shown in (Figure 2). With the feed concentration increment, efficiency of COD removal tends to increase linearly. The equilibrium maintained in 3 to 4 days of feed concentration and COD removal with the time gradient.
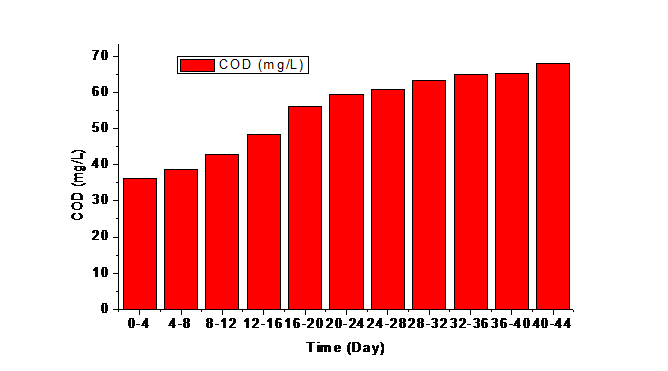
Figure 2: COD Reduction of sugar wastewater at various feed concentrations in MFC.
Effective analysis of feed concentration and time with respect to BOD removal: Biochemical oxygen demand of sugar wastewater tends to decrease and to obtain this fact, the analysis of BOD was done on first and final day for each concentration of feed. In microbiological fuel cell, when increment was done on feed concentration from 200 mg COD 0l to 1400 mg COD/l, the increment of removal efficiency of BOD seems from 34.6 % to 70.1 %. The equilibrium maintained in 3 to 4 days of feed concentration and BOD removal with the time gradient.
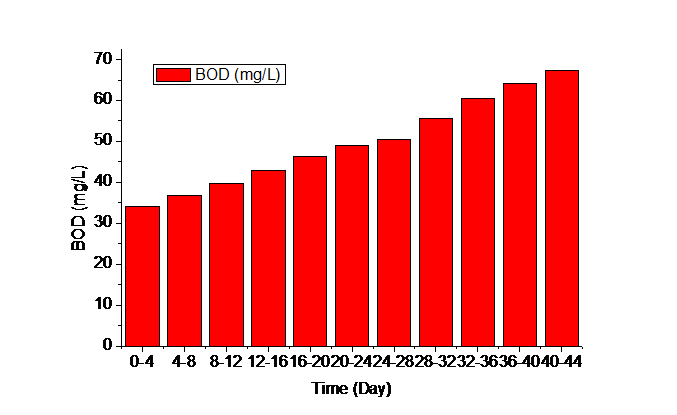
Figure 3: BOD Reduction of sugar wastewater at various feed concentrations in MFC
Removal efficiency of TDS of sugar waste water for different feed concentration: During the different residence time in microbiological fuel cell, the removal efficiency of total dissolved solids seems to increase with increase in feed concentration i.e. 200 mg COD/l to 1400 mg COD/l. At this concentration with the time period of 0 to 44 days, the removal efficiency of TDS is from 26.1% to 56.6% as shown in (Figure 4). The equilibrium maintained in 3 to 4 days of feed concentration and TDS removal with the time gradient.
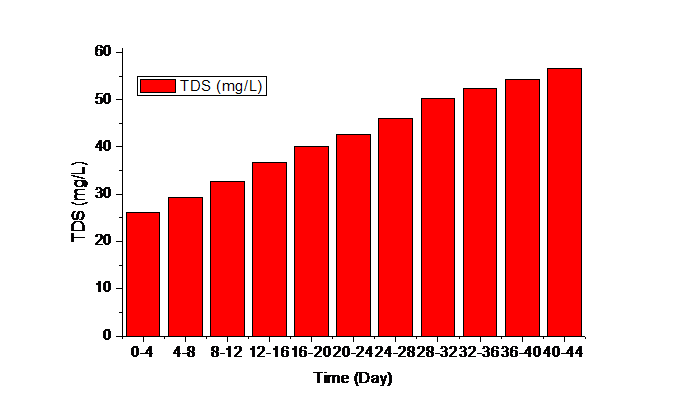
Figure 4: TDS Reduction of sugar wastewater at various feed concentrations in MFC
Analysis of pH variation of Sugar wastewater at different residence time in MFC: In dual chamber microbiological cell, the pH tends to increases with respect to residence time. This pH is also dependent on the feed concentration. As feed concentration increases from 200 mg COD/l to 1400 mg COD/l with respect to time from 0 to 44 days, the pH also tends to increases from 6.9 to 8.4. The equilibrium maintained in 3 to 4 days of feed concentration and pH increment with the time gradient.
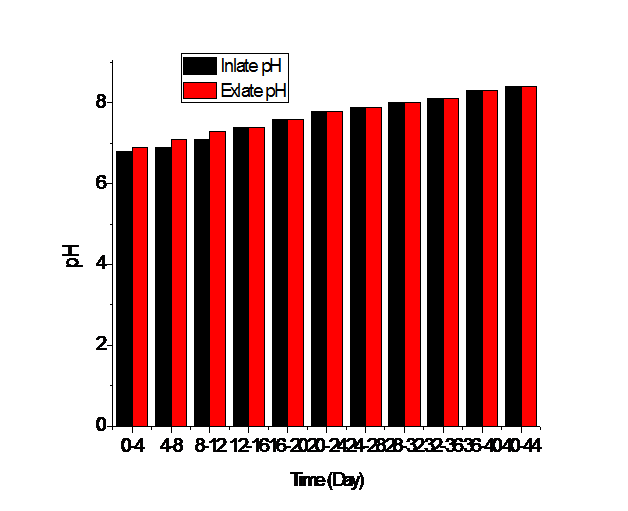
Figure 5: pH variation of sugar wastewater at various feed concentrations in MFC
Generation of current and voltage from sugar waste water at different residence time in MFC: At the different residence time for sugar waste water in MFC, it seems that electricity production tends to increases as shown in (Figure 6 and Figure 7). This increment is directly dependent on the feed concentration and the time rate at which feed is placed into MFC. With the feed concentration increment from 200 mg COD/l to 1400 mg COD/l and residence time from 0 to 44 days, the current generation increased from 0.20 to 1.40 mA and voltage increased from 0.16 to 1.24 V.
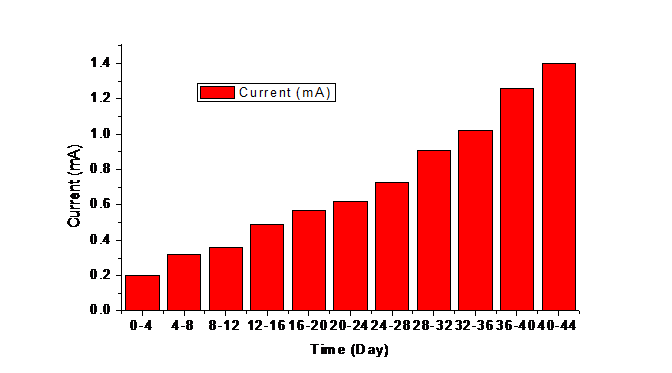
Figure 6: Current generation of sugar wastewater at various feed concentrations in MFC
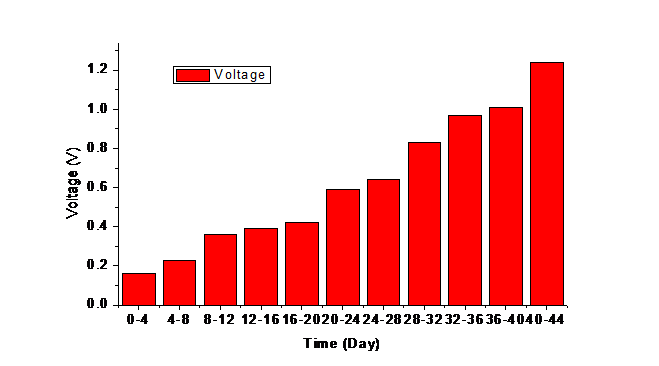
Figure 7: Voltage generation of sugar wastewater at various feed concentrations in MFC
Conclusion
Based on the observation, it is concluded that microbiological fuel cell has the multivariate properties in which the sugar industry waste water is treated in an environmental friendly way along with the generation of electricity. MFC showed a great potential efficiency for pollutants removal that is BOD 68.1%, TDS 56.3%, COD 68.1% at feed concentration from 200 mg COD/l to 1400 mg COD/l. It is also concluded that current voltage and power generation are 1.40 mA, 1.24V and 0.3.4 watt/m² respectively along with pH increment from 6.9 to 8.4 with the residence time of 0 to 44 days.
References
- 1. Logan, B.E. Microbial Fuel Cells. (2008) John Wiley & Sons.
- 2. Booth, D. Understanding Fuel Cells. (1993) Home Power #35 37-40.
- 3. Lewis, N.S., Nocera, D.G. Powering the planet: chemical challenges in solar energy utilization. (2006) P Natl Acad Sci USA 103(43): 15729–15735.
- 4. Bullen, R.A., Arnot, T.C., Lakeman, J.B., et al. Biofuel cells and their development. (2006) Biosens Bioelectron 21(11): 2015-45.
- 5. Renewable Energy World. Renewable fuel cell power from biogas. (2001) James & James Ltd.
- 6. Lui, H., Ramnarayanan, R., Logan, B.E. Production of electricity during wastewater treatment using a single chamber microbial fuel cell. (2004) Environ Sci Technol 38(7): 2281-2285.
- 7. Bunnetto, H.P. Bugpower-electricity from microbes. (1990) Frontries of Science Blackwell Publishing 66-82.
- 8. Bunnetto, H.P. Bugpower-electricity from microbes. (1990) Frontries of Science Blackwell Publishing 66-82.
- 9. Davis, F., Higson, S.P. Biofuel cells-Recent advances and applications. (2007) Biosens Bioelectron 22(7): 1224-1235.
- 10. Pham, T.H., Rabaey, K., Aelterman, P., et al. Microbial fuel cells in relation to conventional anaerobic digestion technology. (2006) Eng Life Sci 6(3): 285-292.
- 11. Logan, B.E., Regan, J.M. Electricity-producing bacterial communities in microbial fuel cells. (2006) Trends Microbiol 14(12): 512-518.
- 12. Chaudhuri, S.K., Lovely, D.R. Electricity generation by direct oxidation of glucose in mediator less microbial fuel cells. (2003) Nat Biotechnol 21(10): 1229-1232.
- 13. Picioreanu, C., Kreft, J.U., Van Loosdrecht, M.C. Particle-Based Multidimensional Multispecies Biofilm Model. (2004) Appl Environ Microbiol 70(5): 3024-3040.
- 14. Picioreanu, C., Katuri, K.P., Head, I.M., et al. Mathematical model for microbial fuel cells with anodic biofilms and anaerobic digestion. (2008) Water Sci Technol 57(7): 965-971.
- 15. Ramanavicius, A., Kausaitea, A., Ramanaviciene, A. Enzymatic biofuel cell based on anode and cathode powered by ethanol. (2008) Biosens Bioelectron 24(4): 767-772.


