
Evaluation of Functional Profiles of Mango Peel Extract and its Major Component, Mangiferin in Hypercholesterolemic and Diabetic Rats
Muhammad Imran1, Masood Sadiq Butt2, Muhammad Tauseef Sultan3, Ali Imran4 and Ahmed El-Ghorab5*
Affiliation
- 1Department of Diet and Nutritional Sciences, Imperial College of Business Studies, Lahore
- 2National Institute of Food Science and Technology, BZU, Multan
- 3Institute of Food Science and Nutrition, BZU, Multan, Pakistan
- 4Department of Food Science, nutrition and home economics, GCUF, Faisalabad
- 5Faculty of science, Chemistry Department Aljouf University; Kingdom Saudi Arabia; Flavour and Aroma Dept. NRC, Egypt
Corresponding Author
Ahmed El-Ghorab, Faculty of science, Chemistry Department Aljouf University; Kingdom Saudi Arabia; Flavour and Aroma Dept. NRC, Egypt, E-mail: aghorab21@yahoo.com
Citation
El-Ghorab, A., et al. Evaluation of Functional Profiles of Mango Peel Extract and Its Major Component, Mangiferin in Hypercholesterolemic and Diabetic Rats. (2017) J Food Nutr Sci 4(1): 13- 22.
Copy rights
© 2017 El-Ghorab, A., et al.. This is an Open access article distributed under the terms of Creative Commons Attribution 4.0 International License.
Keywords
Mango peel; Mangiferin; Liver and kidney functioning; Hematological aspects; Electrolyte balance
Abstract
Functional activities of mango peel extract (MPE) and mangiferin were investigated using hypercholesterolemic and diabetic rats. The liver functioning tests resulted that the aspartate aminotransferase levels suppressed 9. 16% and 16. 53% by MPE and mangiferin, respectively, in the disease rats. The kidney functioning tests resulted that abnormally high creatinine levels in diabetic rats were suppressed 6. 19% and 4. 12% by MPE and mangiferin, respectively. Hematological aspects were examined by measuring the levels of red blood cell, hemoglobin, hematocrit and MCV. Mangiferin exhibited the highest effect to the hemoglobin levels both in hypercholesterolemic rats and diabetic rats. The white blood cell (WBC) aspects were examined by determining the levels of WBC, neutrophils, monocytes and lymphocytes. MPE and mangiferin reduced the levels of WBC in the disease rats, whereas the levels of other three indices showed only slight WBC reduction. MPE and mangiferin improved the Na, K and Ca balance in the disease rats. Mango peel containing mangiferin can be used for the development of functional foods and beverages.
Introduction
The metabolism differs in normal and diseased states. In normal conditions, the body and its different organs and their systems, such as liver, renal, digestive system, circulatory systems and immune system, behave in normal fashion and the levels of various secretions including enzymes, hormones, electrolytes, endogenous antioxidants remain in normal ranges[1]. Also, hematological indices, such as total white blood cells (WBC), neutrophiles, lymphocytes, monocytes, eosinophiles and basophiles were used to diagnosis the abnormality of health[2]. Also, oxidative stress caused by reactive oxygen species (ROSs) has been examined using the various secretions levels[3].
Human and animals are exposed to ROSs constantly because they are generated by many different factors, including poor dietary habits, lack of physical exercise and smoking as well as environmental pollutants[4]. Consequently, the abnormalities and damages occurred in the living cells might lead to various diseases[5]. In order to improve the overall defense system against ROSs, ingestion of antioxidants, such as polyphenols, has been recommended[6]. In fact, many researchers have been investigating to find potent antioxidants in natural plants[7]. Among many natural antioxidants reported, mangiferin the major component of mango peel extract−has been known to possess the potent protective effects against the diseases associated with oxidative stress, such as diabetes and cancer[8,9] (Figure 1). The present authors also demonstrated the antioxidant activity of mangiferinin a previous report[10].
Figure 1: Structure of mangiferin.
There are many research reports on the beneficial effects of mango fruits[11], in particular, antioxidant activity. Even though the potent antioxidant activity of mango peel extract and its major component, mangiferin has been reported in many references[ 12], there is virtually no report on the entire functional profiles of mango peel extract and magniferin.
The present research focused on elucidating the health endorsing perspectives of mangiferin against hyperglycemia and hypercholesterolemia along with enhancing the glutathione level in blood through the supplementation of functional drinks. The results obtained are useful for nutritionists and dietetics for designing an appropriate diet for patients suffering from metabolic ailments.
Table 1: Diets and functional drinks plan.
| Studies | Study I | Study II | Study III | ||||||
|---|---|---|---|---|---|---|---|---|---|
| Normal rats | Hypercholesterolemic rat | Diabetic rats | |||||||
| Groups | 1 | 2 | 3 | 1 | 2 | 3 | 1 | 2 | 3 |
| Drinks | T0 | T1 | T2 | T0 | T1 | T2 | T0 | T1 | T2 |
Materials and Methods
Animals
Total 100 male Sprague dawley rats (National Institute of Health (NIH), Islamabad, Pakistan) at weaning stage were used. The rats were placed in an air conditioned room at 23 ± 2°C with 55 ± 5% humidity and a light/dark (12 h/12 h) cycle and acclimatized by feeding basal diet[12] for one week. For the preliminary study, some rats were sacrificed to establish the baseline trend. The experimental rats were divided into three groups (30 rats each) and treated as follows:
Group I: Normal rat group (healthy rats, control group), the control rats were fed with the normal diet comprised 10% corn oil, 10% protein, 66% starch, 10% cellulose, 3% mineral and 1% vitamin mixture.
Group II: Hypercholesterolemic rat group, the hypercholesterolemic rats were prepared by feeding a normal diet containing 1. 5% cholesterol and 0. 5% cholic acid.
Group III: Diabetic rat group, the diabetic rats were induced by a single intraperitoneal injection of a citrate buffer solution (pH 4. 5) of streptozotocin (STZ) @ 65 mg/kg. The normal diet was fed during the experiment.
Studies on effects ofmangopeel extract and magniferin against diabetic and hypercholesterolemicrats
Rats in each group were divided into three sub groups (10 rats each; T0, T1, and T2) and each group was fed with different diet.
• The subgroup T0 was fed with a normal diet alone (control).
• The subgroup T1 was fed with a normal diet containing 0.6 mg/mL mango peels extract.
• The subgroup T2 was fed with a normal diet containing 0.6 mg/mL mangiferin.
During 8 weeks of efficacy studies, physical parameters such as feed and drink intakes and body weight were recorded. At the end of the study, the overnight fasted rats were decapitated (inhalation of chloroform) and then blood was collected in EDTA coated tubes.
Liver and kidney functioning tests
Liver function tests measures the level of alanine aminotransferase( ALT), aspartate aminotransferase (AST), and alkaline phosphatase (ALP) in the samples. The concentrations of ALT and AST were measured by the dinitrophenylhydrazene (DNPH) methodusing Sigma Kits 58 - 50 and 59 - 50 (Merck, München, Germany),respectively and ALP by Alkaline Phosphates– DGKC method[13]. The serum sampleswere investigated for urea by GLDH-method and creatinine by Jaffe-method usingcommercial kits purchased from Merck (München, Germany) to assess the proper renal functionality[13,14].
Hematological aspects The samples collected in EDTA coated tubeswere analyzed for completeblood profile like total red blood cells count, hemoglobin, hematocrit, mean corpuscularvolume (MCV)[15]. Platelets count anderythrocytes sedimentation rates were determined by the previously reported method[16]. Total white blood cells (WBC), neutrophiles, lymphocytes, and monocytes were also determined by the previously reported method[12] using an automatic blood analyzer (Nihon Kohden, Tokyo, Japan).
Electrolytes balance
The Na, K and Ca in the samples were determined by the previously reported method[17] using a KHE-5-automatic electrolyte analyzer (Jinan Kinghawk Technology Co.; Ltd.; Jinan, China).
Statistical analysis
The data obtained in the present study were subjected to statistical analysis using completely randomized design (CRD) through statistical software Cohort version 6. 1 (Co Stat, 2003). Furthermore, analysis of variance (ANOVA) technique was applied to determine the level of significance[18].
Results and Discussion
Liver functioning tests
In study I (trial 1and 2) (Figure 2), the recorded AST values for T0, T1 and T2 were 109. 05 ± 6. 32 and 104. 42 ± 7. 43, 103. 25 ± 7. 82 and 100. 62 ± 7. 02 and 105. 15 ± 7. 72 and 101. 80 ± 6. 92 IU/L, respectively. Likewise in study II (trial 1), value for this attribute was highest in T0 (141. 77 ± 7. 62 IU/L) that significantly lowered in T1 (125. 19 ± 9. 62 IU/L) and T2 (128. 01 ± 8. 43 IU/L) groups. Similar response was observed in trial 2; the maximum valuewas noticed in T0 as135.81 ± 8.23 IU/L followed by T2 122.38 ± 9.75 IU/L and T1 120.20 ± 9.34 IU/L, respectively. Moreover in study III (trial 1 and 2), serum AST concentrations declined to 110.92 ± 8.63 and 101.00 ± 9.55 and 113.69 ± 8.12 and 103.50 ± 7.23 IU/L in T1 and T2 groups, respectively as compared to 119.27 ± 8.51 and 113.11 ± 6.68 (IU/L) in T0 (Table 2). Mean ALT values in study I (trial 1) for T0, T1 and T2 groups were 48.65 ± 2.12, 46.78 ± 3.12 and 47.56 ± 3.81 IU/L, correspondingly. Likewise in trial 2, the recorded values were 46.24 ± 3.11, 44.92 ± 3.02 and 45.18 ± 3.16 IU/L in T0, T1 and T2 groups, respectively. However in study II (trial 1 and 2), the maximum ALT value was observed in T0 (52.76 ± 2.82 and 55.99 ± 3.43 IU/L) than that of T1 (49.20 ± 3.96 and 51.90 ± 3.58 IU/L) and T2 (50. 25 ± 4. 03 and 52. 68 ± 3. 20 IU/L) groups, respectively. In study III (trial 1), recorded ALT values in T0, T1 and T2 groups were 46.55 ± 2.12, 42.21 ± 3.10 and 45.15 ± 2.89 IU/L whereas in subsequent trial 44.02 ± 2.53, 41.18 ± 2.41 and 42.19 ± 3.16 IU/L, respectively (Table 2). In study I (trial 1 and 2), T0 had the highest ALP level 150.68 ± 8.95 and 145.79 ± 9.12 IU/L than that of T1 and T2 groups as 147.58 ± 12.43 and 142.13 ± 11.73 and 148.17 ± 13.22 and 143.56 ± 14.15 IU/L, respectively (Table 2). Similarly, in study II (trial 1), ALP level in T0 was 202.89 ± 14.20 IU/L that varied significantly in T1 and T2 groups as 190.03 ± 15.81 and 195.25 ± 12.63 IU/L, respectively. The subsequent trial also showed a momentous decline from 212. 41 ± 15. 23 IU/L in T0 to 201.63 ± 13.63 and 205.29 ± 13.38 IU/L in T1 and T2, respectively. Similarly in study III (trial 1), maximum ALP level 216.39 ± 16.15 IU/L was reported in T0 that momentously reduced to 206. 50 ± 10.72 IU/L in T1 and 210.22 ± 13.33 IU/L in T2 groups. In the next trial, recorded values for T0, T1 and T2 groups were 220.21 ± 14.12, 208.23 ± 15.87 and 211.06 ± 14.12 IU/L, correspondingly.
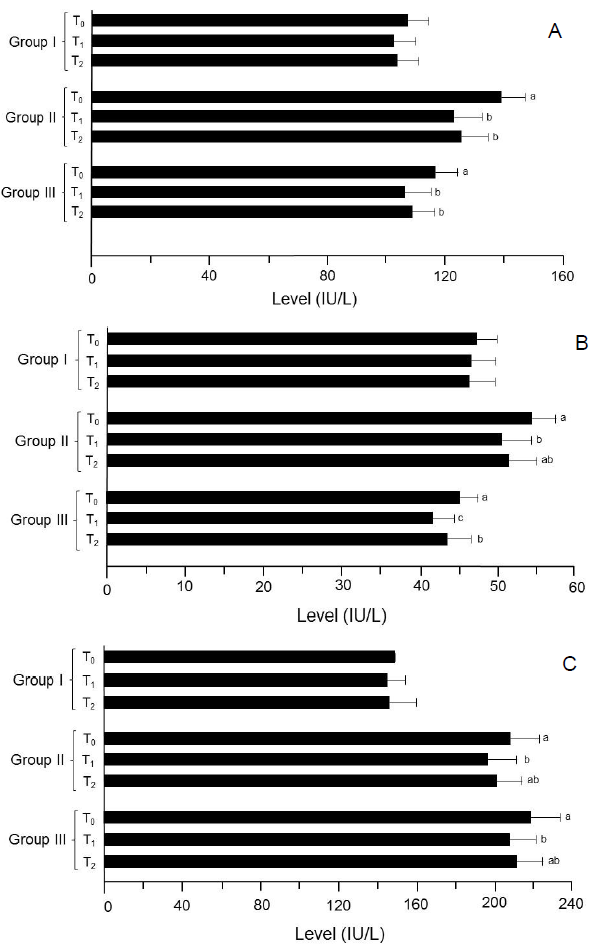
Figure 2: Results of liver functioning tests. (A) AST. (B) ALT. (C) ALP.
Group I: Healthy rats (control),
Group II: Hypercholesterolemic rats,
Group III: Diabetic rats. T0: Normal diet, T1: Normal diet + mango extract, T2: Normal diet + mangiferin. The means carrying same letters in a column do not differ significantly.
Table 2 Effect of functional drinks on liver functioning tests.
| Studies | AST (IU/L) | ALT (IU/L) | ALP (IU/L) | ||||||
|---|---|---|---|---|---|---|---|---|---|
| T0 | T1 | T2 | T0 | T1 | T2 | T0 | T1 | T2 | |
| Study I | |||||||||
| (Trial 1) | 109.05± 6.32 |
103.25± 7.82 |
105.15± 7.72 |
48.65±2.12 | 46.78±3.12 | 47.56±3.81 | 150.68±8.95 | 147.58±12.43 | 148.17±13.22 |
| (Trial 2) | 104.42± 7.43 |
100.62± 7.02 |
101.80± 6.92 |
46.24±3.11 | 44.92±3.02 | 45.18±3.16 | 145.79±9.12 | 142.13±11.73 | 143.56±14.15 |
| Study II | |||||||||
| (Trial 1) | 141.77± 7.62a |
125.19± 9.62b |
128.01± 8.43b |
52.76±2.82a | 49.20±3.96b | 50.25±4.03ab | 202.89±14.20a | 190.03±15.81b | 195.25±12.63ab |
| (Trial 2) | 135.81± 8.23a |
120.20± 9.34b |
122.38± 9.75b |
55.99±3.43a | 51.90±3.58b | 52.68±3.20ab | 212.41±15.23a | 201.63±13.63b | 205.29±13.38ab |
| Study III | |||||||||
| (Trial 1) | 119.27± 8.51a |
110.92± 8.63b |
113.69± 8.12b |
46.55±2.12a | 42.21±3.10c | 45.15±2.89b | 216.39±16.15a | 206.50±10.72b | 210.22±13.33ab |
| (Trial 2) | 113.11± 6.68a |
101.00± 9.55b |
103.50± 7.23b |
44.02±2.53a | 41.18±2.41c | 42.19±3.16b | 220.21±14.12a | 208.23±15.87b | 211.06±14.12ab |
Means carrying same letters in a column do not differ significantly
Study I : Normal diet
Study II : High cholesterol diet
Study III: Diabetic rats
T0 : Control drink (without active ingredients)
T1 : Drink containing mango peel extract
T2 : Drink containing mangiferin
Kidney functioning tests
In study I (trial 1 and 2), the observed values for serum urea level were 19. 98 ± 1.43 and 22.25 ± 1.78, 18.99 ± 0.86 and 21.35 ± 1.12 and 19.25 ± 1.39 and 21.96 ± 0.94 mg/dL in T0, T1 and T2 groups, respectively. However in study II (trial 1), urea level in T0 group was 27.95 ± 1.64 mg/dL that decreased significantly in T1 and T2 as 25. 78 ± 1. 49 and 26. 85 ± 0. 34 mg/dL, respectively. Similar response was noticed in the following trial; the highest value was recorded in T0 as 29. 47 ± 1.98 mg/dL followed by T1 27. 35 ± 1.96 mg/dL and T2 28.64 ± 1.62 mg/dL, respectively. Likewise in study III (trial 1 and 2), a substantial decline was observed from 30. 25 ± 2. 21 and 32. 55 ± 1. 46 mg/dL (T0) to 28.96 ± 1.21 and 30.15 ± 1.91 (T1) during both trials (Table 3) (Figure 3 & 4).
In study I (trial 1 and 2), mean creatinine values in T0, T1 and T2 groups were 0.79 ± 0.04, 0.77 ± 0. 01 and 0.78 ± 0.04 mg/dL whereas 0.81 ± 0.03, 0.79 ± 0.04 and 0.80 ± 0.03 mg/dL for respective trial, correspondingly. Likewise in study II, the values for this trait significantly reduced from 0.85 ± 0.03 to 0.80 ± 0.04 mg/dL and 0.91 ± 0.06 to 0.84 ± 0.01 mg/dL in T0 to TI groups (trial 1 and 2), respectively. In study III, reported creatinine levels were 0.98 ± 0.02, 0.91 ± 0.02 and 0.94 ± 0. 06 mg/dL in T0, T1 and T2 groups. Similar in trial 2, maximum value was noticed in T0 0.96 ± 0.03 mg/dL followed by T2 0.92 ± 0.05 mg/dL and T1 0.90 ± 0.06 mg/dL (Table 3).
Table 3: Effect of functional drinks on serum urea and creatinine (mg/dL).
| Studies | Urea | Creatinine | ||||
|---|---|---|---|---|---|---|
| T0 | T1 | T2 | T0 | T1 | T2 | |
| Study I | ||||||
| (Trial 1) | 19.98 ± 1.43 | 18.99 ± 0.86 | 19.25 ± 1.39 | 0.79 ± 0.04 | 0.77 ± 0.01 | 0.78 ± 0.04 |
| (Trial 2) | 22.25 ± 1.78 | 21.35 ± 1.12 | 21.96 ± 0.94 | 0.81 ± 0.03 | 0.79 ± 0.04 | 0.80 ± 0.03 |
| Study II | ||||||
| (Trial 1) | 27.95 ± 1.64a | 25.78 ± 1.49b | 26.85 ± 0.34ab | 0.85 ± 0.03a | 0.80 ± 0.04b | 0.82 ± 0.05ab |
| (Trial 2) | 29.47 ± 1.98a | 27.35 ± 1.96b | 28.64 ± 1.62ab | 0.91 ± 0.06a | 0.84 ± 0.01b | 0.87 ± 0.04ab |
| Study II | ||||||
| (Trial 1) | 30.25 ± 2.21a | 28.96 ± 1.21b | 29.12 ± 1.93ab | 0.98 ± 0.02a | 0.91 ± 0.02b | 0.94 ± 0.06ab |
| (Trial 2) | 32.55 ± 1.46a | 30.15 ± 1.91b | 31.01 ± 1.62ab | 0.96 ± 0.03a | 0.90 ± 0.06b | 0.92 ± 0.05ab |
Means carrying same letters in a column do not differ significantly
Study I : Normal diet
Study II : High cholesterol diet
Study III: Diabetic rats
T0 : Control drink (without active ingredients)
T1 : Drink containing mango peel extract
T2 : Drink containing mangiferin
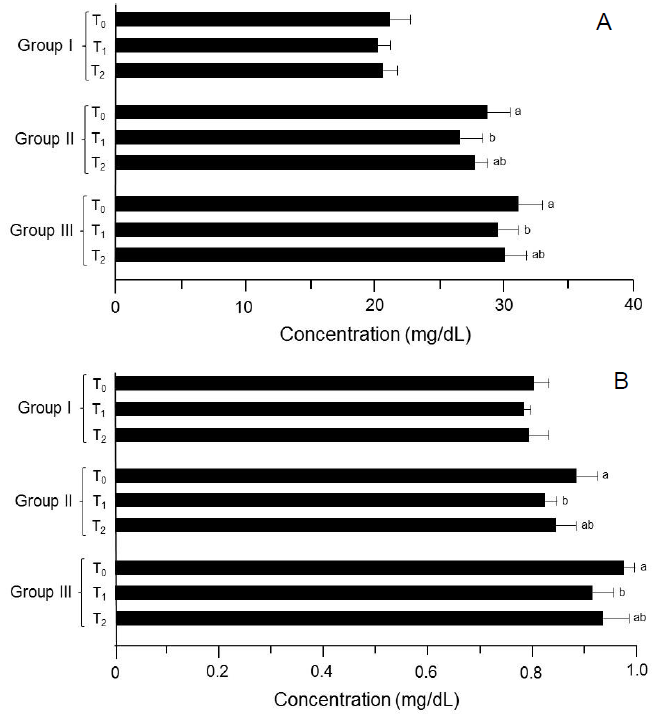
Figure 3: Results of kidney functioning tests. (A) Serum urea. (B) Serum creatinine. Group I: Healthy rats (control), Group II: Hypercholesterolemic rats, Group III: Diabetic rats. T0: Normal diet, T1: Normal diet + mango extract, T2: Normal diet + mangiferin. The means carrying same letters in a column do not differ significantly.
Hematological aspects
Under the disease conditions, the level of red blood cells (RBC) decreases, whereas the white blood cells (WBC) increase due to possible inflammation and undesirable immune responses. The in balance of red blood cells and white blood cells leads to many complications associated with various diseases.
In study I (trial 1 and 2), the mean RBC values for T0, T1 and T2 groups were 6.20 ± 0.29 and 7.01 ± 0.24 cells/pL, 6.45 ± 0.31 and 7.08 ± 0.52 and 6.29 ± 0.12 and 7.06 ± 0.41 cells/pL, respectively (Table 4) (Figure 5). Moreover in study II (trial 1), the minimum RBC concentration was reported in T0 (5.25 ± 0.34 cells/pL) that non-substantially increased in T1 (5.44 ± 0.24 cells/pL) and T2 (5.35 ± 0.33 cells/pL). Likewise pattern was observed in the next trial. Similarly in study III, the RBC values varied non-significantly in T0, T1 and T2 groups as 4.10 ± 0.26 and 5.01 ± 0.32, 4.19 ± 0.19 and 5.25 ± 0.28 and 4.15 ± 0.16 and 5.20 ± 0.13 cells/pL, respectively (trial 1 and 2).
Means regarding Hb in study I (trial 1 and 2) showed the values 12.11 ± 0.12 and 10.89 ± 0.65 g/L for T0 that non-momentously enhanced to 12.25 ± 0.91 and 11.10 ± 0.72 and 12.20 ± 0.41 and 10.94 ± 0. 73 g/L in T1 and T2 groups, respectively. Nevertheless in study II, the lowest hemoglobin value was noticed in T0 (9. 81 ± 0. 64 g/L) that momentously increased in T2 (9.99 ± 0.68 g/L)and T1 (10.85 ± 0.67 g/L) groups (trial 1). Likewise increasing trend was observed during the 2nd trial, the hemoglobin level enhanced from 10. 88 ± 0.52 to 11.96 ± 0.83 g/L in T0 and T1 groups, respectively. In study III, the reported values for this trait in T0 group was 9. 55 ± 0. 69 and8. 64 ± 0. 48 g/L that differed momentously in T1 and T2 groups by 10.44 ± 0.43 and 10.60 ± 0.32 and 9.99 ± 0.48 and 9.95 ± 0.38 g/L, in respective trials (Table 4).
The means in Table 4 (study I; trial 1) showed non-momentous differences in hematocrit level from 45.10 ± 1.12% (T0) to 46.75 ± 3.12% (T1) and 45.91 ± 2.81% (T2). During the next trial, observed values were 46.72 ± 2.51, 47.16 ± 2.43 and 46.96 ± 3.42% for respective groups. However, in study II (trial 1) hematocrit value in T0 was 37.33 ± 1. 12% that significantly enhanced to 40.02 ± 2.92 and 38.05 ± 2.51% in T1 and T2 groups, respectively. In the subsequent trial, similar trend was observed that validates the data. In study III, the hematocrit level noticed as 33. 63 ± 2.31, 35.74 ± 2.71 and 34.75 ± 1.92% (trial 1) and 35.85 ± 1.72, 38.99 ± 1.13 and 36.39 ± 1.81% in T1, T2 and T3 groups, respectively (trial 2).
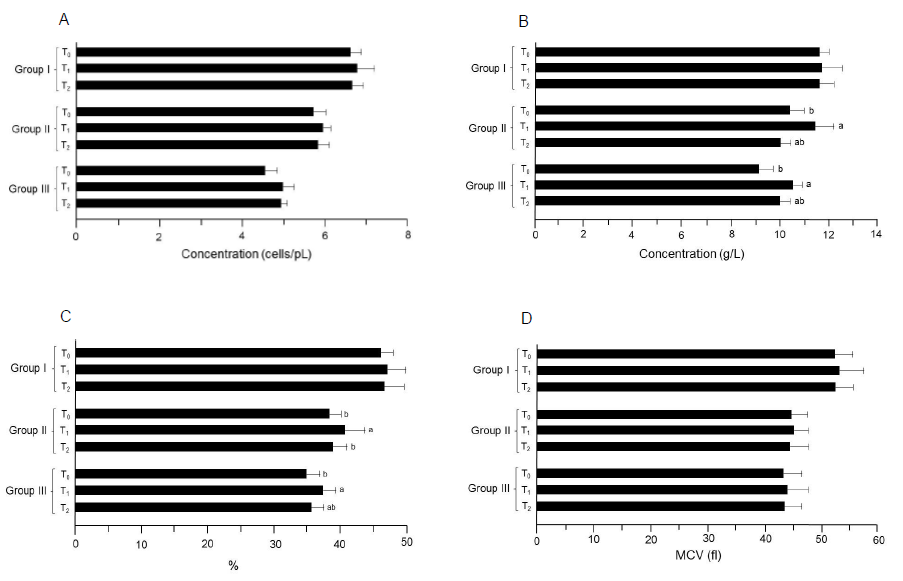
Figure 4: Results of the index determinations for RBC. (A) RBC. (B) Hemoglobin. (C) Hematocrit. (D) MCV. Group I: Healthy rats (control), Group II: Hypercholesterolemic rats, Group III: Diabetic rats. T0: Normal diet, T1: Normal diet + mango extract, T2: Normal diet + mangiferin. The means carrying same letters in a column do not differ significantly.
In study I (trial 1), the mean MCV values were reported as 52.90 ± 3.21, 53.32 ± 4.11 and 52.94 ± 3.10 fL in T0, T1 and T2 groups, respectively. Likewise pattern was observed during trial 2. Moreover in study II (trial 1 and 2), the observed MCV values for T0, T1 and T2 groups were 45.63 ± 2.94 and 43.78 ± 2.76, 46.12 ± 1.62 and 44.26 ± 3.30 and 45.96 ± 3.91 and 43.92 ± 2.76 fL, correspondingly. In study III, the lowest MCV value was 42.96 ± 3.13 in T0 that uplifted non-momentously by 43.68 ± 3.91 and 43.10 ± 3.32 fL in T1 and T2 groups, respectively (trial 1). Likewise pattern was observed in the subsequent trial (Table 4) (Figure 6).
Table 4: Effect of functional drinks on red blood cell indices.
| Studies | RBC (cells/pL) | Hemoglobin(g/L) | ||||
|---|---|---|---|---|---|---|
| T0 | T1 | T2 | T0 | T1 | T2 | |
| Study I | ||||||
| (Trial 1) | 6.20 ± 0.29 | 6.45 ± 0.31 | 6.29 ± 0.12 | 12.11 ± 0.12 | 12.25 ± 0.91 | 12.20 ± 0.41 |
| (Trial 2) | 7.01 ± 0.24 | 7.08 ±0.52 | 7.06 ± 0.41 | 10.89 ± 0.65 | 11.10 ± 0.72 | 10.94 ± 0.73 |
| Study II | ||||||
| (Trial 1) | 5.25 ± 0.34 | 5.44 ± 0.24 | 5.35 ± 0.33 | 9.81 ± 0.64b | 10.85 ± 0.67a | 9.99 ± 0.68ab |
| (Trial 2) | 6.15 ± 0.26 | 6.43 ± 0.12 | 6.30 ± 0.22 | 10.88 ± 0.52b | 11.96 ± 0.83a | 11.01 ± 0.80ab |
| Study III | ||||||
| (Trial 1) | 4.10 ± 0.26 | 4.19 ± 0.19 | 4.15 ± 0.16 | 9.55 ± 0.69b | 10.44 ± 0.43a | 9.99 ± 0.48ab |
| (Trial 2) | 5.01 ± 0.32 | 5.25 ± 0.28 | 5.20 ± 0.13 | 8.64 ± 0.48b | 10.60 ± 0.32a | 9.95 ± 0.38ab |
| Studies | Hematocrit (%) | MCV (fl) | ||||
| T0 | T1 | T2 | T0 | T1 | T2 | |
| Study I | ||||||
| (Trial 1) | 45.10 ± 1.12 | 46.75 ± 3.12 | 45.91 ± 2.81 | 52.90 ±3.21 | 53.32 ±4.11 | 52.94 ± 3.10 |
| (Trial 2) | 46.72 ± 2.51 | 47.16 ± 2.43 | 46.96 ± 3.42 | 51.99 ± 3.52 | 53.01 ± 4.53 | 52.29 ± 3.64 |
| Study II | ||||||
| (Trial 1) | 37.33 ± 1.12b | 40.02 ± 2.92a | 38.05 ±2.51b | 45.63 ± 2.94 | 46.12 ± 1.62 | 45.96 ± 3.91 |
| (Trial 2) | 38.98 ± 2.43b | 41.12 ± 3.01a | 39.50 ± 1.83b | 43.78 ± 2.76 | 44.26 ± 3.30 | 43.92 ± 2.76 |
| Study III | ||||||
| (Trial 1) | 33.63 ± 2.31b | 35.74 ± 2.71a | 34.75 ± 1.92ab | 42.96 ± 3.13 | 43.68 ± 3.91 | 43.10 ± 3.32 |
| (Trial 2) | 35.85 ± 1.72b | 38.99 ± 1.13a | 36.39 ± 1.81ab | 43.90 ± 3.52 | 44.42 ±3.44 | 43.99 ± 2.86 |
Means carrying same letters in a column do not differ significantly
Study I : Normal diet
Study II : High cholesterol diet
Study III: Diabetic rats
T0 : Control drink (without active ingredients)
T1 : Drink containing mango peel extract
T2 : Drink containing mangiferin
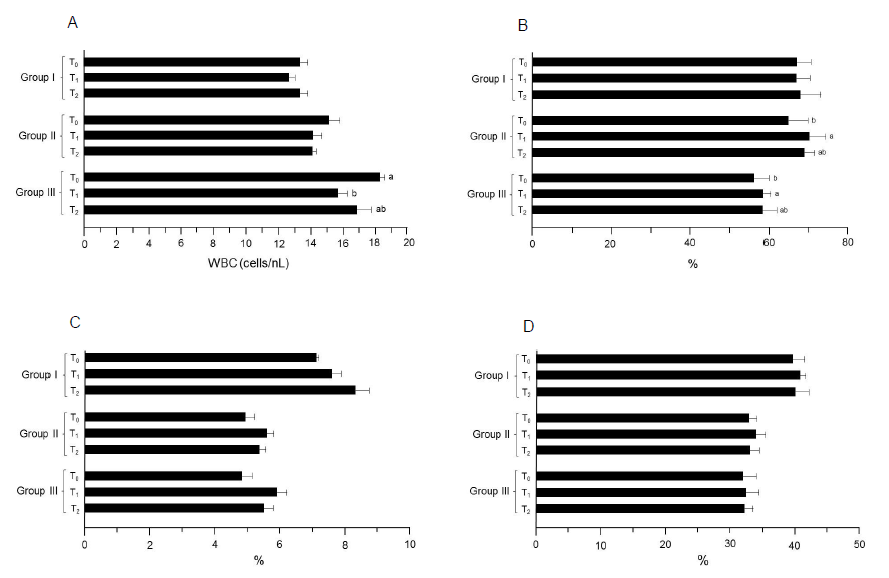
Figure 5: Results of the index determinations for WBC. (A) WBC. (B) Neutrophils. (C) Monocytes. (D) Lymphocytes. Group I: Healthy rats (control), Group II: Hypercholesterolemic rats, Group III: Diabetic rats. T0: Normal diet, T1: Normal diet + mango extract, T2: Normal diet + mangiferin. The means carrying same letters in a column do not differ significantly.
In study I, mean WBC values were recorded as 13.71 ± 0.18, 12.96 ± 0.64 and 13.29 ± 0.63 cells/nL in T0, T1 and T2 groups, respectively. Likewise trend was observed in the trial 2. Similarly, the highest value (study II, trial 1) was noticed in T0 (15.47 ± 0.66 cells/nL) that non-momentously reduced in T2 (15.02 ± 0.32 cells/nL) and T1 (14. 96 ± 0.32 cells/nL), respectively. The T0 group in trial 2 showed maximum WBC value (14.74 ± 0.87 cells/nL) followed by T2 (14.12 ± 0.13 cells/nL) and T1 (13.25 ± 0.82 cells/nL). During study III (trial 1 and 2), the WBC values varied non-significantly in T0, T1 and T2 groups as 17.51 ± 0.43 and 19.00 ± 0.19, 14.23 ± 0.48 and 17.12 ± 0.65 and 15.25 ± 0.97 and 18. 46 ± 0.85 cells/nL, respectively (Table 5). In this case (trial 1), mean neutrophils values for T0, T1 and T2 groups were 72.23 ± 3.86, 74.20 ± 4.82 and 73.56 ± 5.63%, correspondingly. Likewise, the lowest value was reported in T0 (61.32 ± 3. 47%) that non-substantially increased to 62.25 ± 4.67 and 63.08 ± 3.04% in T2 and T1, respectively (trial 2). During study II, the T0 group had the minimum value for this trait as 62.25 ± 5.32% that significantly increased in T2 67.56 ± 3.61% and T1 68.23 ± 2. 81%. Similarly, mean values (trial 2) for T0, T1 and T2 groups were 67.23 ± 4.46, 72.12 ± 3.46 and 70.32 ± 1.47%, respectively. Moreover, neutrophils level for T0 group in study III was 55. 36 ± 4. 63% that enhanced non-momentously in T2 and T1 groups by 57.25 ± 3.47 and 59.15 ± 2.09%, respectively (trial 1). Likewise, the observed values for T0, T1 and T2 groups were 57.22 ± 2.46, 60.30 ± 1.49 and 59.81 ± 2.96% in respective trial, correspondingly (Table 5).
Table 5: Effect of functional drinks on white blood cell indices.
| Studies | WBC(cells/nL) | Neutrophils (%) | ||||
|---|---|---|---|---|---|---|
| T0 | T1 | T2 | T0 | T1 | T2 | |
| Study I | ||||||
| (Trial 1) | 13.71 ± 0.18 | 12.96 ± 0.64 | 13.29 ± 0.63 | 72.23 ± 3.86 | 74.20 ± 4.82 | 73.56 ± 5.63 |
| (Trial 2) | 12.96 ± 0.72 | 12.30 ± 0.12 | 12.50 ± 0.27 | 61.32 ± 3.47 | 63.08 ± 3.04 | 62.25 ± 4.67 |
| Study II | ||||||
| (Trial 1) | 15.47 ± 0.66 | 14.96 ± 0.32 | 15.02 ± 0.32 | 62.25 ± 5.32b | 68.23 ± 2.81a | 67.56 ± 3.61ab |
| (Trial 2) | 14.74 ± 0.87 | 13.25 ± 0.82 | 14.12 ± 0.13 | 67.23 ± 4.46b | 72.12 ± 3.46a | 70.32 ± 1.47ab |
| Study II | ||||||
| (Trial 1) | 17.51 ± 0.43a | 14.23 ± 0.48b | 15.25 ± 0.97ab | 55.36 ± 4.63b | 59.15 ± 2.09a | 57.25 ± 3.47ab |
| (Trial 2) | 19.00 ± 0.19a | 17.12 ± 0.65b | 18.46 ± 0.85ab | 57.22 ± 2.46b | 60.30 ± 1.49a | 59.81 ± 2.96ab |
| Studies | Monocytes (%) | Lymphocytes (%) | ||||
| T0 | T1 | T2 | T0 | T1 | T2 | |
| Study I | ||||||
| (Trial 1) | 7.70 ± 0.12 | 8.10 ± 0.22 | 7.80 ± 0.43 | 38.26 ± 1.96 | 39.20 ± 0.63 | 38.75 ± 2.12 |
| (Trial 2) | 6.48 ± 0.05 | 7.01 ± 0.37 | 8.78 ± 0.52 | 40.99 ± 1.74 | 42.06 ± 1.25 | 41.03 ± 01.98 |
| Study II | ||||||
| (Trial 1) | 5.70 ± 0.21 | 6.14 ± 0.10 | 5.91 ± 0.32 | 34.55 ± 1.13 | 35.05 ± 1.47 | 34.73 ± 1.30 |
| (Trial 2) | 4.10 ± 0.37 | 5.01 ± 0.31 | 4.78 ± 0.23 | 30.90 ± 1.34 | 32.42 ± 1.69 | 31.01 ± 1.59 |
| Study III | ||||||
| (Trial 1) | 4.15 ± 0.26 | 5.45 ± 0.42 | 4.96 ± 0.24 | 32.96 ± 2.59 | 33.36 ± 1.90 | 33.03 ± 1.56 |
| (Trial 2) | 5.45 ± 0.36 | 6.32 ± 0.18 | 5.96 ± 0.41 | 30.61 ± 1.54 | 31.13 ± 2.08 | 30.99 ± 1.03 |
Means carrying same letters in a column do not differ significantly
Study I : Normal diet;
Study II : High cholesterol diet;
Study III: Diabetic rats;
T0 : Control drink (without active ingredients);
T1 : Drink containingmango peel extract;
T2 : Drink containing mangiferin
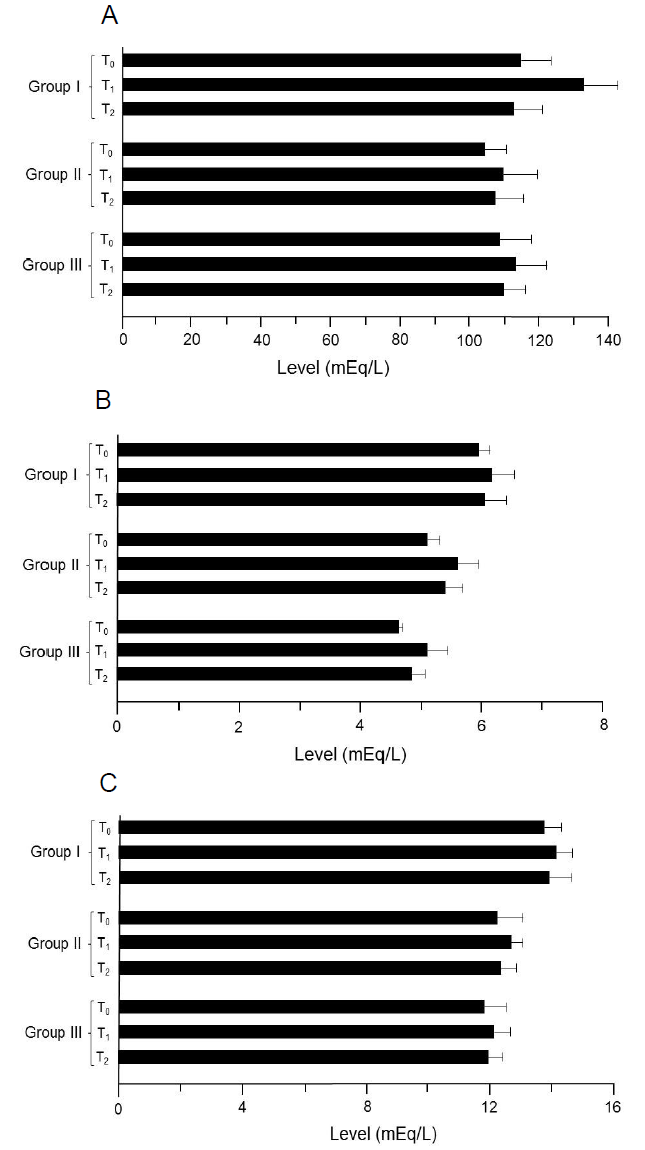
Figure 6: Results of the electrolytes analysis. (A) Na. (B) K. (C) Ca. Group I: Healthy rats (control), Group II: Hypercholesterolemic rats, Group III: Diabetic rats. T0: Normal diet, T1: Normal diet + mango extract, T2: Normal diet + mangiferin. The means carrying same letters in a column do not differ significantly.
Monocytes
During study I (trial 1), the monocytes values in T0, T1 and T2 were 7.70 ± 0.12, 8.10 ± 0.22 and 7.80 ± 0.43%, respectively. Similar pattern was observed during the next trial. Similarly in study II (trial 1), T0 had the lowest value as 5.70 ± 0.21% than that of T1 6.14 ± 0.10% and T2 5.91 ± 0.32%, whereas during the 2nd trial, levels for this trait were 4.10 ± 0.37, 5.01 ± 0.31 and 4.78 ± 0. 23%. In study III (trial 1 and 2), the recorded monocytes level in T0 group was 4.15 ± 0.26 and 5.45 ± 0.36% that non-significantly uplifted in T2 4.96 ± 0.24 and 5.96 ± 0.41% and T1 5.45 ± 0.42 and 6.32 ± 0.18%, respectively (Table 5).
In the initial study, the reported lymphocytes for T0 group were 38.26 ± 1. 96% that non-substantially inclined in T2 38.75 ± 2. 12% and T1 39.20 ± 0.63%. Likewise, non-momentous increase was noted in trial 2 for T0, T1 and T2 groups as 40.99 ± 1.74, 42.06 ± 1.25 and 41.03 ± 1. 98%, correspondingly. Moreover in study II, a non-significant uplift in lymphocytes level was reported; T1 (35.05 ± 1.47 and 32.42 ± 1.69%) and T2 (34.73 ± 1.30 and 31.01 ± 1.59%) as compared to group T0 (34.55 ± 1.13 and 30.90 ± 1.34%), respectively. In study III (trial 1 and 2), the noticed differences in lymphocytes were 32. 96 ± 2.59 and 30.61 ± 1.54, 33.36 ± 1.90 and 31.13 ± 2.08 and 33.03 ± 1.56 and 30.99 ± 1. 03% in T0, T1 and T2 groups, respectively (Table 5).
lectrolytes balance
During study I (trial 1 and 2), mean values for sodium in T0, T1 and T2 were 110.23 ± 8.69 and 112.63 ± 8.87, 112.25 ± 10.03 and 114.21 ± 9.64 and 111.12 ± 7.71 and 113.26 ± 8.64 mEq/L, respectively (Table 6). Moreover in study II (trial 1 and 2), the values for sodium were 103.26 ± 9.42 and 105.25 ± 8.63, 107.23 ± 9.25 and 111.63 ± 10.36 and 104.65 ± 8.87 and 109.31 ± 7.42 mEq/L in T0, T1 and T2, respectively. Similarly in study III, noticed values in T0, T1 and T2 groups were 107.12 ± 9.45 and 109.23 ± 8.56, 112.25 ± 8.60 and 113.36 ± 9.36 and 109.36 ± 7.64 and 110.12 ± 6.32 mEq/L, respectively (trial 1 and 2). In study I, mean potassium values (Table 6) were 5.91 ± 0.12 and 6.01 ± 0.21, 6.06 ± 0.32 and 6.26 ± 0.41 and 6.01 ± 0.43 and 6.09 ± 0.30 mEq/L in T0, T1 and T2 groups, respectively (trial 1 and 2). Similarly, lowest potassium level (4.50 ± 0.16 and 5.71 ± 0.24 mEq/L) was recorded in T0 that uplifted non-momentously in T1 (5. 15 ± 0. 32 and 6. 02 ± 0. 35 mEq/L) and T2 (4.80 ± 0.22 and 5.99 ± 0.34 mEq/L), respectively (study II; trial 1 and 2). Likewise during study III (trial 1 and 2), highest values were noticed in T1 (5.85 ± 0.39 and 4.35 ± 0.26 mEq/L) followed by T2 (5.45 ± 0.19 and 4.25 ± 0.23 mEq/L) and T0 (5.10 ± 0.10 and 4.13 ± 0.02 mEq/L). Mean calcium levels in study I were 12.41 ± 0.56 and 14.99 ± 0.54 mEq/L (T0), 13.01 ± 0.62 and 15.21 ± 0.35 mEq/L (T1) and 12.65 ± 0.75 and 15.04 ± 0.66 mEq/L (T2), respectively (trial 1 and 2). Likewise in study II (trial 1), mean values in T0, T1, and T2 groups were 11.88 ± 0.96, 12 25 ± 0.31 and 12.01 ± 0.36 mEq/L whilst in 2nd trial 12.46 ± 0.74, 13.01 ± 0.43 and 12.59 ± 0.62 mEq/L, respectively. Similarly, calcium concentrations in study III were 10.77 ± 0.62, 11.01 ± 0.60 and 10.85 ± 0.42 mEq/L in T0, T1 and T2 groups, respectively (trial 1). Likewise pattern was observed in trial 2 (Table 6).
Table 6: Effect of functional drinks on electrolytes balance.
| Studies | Sodium (Na) mEq/L | Potassium (K) mEq/L | Calcium (Ca) mEq/L | ||||||
|---|---|---|---|---|---|---|---|---|---|
| T0 | T1 | T2 | T0 | T1 | T2 | T0 | T1 | T2 | |
| Study I | |||||||||
| (Trial 1) | 110.23±8.69 | 112.25 ±10.03 | 111.12 ± 7.71 | 5.91 ± 0.12 | 6.06 ± 0.32 | 6.01 ± 0.43 | 12.41 ± 0.56 | 13.01 ± 0.62 | 12.65 ± 0.75 |
| (Trial 2) | 112.63±8.87 | 114.21 ± 9.64 | 113.26 ± 8.64 | 6.01 ± 0.21 | 6.26 ± 0.41 | 6.09 ± 0.30 | 14.99 ± 0.54 | 15.21 ± 0.35 | 15.04 ± 0.66 |
| Study II | |||||||||
| (Trial 1) | 103.26±9.42 | 107.23 ± 9.25 | 104.65 ± 8.87 | 4.50 ± 0.16 | 5.15 ± 0.32 | 4.80 ± 0.22 | 11.88 ± 0.96 | 12.25 ± 0.31 | 12.01 ± 0.36 |
| (Trial 2) | 105.25±8.63 | 111.63 ± 10.36 | 109.31 ± 7.42 | 5.71 ± 0.24 | 6.02 ± 0.35 | 5.99 ± 0.34 | 12.46 ± 0.74 | 13.01 ± 0.43 | 12.59 ± 0.62 |
| Study III | |||||||||
| (Trial 1) | 107.12±9.45 | 112.25 ± 8.60 | 109.36 ± 7.64 | 5.10 ± 0.10 | 5.85 ± 0.39 | 5.45 ± 0.19 | 10.77 ± 0.62 | 11.01 ± 0.60 | 10.85 ± 0.42 |
| (Trial 2) | 109.23±8.56 | 113.36 ± 9.36 | 110.12 ± 6.32 | 4.13 ± 0.02 | 4.35 ± 0.26 | 4.25 ± 0.23 | 12.79 ± 0.76 | 13.12 ± 0.45 | 13.01 ± 0.53 |
Study I : Normal diet; Study II : High cholesterol diet; Study III: Diabetic rats;
T0 : Control drink (without active ingredients); T1 : Drink containing mango peel extract; T2 : Drink containing mangiferin
Discussion
The AST, ALT and ALP are the sensitive indicators for the diagnosis of diseases associated with liver damages such as hepatitis and cirrhosis. Various studies have reported that lipid-rich diets tend to enhance the levels of AST, ALP and by the action of reactive oxygen species (ROSs), which react with polyunsaturated fatty acids in membrane[19]. Therefore, antioxidant polyphenols, such as mangiferin, are known to prevent the elevation of ALT, AST and ALP levels[20,21]. One study reported that magniferin suppressed the abnormally high levels of AST, ALT and ALP in hypercholestrolemic and hyperglycemic rats[22]. The reduction of AST, ALT and ALP levels by mangiferin in the present study is consistent with the previous reports[23,24]. These activities by mango peel extract and mangiferin can be proposed to due to their antioxidant nature. Previous study demonstrated that the supplementation of mangiferin significantly reduced the abnormally high concentrations of liver enzymes. These effects were proposed that strong anti-oxidative properties of mango peel polyphenols were responsible to inhibit lipid per-oxidation thereby alleviate abnormal enzyme concentrations[25,26]. The results from the present study also demonstrated that both mango peel extract and mangiferin are effective to modulate the levels of liver enzymes including AST, ALT and ALP.
In the rats with a disease, such as hypercholestrolemic or diabetic, their kidneys ability to remove metabolic wastes, including urea and creatinine, is suppressed and subsequently the metabolic wastes levels increase. The lowering ability of urea and creatinine levels by mango peel extract was previously reported[27] and the results of the present study are consistent with that report. Also, another study reported that mango polyphenols decreased the levels of urea and creatinine in GM-induced renal injury rats because of their anti-oxidative and anti-inflammatory activities[28,29]. In addition, effects of mango peel extract and mangiferin against the levels of serum urea and creatinine have been reported in diabetic and hypercholesterolemicrats[30,31]. The results obtained in the present study are consistent with the results from these studies.
Erythrocytes and allied membranes have a high ratio of polyunsaturated fatty acids to the total lipids, indicating the susceptibility of lipid per-oxidation. Moreover, RBCs are highly prone to lipid per-oxidation due to constant exposure to oxygen and pro-oxidants (Pawlak et al., 1998). During hypercholesterolemic and hyperglycemic phases, irregularities in both white and red blood cells indices are observed by different scientists. They inferred that elevation in microvescicles production, formation of excessive toxins and membrane oxidations are the key factors in this regard (Kumar, 2000; Hoffman et al. , 2004; Madjid et al. , 2004).
The findings of different scientists including Muruganandan et al. (2005); Muruganandan et al. (2002) and Kemasari et al. (2011) delineated that mango peel polyphenols impart positive impact on red blood cells, hemoglobin, hematocrit and MCV levels of experimental rats due to their membrane protective and antioxidant perspectives.
The maintaining electrolyte balance is important to keep the vital functions of a kidney[32]. In addition, electrolytes perform numerous life sustaining processes, such as homeostasis maintenance, ensures proper acid base ratio and oxygen balance. On the other hand, their imbalance is resulting oxidative stress and kidney malfunctioning[33]. There are strong evidences that mango peel polyphenols modulate electrolytes balance by managing the activity of glands involved in sodium and potassium secretions[34,35]. The mango peel polyphenols, especially mangiferin, also reportedly improved electrolyte balance[36].
Conclusion
The results of the present study demonstrated that mango peel extract and its’ major polyphenol components, mangiferin have considerable effects to disease rats, in particular hypercholesterolemic and diabetic rats. Mango peel extract and mangiferin possess potent antioxidant activity which prevents various diseases. In addition, these substances were proved to recover the levels of various secretions from disease rats, suggesting that they hold nutraceutical potential. Mango peel containing mangiferin can be used for the development of functional foods and beverages.
Acknowledge:
The current research project was conducted in part in the National Institute of Food Science and Technology (NIFSAT), University of Agriculture, Faisalabad.
Conflict of interest:
The author asserts that there is no conflict of interest.
References
- 1. Adedara, I.A., Ojuade, T.J. et al. Taurineameliorates renal oxidative damage and thyroid dysfunction in rats chronically reposed to fluoride. (2017) Bio Trace Elem Res. 175(2): 388-395.
Pubmed - 2. Boggs, D.R., Winkelstein, A. White Cell Manual. (1983) Philadelphia.
- 3. Gammella, E.,Recalcati, S., Cairo, G. Dual role of ROS as signal and stress agents: Iron tips the balance in favor of toxic effects. (2016) Oxid Med Cell Longev 9.
- 4. Butt, M.S., Sultan, M.T. Green Tea: Nature's Defense against malignancies. (2009) Crit Rev Food Sci Nutr 495(5): 463–73.
Pubmed || Crossref - 5. Del Rio, L.A., Lopez-Huertas, E. ROS Generation in peroxisomes and its role in cell signaling. (2014) Plant Cell Phys siol 57(7): 1364
Pubmed || Crossref - 6. Koppula, S., Kumar, H., More, S.V., et al. Recent advances on the Neuroprotective potential of antioxidants in experimental models of Parkinson's disease. (2012) Int J Mol Sci 13(8): 10608–10629.
Pubmed || Crossref - 7. Li, A.N., Li, S., Zhang, Y.J., et al. Resources and biological activities of natural polyphenol. (2014) Nutri 6(12): 6020–6047.
Pubmed || Crossref - 8. Selles, A.J., Villa, D.G.,Rastrelli, L. Mango polyphenols and its protective effects on diseases associated to oxidative stress. (2015) Curr Pharma Biotechnol 16(3): 272–280.
Pubmed || Crossref - 9. Khurana, R.K., Kaur, R. et al. Mangiferin: A Promisinganticancer bioactive. (2016) pharma 5: 169–181.
- 10. Imran, M., Butt, M.S., Akhtar, S. et al. Quantification of Mangiferin by high pressure liquid chromatography, physicochemical and sensory evaluation of functional Mangiferin drink. (2015) J Food Pro Prese 40(4): 760–769.
Crossref - 11. About National Mango Database. (2016)
Crossref - 12. Muruganandan, S.S., Gupta, M., Kataria, J. et al. Mangiferinprotects the streptozotocin-induced oxidative damage to cardiac and renal tissues in rats. (2002) Toxicol 176(3): 165–173
Crossref - 13. Nutrient Requirements of Laboratory Animals IV Ed. (1995) National Aca.
- 14. Thomas, L. Clinical laboratory diagnostics. (1998) Verlags Gesells Chaft 1527.
- 15. Jacobs, D.S., De Mott, W.R., Grady, H.J. et al. Laboratory test handbook 4th Ed. (1996) Lexi-comp.
- 16. Hillman, R.S., Finch, C.A. Red Cell Manual. 5thEd. (1985) Philadelphia.
- 17. Thompson, A.R., Harker, L.A. Manual of Hemostasis and Thrombosis. 3rded. (1983) Philadelphia.
- 18. Al Haj, M., Kazzam, E., Nagelkerke, N.J., etal. Effect of dehydration in the presence and absence of the angiotensin receptor blocker losartan on blood constituents in the camel. (2011) J Med Sci 4: 73−78.
- 19. Steel, R.G.D., Torrie, J.H., Dickey, D. Principles and Procedures of Statistics: A Biometrical Approach 3rd Ed. (1997) McGraw Hill Book.
- 20. Yadav, N.P., Dixit, V.K. Hepatoprotective activity of leaves of Kalanchoe pinnata Pers. (2003) J Ethno pharma 86(2-3): 197−202.
Crossref - 21. Ojewole, J. A. Anti-inflammatory analgesic and hypoglycemic effects of Mangifera indica Linn. (Anacardiaceae) stem-bark aqueous extract. (2005) Methods Find Exp Clin Pharmacol 27(8): 547–554.
Pubmed || Crossref - 22. Izunya, A.M., Nwaopara, A.O., Aigbiremolen, A. et al. Morphological and biochemical effects of crude aqueous extract of Mangiferaindica L. mango stem bark on the liver in Wistar rats. (2010) Research J Appl Sci Eng Tech 25: 460–465.
- 23. Imran, M.,Sayed, M.M.R., Sayed, D.A. Biochemical changes in experimental diabetes before and after treatment with MangiferaIndica and Psidiumguavaextracts. (2011) I J Pharma Bio Sci 22: 29–41.
- 24. Rawi, S.M. Studies of the ability of sulfur containing compounds to block diabetogeniceffect of alloxan in Albino rats. (1995) Proc Zoo Soci 26: 244–259.
- 25. Sheela, C.G.,Augusti, K.T. Antidiabetic effects of S. allyl cysteine sulfoxide from garlic (Allium sativum) Linn. (1992) Indian J Exp Bio 30(6): 523–526.
Pubmed - 26. Rashad, M.M., Moharib, S.A. Studies of the effect of some plant leaf fibers on the key liver enzymes intermediate carbohydrate and lipid metabolism in rats. (2008) Advan Food Science 1: 1–8.
Others - 27. Hassan, S.W., Lawal, M., Muhammed, B.V., et al. Effects of anthrax quinine glycosides and aqueous ethanol extracts of FicussycomorusL. Moraceae on rat liver and kidney functions. (2007) J Biochem 22: 136–141.
- 28. Bibu, K.J.A.D., Mercey, K.A. Therapeutic effect of ethanolic extract of Hygrophila spinosa T. Anders on gentamicin-induced nephrotoxicity in rats. (2010) Indian J Exp Biol 48(9): 911–917.
Pubmed || Othres - 29. https://www.researchgate.net/publication/51064062_Therapeutic_effect_of_ethanolic_extract_of_Hygrophila_spinosa_T_Anders_on_gentamicin-induced_nephrotoxicity_in_rats
Pubmed || Crossref - 30. Yaman, I., Balikci, E. Protective effects of nigella sativa against gentamicin-induced nephrotoxicity in rats. (2010) Exp Tox Path 62(2): 183−190.
Pubmed || Crossref || Others - 31. Kemasari, P., Sangeetha, S., Venkatalakshmi, P. Anti-hyperglycemic activity of Mangiferaindica L. in alloxaninduceddiabetic rats. (2011) J Chem Pharma Res 3(5): 653–659.
Others - 32. Hoffman, M., Blum, A., Baruch, R., et al. Leukocytes and coronary heart disease. (2004) Ather 172(1): 1–6.
Crossref - 33. Atherton, J.C. Regulation of fluid and electrolyte balance by the kidney. (2006) Anes Inten Care Med 7(7): 227–233.
Crossref - 34. Paudel, B.H., Kramar, S. Effect of water and saline load on urinary output in healthy undergraduate medical students. (2003) J Nepal med Ass 42(145): 23–26.
Crossref - 35. Toda, M., Okubo, S., Ikegai, H. et al. The protective activity of tea against infection by vibrio cholera. (1991) J Appl Bacteriol 70(2): 109−112.
Pubmed || Crossref - 36. Mulder, T.P., van Platerink, C.J., Schuyl, P.J.W. et al. Analysis of theaflavins in biological fluids using liquid chromatography-Electrospray Mass spectrometry. (2001) J Chroma Biomed Sci App 760(2): 271–279.
Crossref || Others


