
Evaluation of Liver and Spleen Transient Elastography in the Diagnosis of Esophageal Varices
Eman Ahmed Rewisha , Ayman Alsebaey , ElSayedShaaban Tharwa , Mohamed Amin Elmazaly , Hanaa Mostafa Badran , Nermine Ahmed Ehsan
Affiliation
- 1Department of Hepatology, National Liver Institute, Menoufia University, Shebeen El-Kom, Egypt
- 2Department of Pathology, National Liver Institute, Menoufia University, Shebeen El-Kom, Egypt
Corresponding Author
Maha Mohammad Esabaawy, National Liver Institute, Menoufia University, Shebeen El-Kom, Egypt-32511, Tel: +201283048889; Fax number: +20482222743; E-mail: maha.ahmed@liver.menofia.edu.eg
Citation
Rewisha E.A., et al. Evaluation of Liver and Spleen Transient Elastography in the Diagnosis of Esophageal Varices. (2016) J Gastrointest Disord Liver Func 2(2): 78- 83.
Copy rights
© 2016 Rewisha E.A. This is an Open access article distributed under the terms of Creative Commons Attribution 4.0 International License.
Keywords
Liver; Spleen; Esophageal varices; FibroScanTM; Chronic hepatitis-C
Abstract
Background: Portal hypertension with subsequent esophageal varices (EVs) development is a common complication of HCV related cirrhosis.
Aim: To evaluate the rule of liver stiffness measurement (LSM), spleen stiffness measurement (SSM) and their combination (CLSM) using FibroScan™ in diagnosis of EVs
Methods: One hundred sixty five HCV related F3-F4 Metavir score fibrosis were included. Liver, renal function tests, CBC, INR and abdominal ultrasonography were done before the FibroScan™. Transient elastography measurement was done using FibroScan™ in the supine position after 6 - 8 hours fasting followed by diagnostic esophagogastroscopy. Varices were classified into none (n = 110), small (n = 30) and large (n = 25).
Results: Patients with varices had higher serum bilirubin (1.68 ± 0.82 vs. 1.00 ± 0.55 mg/dL) and lower platelet count (105.09 ± 31.34 vs. 161.21 ± 52.97 × 10³/μL) that patients without varices (p = 0.001). The patients with varices had statistically significant (p = 0.001) higher platelets spleen ratio (671.14 ± 258.89 vs 1215.41 ± 445.58), LSM (31.93 ± 13.29 vs. 17.55 ± 6.53 kPa), SSM (62.85 ± 12.71 vs. 36.94 ± 8.83 kPa) and CLSS (94.78 ± 20.98 vs. 54.49 ± 12.84 kPa) than patients without varices. In patients with small and large varices LSM was comparable (30.84 ± 12.69 vs. 33.64 ± 13.97 kPa; p = 0.391) but a statistically significant difference was detected with SSM (59.92 ± 13.47 vs. 66.98 ± 8.67 kPa; p = 0.031) and CLSS (90.76 ± 21.76 vs. 100.62 ± 19.00 kPa; p = 0.043). With a cutoff of 20.4 kPa LSM (81.0% sensitivity, 71.8% specificity, 52.3% PPV, 90.8% NPV, 74.3% accuracy), 43.2 kPa SSM (92.9% sensitivity, 84% specificity, 69.6% PPV, 96.9% NPV, 86.8% accuracy) and 59.3 kPa CLSS (95.2% sensitivity, 70% specificity, 54.8% PPV, 97.5% NPV, 76.9% accuracy) esophageal varices can be detected.
Conclusion: The measurement of liver, spleen stiffness by FibroScanTM or their combinations are useful for esophageal varices diagnosis.
Introduction
Millions of people all over the world are chronically infected with HCV[1] which is more prevalent in Egypt[2,3]. Chronic hepatitis C (CHC) infection is a leading cause of liver fibrosis in which the normal liver architecture is replaced with fibrous tissue[4]. The ultimate effect is the development of liver cirrhosis and portal hypertension[5,6].
Portal hypertension (PH) is attributed to increased intrahepatic resistance, vasoconstriction, endothelial dysfunction and splanchnic vasodilatation[7]. The hepatic venous pressure gradient (HVPG) measurement is accurate measurement of PH and assessment of the pharmacological treatment. It is invasive maneuver that may be complicated with local injuries, arrhythmias, intra-peritoneal bleeding, besides it is not available all centers[8,9].
Esophageal varices (EVs) are common consequence of portal hypertension. It is detected in 30 - 40% of the compensated patients, 60% of the decompensated patients with 5 - 10% annual incidence of the new varices[10]. Once the EVs developed, they varices increase in size from small to large with progression rate of 10 - 20% before they eventually rupture and bleed[10,11]. Upper gastrointestinal endoscopy is the golden standard for varices detection and decision of treatment, but it is invasive and costly in some countries[12,13]. So, non-invasive diagnosis of portal hypertension and EVs is needed[13]
Transient elastography (TE) measurement by Fibro-Scan™ is a non-invasive diagnostic tool of liver fibrosis. It is characterized by being simple, quick and examines a volume 100 times bigger than a biopsy sample[14]. Splenomegaly is a common clinical complication of portal hypertension. It is ascribed to passive congestion, tissue hyperplasia, fibrogenesis, and hyperactivation of the lymphoid compartment[15,16].
This study aimed to evaluate the role of liver stiffness measurement (LSM), spleen stiffness measurement (SSM) and their combination (CLSM) using FibroScan™ in assessment of esophageal varices in CHC patients.
Materials and Methods
After institutional review board approval, this study was conducted in National Liver Institute hospitals, Menoufia University, Egypt. An informed consent was obtained from all enrolled patients and the control persons.
Firstly 420 treatment naïve Chronic hepatitis C patients were assessed. All underwent through history taking, complete physical examination, body weight, height, liver function tests, renal function tests, CBC, INR, IHA of Schistosomiasis and serum HCV RNA count by PCR. Abdominal ultrasonography was done before the FibroScan™ and the liver biopsy. Stress was on portal vein diameter (PVD) and splenic vein diameter (SVD).
Patients with dual or other related liver diseases e.g. HBV or alcohol were excluded. Furthermore patients with decompensated liver cirrhosis e.g. ascites, encephalopathy, clinical jaundice or hepatocellular carcinoma were excluded.
All the patients underwent liver biopsy unless contraindicated[1]. Fibrosis stage was assessed by Metavir score[3]. Two blinded pathologists read the slides (N and D) to avoid inter-observer variation. Diagnosis of cirrhosis was based on clinical, laboratory, and ultrasonographic findings[17].
Transient elastography (TE) measurement was done using FibroScan™ (Echosens, Paris, France)[2,4]. The liver stiffness measurement (LSM) and spleen stiffness measurement (SSM) were recorded in the supine position after 6 - 8 hours fasting. It was done on the same day before the liver biopsy.
Success rate was calculated as the number of valid measurements divided by the total number of measurements. Results were expressed as kilopascals (kPa). The interquartile range (IQR) was defined as an index of intrinsic variability of LSM or SSM corresponding to the interval of LSM or SSM results containing 50% of the valid measurements between the 25th and 75th percentiles. The median value was considered representative of the elastic modulus of the liver or the spleen. Only procedures with at least 10 valid measurements, a success rate of at least 60%, and an IQR-to-median ratio < 30% were considered reliable[2,4].
Upper esophagogastroscopy by the same endoscopist (A) was done for patients with significant fibrosis (F3-F4 Metavir score) or clinical cirrhosis to screen for esophageal varices. Esophageal varices were classified into small and large varices[18].
About 165 patients with significant fibrosis underwent endoscopy; 110 patients had no varices and 55 had varices (30 small esophageal, 25 large esophageal and 3 isolated gastric varices). Patients with gastric varices were excluded from further analysis.
Data was statistically analyzed using IBM® SPSS® Statistics® version 21 for Windows. Data are expressed as mean ± standard deviation. All p-values are 2 tailed, with values < 0.05 considered statistically significant. Comparisons between two groups were performed using the Student’s t-test for parametric data, and Mann-Whitney test for non-parametric data. Comparisons between multiple groups were performed by usage of ANOVA test for parametric variables and Kruskal Wallis Test for non-parametric variables. The receiver operating characteristic (ROC) curve analysis was used for detection of the cut-off value of the LSM, SSM and CLSS. Sensitivity, specificity, positive predictive value, negative predictive value, likelihood ratio positive and likelihood ratio negative were used to express the cut-off. Univariate and multivariate logistic regression analysis was used to detect predictors of EVs presence.
Results
As shown in Table-1, there was statistically significant difference (p = 0.001) between patients without varices and those with varices regarding, age (41.06 ± 7.62 vs. 47.91 ± 6.30 years), serum bilirubin (1.00 ± 0.55 vs. 1.68 ± 0.82 mg/dL), serum albumin (4.05 ± 0.39 vs. 3.51 ± 0.49g/dL), hemoglobin (13.51 ± 1.53 vs. 11.57 ± 1.68 g/L), platelets (161.21 ± 52.97 vs. 105.09 ± 31.34 × 10³/μL), PVD (11.53 ± 1.28 vs. 12.92 ± 1.54 mm), longitudinal spleen diameter (13.53 ± 1.53 vs. 16.48 ± 2.78 cm) SVD (9.74 ± 0.95 vs. 10.36 ± 1.14 cm), platelet count/spleen diameter ratio (1215.41 ± 445.58 vs. 671.14 ± 258.89), unlike BMI, serum AST, ALT, WBCs, and HCV RNA level. Really patients without varices had better statistically significant variable values.
There was statistically significant difference (p = 0.001) between patients without varices and those with varices regarding the transient elastography measurement values (Table-1). The patients with varices had higher stiffness values than those without varices as seen with LSM (31.93 ± 13.29 vs. 17.55 ± 6.53 kPa), LSM IQR (3.10 ± 2.48 vs. 1.51 ± 0.76), SSM (62.85 ± 12.71 vs. 36.94 ± 8.83 kPa), SSM IQR (4.22 ± 2.68 vs. 2.68 ± 1.16) and CLSS (94.78 ± 20.98 vs. 54.49 ± 12.84 kPa).
Table 1: Comparison of patients with and without varices.
| None | Varices | P | |
|---|---|---|---|
| N = 110 | N = 55 | ||
| M ± SD | M ± SD | ||
| Age (years) | 41.06 ± 7.62 | 47.91 ± 6.30 | 0.001 |
| BMI§ (kg/m²) | 27.16 ± 2.59 | 27.74 ± 1.64 | 0.124 |
| Bilirubin§ (mg/dL) | 1.00 ± 0.55 | 1.68 ± 0.82 | 0.001 |
| Albumin§ (mg/dL) | 4.05 ± 0.39 | 3.51 ± 0.49 | 0.001 |
| AST (U/L) | 63.96 ± 40.26 | 62.42 ± 24.15 | 0.794 |
| ALT§ (U/L) | 67.18 ± 43.90 | 61.05 ± 24.64 | 0.673 |
| Hemoglobin§ (g/L) | 13.51 ± 1.53 | 11.57 ± 1.68 | 0.001 |
| WBCs (× 103/μL) | 6.58 ± 11.04 | 4.80 ± 1.60 | 0.235 |
| Platelets§ (× 103/μL) | 161.21 ± 52.97 | 105.09 ± 31.34 | 0.001 |
| Portal vein Diameter (cm) | 11.53 ± 1.28 | 12.92 ± 1.54 | 0.001 |
| Spleen Diameter§ (cm) | 13.53 ± 1.53 | 16.48 ± 2.78 | 0.001 |
| Splenic vein Diameter§ (cm) | 9.74 ± 0.95 | 10.36 ± 1.14 | 0.001 |
| HCV PCR§ (U) | 846238.94 ± 1546406.23 | 363344.05 ± 354589.18 | 0.765 |
| Liver Stiffness§ (kPa) | 17.55 ± 6.53 | 31.93 ± 13.29 | 0.001 |
| Liver IQR§ | 1.51 ± 0.76 | 3.10 ± 2.48 | 0.001 |
| Spleen Stiffness§ (kPa) | 36.94 ± 8.83 | 62.85 ± 12.71 | 0.001 |
| Spleen IQR§ | 2.68 ± 1.16 | 4.22 ± 2.68 | 0.001 |
| Combined Stiffness§ (kPa) | 54.49 ± 12.84 | 94.78 ± 20.98 | 0.001 |
| Platelet count/spleen diameter ratio§ | 1215.41 ± 445.58 | 671.14 ± 258.89 | 0.001 |
| §Mann-Whitney test |
When patients without varices were compared with patients with either small or large varices (Table-2), there was statistically significant difference concerning age, serum bilirubin, albumin, hemoglobin, platelet count, PVD, longitudinal spleen diameter, platelet count/spleen diameter ratio, SVD, LSM, SSM and CLSS.
On comparison of patients with small varices with those with large varices (Table-2), only there was statistically significant difference with age (46.45 ± 6.91 vs. 49.79 ± 4.94 years; p = 0.001), serum bilirubin (1.43 ± 0.91 vs. 2.00 ± 0.57 mg/dL; p = 0.001), serum albumin (3.77 ± 0.45 vs. 3.18 ± 0.29 g/dL; p = 0.001), hemoglobin (12.26 ± 1.51 vs. 10.68 ± 1.47 g/L; p = 0.001), WBCs (5.24 ± 1.76 vs. 4.23 ± 1.17 × 10³/μL; p = 0.018), platelet count (113.65 ± 33.16 vs. 94.04 ± 25.43 × 10³/μL; p = 0.02), SVD (9.81 ± 0.87 vs. 11.08 ± 1.06 cm; p = 0.001) and platelet count/spleen diameter ratio (738.65 ± 278.69 vs. 583.95 ± 204.88; p = 0.027). All of above values were worse in patients with large varices. The rest of the variables like BMI, AST, ALT, PVD, longitudinal spleen diameter and HCV RNA level, were statistically non-significant.
Table 2: Comparison of small for large varices.
| Nonea | Small varicesb | Large varicesc | Pall | Pb×c | |
|---|---|---|---|---|---|
| N = 110 | N = 30 | N = 25 | |||
| M ± SD | M ± SD | M ± SD | |||
| Age¥ (years) | 41.06 ± 7.62 | 46.45 ± 6.91 | 49.79 ± 4.94 | 0.001 | 0.001 |
| BMI§ (kg/m²) | 27.16 ± 2.59 | 27.90 ± 1.47 | 27.54 ± 1.84 | 0.096 | 0.425 |
| Bilirubin§¥ (mg/dL) | 1.00 ± 0.55 | 1.43 ± 0.91 | 2.00 ± 0.57 | 0.048 | 0.001 |
| Albumin§¥ (mg/dL) | 4.05 ± 0.39 | 3.77 ± 0.45 | 3.18 ± 0.29 | 0.005 | 0.001 |
| AST (U/L) | 63.96 ± 40.26 | 57.61 ± 27.26 | 68.63 ± 18.14 | 0.509 | 0.094 |
| ALT§ (U/L) | 67.18 ± 43.90 | 58.03 ± 26.04 | 64.96 ± 22.65 | 0.705 | 0.306 |
| Hemoglobin (g/L) | 13.51 ± 1.53 | 12.26 ± 1.51 | 10.68 ± 1.47 | 0.001 | 0.001 |
| WBCs (×103/µL) | 6.58 ± 11.04 | 5.24 ± 1.76 | 4.23 ± 1.17 | 0.456 | 0.018 |
| Platelets§ (×103/µL) | 161.21 ± 52.97 | 113.65 ± 33.16 | 94.04 ± 25.43 | 0.001 | 0.02 |
| Portal vein Diameter (cm) | 11.53 ± 1.28 | 12.67 ± 1.52 | 13.25 ± 1.54 | 0.001 | 0.169 |
| Spleen Diameter§ (cm) | 13.53 ± 1.53 | 16.15 ± 2.79 | 16.90 ± 2.77 | 0.001 | 0.330 |
| Splenic vein Diameter (cm) | 9.74 ± 0.95 | 9.81 ± 0.87 | 11.08 ± 1.06 | 0.001 | 0.001 |
| HCV PCR§ (U) | 846238.94 ± 1546406.23 | 342162.26 ± 418273.82 | 390703.88 ± 256154.19 | 0.333 | 0.619 |
| Liver Stiffness§ (kPa) | 17.55 ± 6.53 | 30.84 ± 12.69 | 33.33 ± 14.19 | 0.001 | 0.496 |
| Liver IQR§¥ | 1.51 ± 0.76 | 2.31 ± 1.07 | 4.12 ± 3.31 | 0.001 | 0.001 |
| Spleen Stiffness§ (kPa) | 36.94 ± 8.83 | 59.92 ± 13.47 | 66.65 ± 10.77 | 0.001 | 0.03 |
| Spleen IQR§¥ | 2.68 ± 1.16 | 3.79 ± 1.39 | 4.78 ± 3.70 | 0.001 | 0.001 |
| Combined Stiffness§ (kPa) | 54.49 ± 12.84 | 90.76 ± 21.76 | 99.98 ± 19.14 | 0.001 | 0.04 |
| Platelet count/spleen diameter ratio§ | 1,215.41 ± 445.58 | 738.65 ± 278.69 | 583.95 ± 204.88 | 0.001 | 0.027 |
| §Kruskal Wallis Test, ¥ Mann-Whitney test, Pall comparison of the 3 groups, Pb×c comparison of small and large varices. | |||||
In fact, LSM could not differentiate small from large varices (30.84 ± 12.69 vs. 33.33 ± 14.19 kPa; p = 0.496) meanwhile SSM and CLSM were beneficial; (59.92 ± 13.47 vs. 66.65 ± 10.77kPa; p = 0.03) and (90.76 ± 21.76 vs. 99.98 ± 19.14 kPa; p = 0.04) respectively.
For discrimination of the presence of esophageal varices by TE measurement the ROC analysis revealed that the following(Table-3, Figure-1 and Figure-2); with a cutoff of 20.4 kPa LSM (81.0% sensitivity, 71.8% specificity, 52.3% PPV, 90.8% NPV, 74.3% accuracy), 43.2 kPa SSM (92.9% sensitivity, 84% specificity, 69.6% PPV, 96.9% NPV, 86.8% accuracy) and 59.3 kPa CLSS (95.2% sensitivity, 70% specificity, 54.8% PPV, 97.5% NPV, 76.9% accuracy) esophageal varices can be detected.
Table 3: Transient elastography cutoff values for detection of esophageal varices.
| LSM | SSM | CLSM | |
|---|---|---|---|
| Cutoff | 20.4 kPa | 43.2 kPa | 59.3 kPa |
| AUROC | 0.954 | 0.970 | 0.921 |
| P | 0.001 | 0.001 | 0.001 |
| Sensitivity % | 81.0 | 92.9 | 95.2 |
| Specificity % | 71.8 | 84.5 | 70.0 |
| PPV% | 52.3 | 69.6 | 54.8 |
| NPV% | 90.8 | 96.9 | 97.5 |
| Accuracy % | 74.3 | 86.8 | 76.97 |
| LR+ | -0.9 | -1.0 | -1.4 |
| LR- | -0.9 | -1.0 | -1.4 |
| PPV; positive predictive value, NPV; negative predictive value, LR+; Likelihood ratio Positive, LR-; Likelihood ratio Negative. | |||
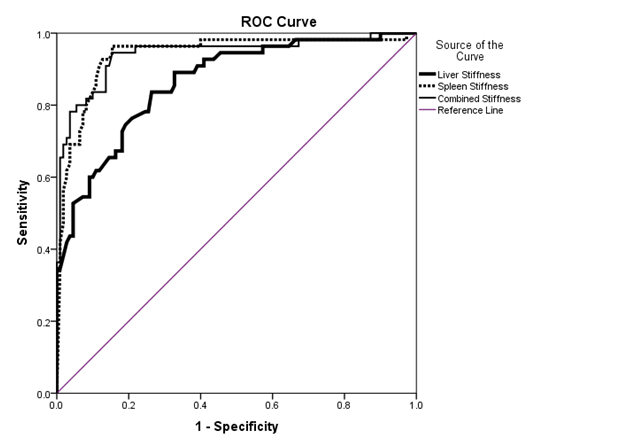
Figure 1: ROC curve for detection of esophageal varices
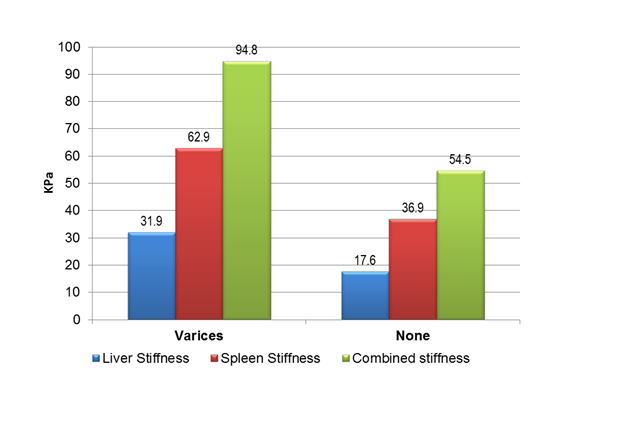
Figure 2: Cutoff values of liver, spleen and combined stiffness for detection of esophageal varices.
As shown in Table-4 by univariate analysis the age, serum bilirubin, albumin, INR, platelets, portal vein diameter, longitudinal spleen diameter, splenic vein diameter, LSM and SSM were predictors of EVs presence, meanwhile by multivariate analysis only SSM was a predictor of EVs presence.
Table 4: Predictors of esophageal varices presence.
| Univariate analysis | Multivariate analysis | |||||
|---|---|---|---|---|---|---|
| P | Odds | CI | P | Odds | CI | |
| Age | 0.001 | 1.15 | 1.08 - 1.21 | 0.056 | 1.11 | 1.00 -1.23 |
| Bilirubin | 0.001 | 4.32 | 2.41 - 7.73 | 0.704 | 1.18 | 0.51 - 2.73 |
| Albumin | 0.001 | 0.06 | 0.02 - 0.16 | 0.787 | 1.26 | 0.24 - 6.66 |
| INR | 0.001 | 5599.7 | 230.0 - 136306.255 | 0.915 | 0.75 | 0.01 - 134.31 |
| Platelets | 0.001 | 0.97 | 0.96 - 0.98 | 0.235 | 0.99 | 0.97 - 1.01 |
| Portal vein Diameter | 0.001 | 2.12 | 1.57 - 2.88 | 0.270 | 1.35 | 0.79 - 2.31 |
| Spleen Diameter | 0.001 | 2.07 | 1.62 - 2.65 | 0.389 | 1.18 | 0.81 - 1.70 |
| Splenic vein Diameter | 0.001 | 1.79 | 1.29 - 2.49 | 0.655 | 0.84 | 0.40 - 1.79 |
| Liver Stiffness | 0.001 | 1.20 | 1.13 - 1.27 | 0.090 | 1.08 | 0.99 - 1.18 |
| Spleen Stiffness | 0.001 | 1.18 | 1.12 - 1.23 | 0.001 | 1.12 | 1.05 - 1.18 |
Discussion
HCV infection is a global burden[1] which is more prevalent in Egypt[2,3]. CHC is a leading cause of liver fibrosis[4]. It is furthermore complicated with liver cirrhosis and portal hypertension[5,6]. The HVPG measurement is accurate measurement of PH, development of varices, assessment of the pharmacological treatment and decision making. However it is invasive maneuver with potential complications and is not available all centers[8,9].
Esophageal varices (EVs) are common consequence of portal hypertension. Once developed, it progresses from small to large then theyeventually rupture and bleed[10,11]. Upper gastrointestinal endoscopy is the golden standard for varices detection[12,13] but non-invasive diagnosis of portal hypertension and EVs is warranted[13].
Transient elastography measurement by FibroScan™ is a non-invasive diagnostic tool of liver fibrosis. It is characterized by being simple, quick and examines a volume 100 times bigger than a biopsy sample[14]. It is a promising non-invasive tool for PH and EVs detection especially when LSM and SSM are done. May be they will be representative of the static and dynamic status of the liver.
Notably, most of the studies used the conventional FibroScan™ program of 1.5 – 70 kPa[19-23] and others modified FibroScan™ software of 1.5 – 150 kPa[24,25] to measure modified SSM (mSSM).
Stefanescu et. al.,[19] found that the LSM was higher in patients with EVs compared to none (38.4 vs. 26.3 kPa; p = 0.003) and so SSM (72 vs. 46.05 kPa; p = 0.001). Both LSM and SSM did not differ with EVs grade (V1 vs. V2 vs. V3; p > 0.05). Colecchia et al.,[20] evaluated LSM and SSM in 100 patients with HCV related cirrhosis who underwent HVPG measurement and gastroscopy. There was difference of LSM and SSM value between patients with or without varices (26.4 vs. 15 and 58.6 vs. 39 kPa) and patients with CSPHTN and Preclinical PHTN (24.2 vs. 15.6 and 56 vs. 37 kPa) respectively. Both LSM and SSM correlated with HVPG (r = 0.8, p = 0.001). A cut off of LSMand SSM was 25 and 55 kPa for EVs presence, 24.2 and 52.8 kPa with HVPG ≥ 10 mmHg and 25 and 55 kPa with HVPG ≥ 12 mmHg.
Calvaruso et. al.,[24] used a modified FibroScanTM software of 1.5 – 150 kPa to detect the presence and the size of esophageal varices (EVs) in compensated HCV related compensated cirrhosis. The SSM was higher in patients with varices versus without (55.6 ± 19.5 vs. 44.7 ± 17.9 kPa; p = 0.006) and those with large varices than those with small varices (64.7 ± 13.6 vs. 45.3 ± 18.7 kPa; p = 0.001). Since some patients (n = 21) had SSM of 75 kPa, so modified SSM (mSSM) was measured. It was more correlated with the EV. EVs were predicted with a cut off value of 17 kPa with LSM and 50 kPa with mSSM. Saad et al.,[12] assessed the role of LSM in 32 Egyptian patients for EVs detection. LSM was higher in patients with EVs than without (49.4 vs. 27 kPa; p = 0.01). Large varices had higher LSM than small varices (60.4 vs. 38.4 kPa; p = 0.002). A cutoff of 29.7 kPa predicted EVs presence while 38.2 kPa predicted large varices presence. Sharma et. al.,[21] evaluated the role of SSM and LSM in predicting EVs and correlation with HVPG. The LSM was higher in patients with EVs versus none (51.4 vs. 23.9 kPa; p < 0.001) with a cutoff of 27.3 kPa. The LSM could not differentiated small from large varices (53 vs. 45.3 kPa; p = 0.57). However in subgroups analysis; LSM was also higher in large varices vs. small one (56 vs. 49 kPa; p = 0.001). The SSM was higher in patients with EVs versus none (54 vs. 32 kPa; p < 0.001) with a cutoff of 40.8 kPa.
Fraquelli et. al.,[22] assessed the role of LSM and SSM in evaluating the severity of the liver disease. The cutoff values of LSM and SSM for esophageal varices were 19 and 65 kPa respectively. Hua et al.,[8] found that there was no significant difference in LSM value between patients with severe EV and those having no or non-severe EVs determined by endoscopy (31 ± 18.44 vs. 28.18 ± 17.44 kPa). Hassan et al.,[9] found that LSM was higher in patients with EVs than without (30.830 ± 13.969 vs. 18.9 ± 2.877 kPa; p = 0.001). Large varices has higher LSM than small one (35.59 ± 14.72 vs. 22.37 ± 6.97 kPa; p = 0.001). He found that a LSM cut off of 18.2kPa was predictive of EVs and 22.4 kPa was for large varices.
Colecchia et al.,[26] developed a model of both SSM and MELD for prediction of the 1st decompensation of the patient (ascites or bleeding). Interestingly Chin et. al.,[27] studied LSM and SSM changes post-liver transplantation [n = 14]. The SSM was a predictor for the presence of EVs. Moreover both the LSM and SSM decreased markedly after liver transplantation. SSM decreased from 75 kPa pre-transplant to post-transplant values of 41.9kPa [2w] and 32.9kPa [4-8w]. On the other hand a recent meta-analysis was disappointing for the usefulness of SSM in the prediction of EVs presence[28].
For detection of EVs, studies revealed different LSM cutoff values 18.2 - 29.7 kPa[9,12,20-22], and SSM 50 - 56 kPa[9,20,22]. But the debate on their ability to differentiate small from large varices since few studies reported this[9,12].
In our study we did both LSM and SSM. We analyzed also their combinations. All the patients underwent measurement fasting in the supine position to avoid food and position effect[29,30]. The LSM, SSM and CLSS values were higher in patients with varices that those without. The cutoff for esophageal varices detection was 20.4, 43.2 and 59.3 kPa respectively. The LSM could not differentiate small from large varices in contrast to SSM and CLSS. In fact the role of LSM and SSM is evolving progressively and can be considered for noninvasive diagnosis of EVs.
Conclusion
The measurement of liver, spleen stiffness by FibroScan™ or their combinations are useful for esophageal varices diagnosis and classification.
References
- 1. WHO. Guidelines for the screening, care and treatment of persons with hepatitis C infection. (2014) S1-S122.
- 2. Shepard, CW., Finelli, L., Alter, MJ. Global epidemiology of hepatitis C virus infection. (2005) Lancet Infect Dis 5(9): S558-S567.
- 3. Waked, I., Doss, W., El-Sayed, MH., et. al. The current and future disease burden of chronic hepatitis C virus infection in Egypt. (2014) Arab J gastroenterol 15(2): S45-S52.
- 4. Calvaruso, V., Craxì, A. Fibrosis in chronic viral hepatitis. (2011) Best Prac Res Clin Gastroenterol 25(2): S219-S230.
- 5. Tsochatzis, EA., Bosch, J., Burroughs, AK. Liver cirrhosis. (2014) Lancet 383(9930): S1749-S1761.
- 6. Zhang, DY., Friedman, SL. Fibrosis-dependent mechanisms of hepatocarcinogenesis. (2012) Hepatology 56(2): S769-S775.
- 7. Iwakiri, Y. Pathophysiology of Portal Hypertension. (2014) Clin Liver Dis 18(2): S281-S291.
- 8. Hua, J., Liu, GQ., Bao, H., et.al. The role of liver stiffness measurement in the evaluation of liver function and esophageal varices in cirrhotic patients. (2015) J dig dis 16(2): S98-S103.
- 9. Hassan, EM., Omran, DA., El Beshlawey, ML., et.al. Can transient elastography, Fib-4, Forns Index, and Lok Score predict esophageal varices in HCV-related cirrhotic patients? (2014) Gastroenterol hepatol 37(2): S58-S65.
- 10. Al-Dahshan, M. Clinical application of transient elastography in prediction of portal hypertension related complication in patients with chronic liver diseases. (2012) J Egypt Soc Parasitol 42(1): S79-S88.
- 11. Wang, HM., Lo, GH., Chen, WC., et.al. Efficacy of transient elastography in screening for large esophageal varices in patients with suspicious or proven liver cirrhosis. (2012) J dig dis 13(8): S430-S438.
- 12. Saad, Y., Said, M., Idris, MO., et.al. Liver stiffness measurement by fibroscan predicts the presence and size of esophageal varices in egyptian patients with HCV related liver cirrhosis. (2013) J clin diagn res 7(10): S2253-S2257.
- 13. de Franchis, R., Dell’Era, A. Invasive and noninvasive methods to diagnose portal hypertension and esophageal varices. (2014) Clin Liver Dis 18(2): S293-S302.
- 14. de Ledinghen, V., Vergniol, J. Transient elastography (FibroScan). (2008) Gastroenterol clin biol 32(6): S58-S67.
- 15. Bolognesi, M., Merkel, C., Sacerdoti, D., et.al. Role of spleen enlargement in cirrhosis with portal hypertension. (2002) Dig liver dis 34(2): S144-S150.
- 16. Mejias, M., Garcia-Pras, E., Gallego, J., et.al. Relevance of the mTOR signaling pathway in the pathophysiology of splenomegaly in rats with chronic portal hypertension. (2010) J hepatol 52(4): S529-S539.
- 17. Schuppan, D., Afdhal, NH. Liver cirrhosis. (2008) Lancet 371(9615): S838-S851.
- 18. Lee, UE., Friedman, SL. Mechanisms of hepatic fibrogenesis. (2011) Best Pract Res Clin Gastroenterol 25(2): S195-S206.
- 19. Stefanescu, H., Grigorescu, M., Lupsor, M., et.al. Spleen stiffness measurement using Fibroscan for the noninvasive assessment of esophageal varices in liver cirrhosis patients. (2011) J Gastroenterol Hepatol 26(1): S164-S170.
- 20. Colecchia, A., Montrone, L., Scaioli, E., et.al. Measurement of spleen stiffness to evaluate portal hypertension and the presence of esophageal varices in patients with HCV-related cirrhosis. (2012) Gastroenterology 143(3): S646-S654.
- 21. Sharma, P., Kirnake, V., Tyagi, P., et.al. Spleen stiffness in patients with cirrhosis in predicting esophageal varices. (2013) Am J gastroenterol 108(7): S1101-S1107.
- 22. Fraquelli, M., Giunta, M., Pozzi, R., et.al. Feasibility and reproducibility of spleen transient elastography and its role in combination with liver transient elastography for predicting the severity of chronic viral hepatitis. (2014) J viral hepat 21(2): S90-S98.
- 23. Colecchia, A., Colli, A., Casazza, G., et.al. Spleen stiffness measurement can predict clinical complications in compensated HCV-related cirrhosis: A prospective study. (2014) J hepatol 60(6): S1158-S1164.
- 24. Calvaruso, V., Bronte, F., Conte, E., et.al. Modified spleen stiffness measurement by transient elastography is associated with presence of large oesophageal varices in patients with compensated hepatitis C virus cirrhosis. (2013) J viral hepat 20(12): S867-S874.
- 25. Radu, C., Stefanescu, H., Procopet, B., et.al. Is spleen stiffness a predictor of clinical decompensation in cirrhotic patients? (2014) J Gastrointestin Liver Dis 23(2): S223-S224.
- 26. Colecchia, A., Colli, A., Casazza, G., et.al. Spleen stiffness measurement can predict clinical complications in compensated HCV-related cirrhosis: a prospective study. (2014) J hepatol 60(6): S1158-S1164.
- 27. Chin, JL., Chan, G., Ryan, JD., et.al. Spleen stiffness can non-invasively assess resolution of portal hypertension after liver transplantation. (2015) Liver int 35(2): S518-S523.
- 28. Singh, S., Eaton, JE., Murad, MH., et.al. Accuracy of spleen stiffness measurement in detection of esophageal varices in patients with chronic liver disease: systematic review and meta-analysis. (2014) Clin Gastroenterol Hepatol 12(6): S935-S945.
- 29. Chin, JL., Chan, G., Ryan, JD., et.al. SPLEEN STIFFNESS IS LOWER WHEN MEASURED IN THE RIGHT LATERAL POSITION COMPARED TO THE SUPINE POSITION. (2013) Gut 62: S38-S39.
- 30. Arena, U., Lupsor Platon, M., Stasi, C., et.al. Liver stiffness is influenced by a standardized meal in patients with chronic hepatitis C virus at different stages of fibrotic evolution. (2013) Hepatology 58(1): S65-S72.


