
Fructose Intake and Circulating Triglycerides: An Examination of the Role of APOC 3
Eric Campbell
Affiliation
Department of Nutrition and Food Science, University of Maryland, College Park, MD 20742, USA
Corresponding Author
Thomas W. Castonguay, Department of Nutrition and Food Science, University of Maryland, College Park, MD 20742, USA, Tel: 301 405-4503; E-mail: twc@umd.edu
Citation
Thomas, W.C., et al. Fructose Intake and Circulating Triglycerides: An Examination of the Role of APOC 3 (2014) J Diabetes Obes 1(1): 14- 20.
Copy rights
© 2014 Thomas W.C. This is an open-access article distributed under the terms of the Creative Commons Attribution 4.0 International License.
Keywords
Sugar; Liver; Hypertriglyceridemia; Metabolism; Obesity; Food intake
Abstract
Fructose consumption can lead to marked increases in plasma triglycerides in both humans and laboratory animals. We have observed that overnight access to a 16% fructose solution can promote hypertriglyceridemia in rats. Several investigators have suggested that APOC 3 may be implicated in promoting fructose-induced hypertriglyceridemia. We have examined the role of APOC 3 in liver and blood taken from rats that had been given access to a fructose solution overnight as a supplement to standard laboratory chow. Hepatic APOC3 mRNA expression from fructose alone resulted in a 14 % reduction compared to control. Interestingly, hepatic APOC3 expression was increased by about 250% in sucrose, high fructose corn syrup and glucose groups. The serum protein levels of APOC3 did not differ across groups. Contrary to our hypothesis, these results indicate that glucose containing sugars increased hepatic APOC3 mRNA expression but no sugar was capable of increasing the serum protein level.
Introduction
Many recent review articles have focused on the increase in fructose consumption over the last century and suggest large amounts of fructose in the diet can lead to hypertriglyceridemia (HTG)[1,2]. This phenomenon has been replicated in both human and animal studies[3-6]. Literature searchers on "fructose AND hypertriglyceridemia” reveal that there are several plausible mechanisms that link fructose and HTG. In particular, this study will focus exclusively on the examination on the role of apolipoprotein CIII (APOC3) in promoting HTG in less than 24 hours.
The obesity epidemic that we are experiencing in the US is a national concern that affects all Americans. It does not discriminate among age, race, class, or gender. In 1985 the rate of obesity across our country was under 14%; but by 2010 the rate exceeded 30%[7]. Furthermore, obesity is quickly becoming a leading cause of major health problems and death in the US[8]. The research community, along with policy makers and health care officials are grappling to find the causes of this relatively sudden increase in American’s girth. Several researchers have targeted high-fructose corn syrup as a potential accomplice supporting the obesity epidemic[9-12]. They and their supporters have pointed out that fructose has become more prevalent in our diets over the past century. In 1900 the average fructose intake was 15g/day. Fructose was consumed mainly through eating fruits and vegetables, which have the added benefit of fiber. However, as of 2010, fructose consumption had risen to 73g/day and was being consumed in highly processed forms[13].
Apolipoprotein C-III (APOC3) is a lipoprotein that is expressed in the liver of humans and rodents. APOC3 is also one of the most abundant apolipoproteins in plasma, with an average concentration of about 12 mg/dL. There is a positive correlation between plasma APOC3 concentration and elevated levels of plasma triglycerides & VLDL triglycerides. In addition, transgenic mice that over expressed or lacked the APOC3 gene resulted in hyperlipidemia or were protected from hyperlipidemia, respectively[14] .
An attractive hypothesis to the lipogenic nature of fructose is in its ability to alter normal hepatic gene expression favoring an increase in lipogenic gene expression[15]. APOC3 has become an increasingly popular mechanistic approach that links fructose with HTG[16]. Chronic fructose feeding (> 4 week) promotes increased HTG[17], but never has it been shown before acute fructose bolus (< 24 hours). Keep in mind that it has been demonstrated already that fructose can elicit HTG in 24 hours or less[18]. The question addressed by the following experiment is: Fructose can indirectly increase hepatic expression of APOC3. APOC-3 is produced in the liver and released into circulation attached to very low - density lipoproteins[19]. APOC3 is a potent inhibitor of lipoprotein lipase (LPL)[20]. In the presence of insulin LPL plays a pivotal role in the clearance of plasma triglycerides[21]. However, fructose alone does not stimulate a significant insulin release[22,23]. Thus, it seems that fructose is a dual threat to plasma triglyceride clearance; by its ability to activate APOC3 and its inability to produce significant insulin release. The purpose of this study is to test various types of fructose-containing sugars (fructose, sucrose and high fructose corn syrup) with the intent of replicating our earlier observations that overnight access to fructose can promote HTG as well as to examine the role that apolipoprotein C3 (APOC3) in promoting HTG. Since pure fructose is the most lipogenic of all the sugars, we hypothesize that the treatment of pure fructose will elicit the greatest perturbation in APOC3 message and protein levels.
Materials and Methods
Experimental animals
Adult male Sprague-Dawley (CD strain) rats (Charles River Laboratories, Wilmington, MA) with a mean weight of approximately 300 grams were used. Upon arrival, all animals were individually housed and maintained on a 12h light/dark cycle with a room temperature of 22°C ± 1°C. During the 1 wk acclimation period the rats were given free access to the control diet and water. Animals were weighed and 24h food intake and sugar solution intake (when appropriate) were measured daily at 0900h throughout the experiment.
All rats were killed by slow replacement of air in a specialized chamber with pure CO2 followed by rapid decapitation and exsanguination. This method has been approved for use by the Panel on Euthanasia of the American Veterinary Medical Association as well as the UM IACUC. All procedures described herein are in compliance with the University of Maryland’s IACUC guidelines.
Diets
The control diet is a nutritionally complete low fat diet [Rodent diet 7012] prepared by Harlan Teklad (Bethlehem, PA) and provides 3.41 metabolizable kcal/g of diet. Per gram of chow, 2.14 kcal were derived from carbohydrate, 0.79 kcal was derived from protein, and 0.51 kcal was derived from fat. All animals were given free access to water throughout the experiment.
Experimental Design
After an initial 1 wk acclimation period (during which they had ad lib access to food and water), the rats (N = 40) were randomly assigned to one of five weight-matched groups (n = 8). Rats assigned to the first group were given ad libitum access to control diet (Harlan rodent diet 7012) only, and served as the control group. Rats assigned to the second group had ad libitum access to the control diet and free access to a 16% weight/volume fructose (Tate & Lyle, Decatur, IL) solution. Rats assigned to the third group had ad libitum access to the control diet plus free access to a 16% glucose weight/volume (Sigma Aldrich, St Louis MO) solution. Rats assigned to the fourth group had ad libitum access to the control diet and free access to 16% high fructose corn syrup (HFCS) weight/volume (Tate & Lyle, Decatur, IL), Finally, rats assigned to the fifth group had ad libitum access to the control diet and free access to a 16% weight/volume sucrose (Domino Foods, Baltimore, MD) solution. All sugar solutions were prepared 24h in advance and stored at 4°C. The rats were maintained on their respective diets for 24h and then sacrificed. At the time of sacrifice, the lobuslateralis sinister of each liver was dissected and flash frozen for storage at - 80°C.
Measurement of Plasma Insulin: A Rat/Mouse Insulin ELISA Kit was purchased from Milipore, (Cat.#EZRMI - 13K) and used to quantify insulin in rat plasma.
Measurement of Plasma Triglycerides: A Dimension clinical chemistry system Flex reagent cartridge (Siemens Healthcare Diagnostics, Newark, DE) was used with a Dade Behring Dimension Xpand automated system to quantify plasma triglyceride levels.
Measurement of Plasma glucose: Plasma glucose concentrations were measured enzymatically (Smith - Kline Beecham Laboratories).
Measurement of Plasma APOC3: A rat APOC3 ELISA kit was purchased from NeobioLab (Cat.#RA0523) and used to quantify APOC3 protein levels in serum. All plasma measurements were run in duplicate.
Quantification of APOC3 mRNA in Liver: Total RNA was extracted from each liver sample according to RNeasy Mini and RNeasy Lipid (QIAGEN) kit directions. The samples were purified with DNA-free (Ambion) and analyzed spectrophotometrically (Nanodrop) to determine concentration and check for quality. cDNA template was created for each sample from 500ng of purified RNA using Superscript III Reverse Transcriptase (Invitrogen). cDNA was made using the SABiosciences RT2 First Strand Kit. A genomic DNA elimination mixture was first created using 15 µg RNA samples from each group (equal quantity from each animal) that was then mixed with 2.0 µl of 5 X qDNAelimination buffers and RNase - free H2O to a final volume of 10 µl. Contents were mixed gently, incubated at 42°C for 5 minutes and chilled on ice. An RT cocktail was then prepared, containing 5X RT Buffer 3, Primer & External Control Mix, RT Enzyme Mix 3, and RNase free H2O. 10 µl of the RT cocktail was added to each genomic DNA elimination mixture, mixed well, and incubated at 42°C for exactly 15 min and then immediately stopped by heating at 95°C for 5 min. 91 µl of ddH2O was added to each 20 µL of cDNA synthesis reaction and the solution was mixed well and stored at - 20°C.
Changes in gene expression were measured in each liver sample, n = 40, using RT-PCR array. IQ SYBER Green Supermix (BIORAD Cat # 170-8882) was used on a C1000 BIO-RAD thermal cycler (CFX96 Real-Time System) to quantify gene expression.
A "housekeeper" or reference gene is used in RT-PCR to enable quantification of a target gene. Numerous attempts were made to elucidate a "housekeeper" gene that was not influenced by our treatments, including beta-ACTIN, RPLP1, and GAPDH. Unfortunately, the Ct values of each identified "housekeeper" were influenced by the treatments. To correct/normalize the "housekeeper" gene in each group a weighting factor was assigned. The weighting factor that transformed each sample to match the beta-actin control groups "housekeeper" value was selected. In addition, the same weighting factor was applied to the target genes Ct values. A sample of how the weighting was conducted is provided in table 1.
Cycle threshold (Ct) values obtained through RT-PCR for all samples are used to calculate fold change of gene expression. Fold change was calculated as 2^( - ddCt) . Fold change of 0.5 or less or of 1.5 or greater were considered 'robust'.
Primers were designed using Beacon Designer 7 software default parameters (PREMIER Biosoft, Palo Alto, CA). These primers include beta-ACTIN, RPLP1, GAPDH, and APOC3. Primers were evaluated using the CFX96 (BioRad) protocol, using a gradient that was centered around predicted optimum annealing temperature (TaOpt). The protocol for primer verification PCR is as follows: 95°C, 3 min, and 40 cycles at 95°C for 10 sec, at a gradient of temperatures for 30 sec with subsequent melt curve of 65°C- 95°C at increments of 0.5°C for 5 sec. Housekeepers were selected based on the least variation in cycles between groups. See table 2 for primer sequences.
Statistical Analysis:All statistical analyses for the data acquired were performed using SAS version 9.1 (SAS Institute, Cary, NC). The significance level for all experiments was set at P < 0.05. ANOVA was used when data were normally. Statistics were performed for the following dependent variables using one-way ANOVA and then Tukey's Posthoc Test if appropriate: APOC3 mRNA; APOC3 protein levels; and plasma glucose, insulinand triglyceride concentrations.
Results
Body Weight: Twenty-four hour access to any of the four sugar solutions used failed to promote significant differences in body weight (p < 0.05) (F = 0.0571) (df = (4, 38)). Refer to body weight data presented in Table1. There was no significant correlation in the amount of sugar consumed and the observed body weight after treatment (R2 = 0.12) (F = 3.9297).
Chow Intake
Food intake did not differ between groups during the six-day acclimation period leading up to the treatment day. The average amount of chow consumed by all animals during the acclimation period was 25 grams. However, during the treatment period when the rats had access to sugar, the average chow consumption plummeted to 18.5 grams. All treatment groups but high fructose corn syrup and fructose ate significantly less chow on the treatment day when compared to the control (water) group (P < 0.05) (F = 4.1631)(df = 4, 37). There were no significant differences between any of the treatment groups. See Figure 1 for values.

Figure 1: Twenty-four hr. Chow Intake on Treatment Day. The sucrose and glucose groups ate significantly less chow on the treatment day when compared to the control (water), (F = 4.1631)(df = 4, 37). There are no significant differences between any of the sugar treated groups. Presented are group means + SEM of each treatment group. Means sharing the same letter are not significantly different from one another.
Sugar Intake
No differences were observed in the amount of sugar consumed amongst each treatment group (P < 0.05)(F = 1.9691)(df = 3, 30). See Table 4 for intake data.
Total Intake
No differences were observed in the amount of total caloric intake amongst each group, including control. See table 4 for total intake data (P < 0.05) (F = 0.2190) (df = 4, 37).
Plasma Analysis
Fructose, HFCS, and sucrose consumption caused significant upregulation in circulating triglycerides (P < 0.05)(F = 13.69)(df = (4,38)) . No differences exist among the five groups in plasma insulin (P < 0.05) (F = 0.12)(df = (4,35)), plasma glucose (P < 0.05)(F = 1.3)(df = (4,35)), and plasma APOC3 (P < 0.05)(F = 1.35)(df = (4,38)). Refer to plasma data presented in table 5.
Housekeeper Selection
It has long been recognized that the selection of a housekeeper gene should be determined by that gene’s resistance to treatment effects. We examined several standard housekeepers and found that all were significantly affected by sugar solution consumption (Duncan’s new multiple range test).The housekeepers that were tested include beta-actin (P < 0.05)(F = 18.5)(df = (4,37)), Ribosomal protein large protein1 (RPLP1) (P < 0.05)(F = 20.9)(df = (4,37)), and glyceraldehyde 3 - phosphate dehydrogenase (GAPDH) (P < 0.05)(F = 18.9)(df = (4,37)). Refer to housekeeper selection data presented in figure 2.
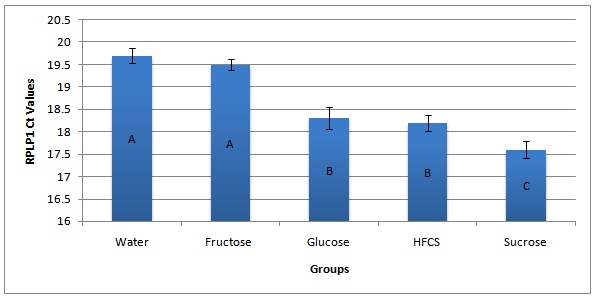
Figure 2: Example of Reoccurring Housekeeper Data. Group mean Ct values for RPLP1 are presented here. Presented are group means + SEM of each treatment group. Groups sharing the same letter are not significantly different from one another, (P < 0.05)(F = 20.9)(df = (4,37)).
It was discovered that our treatment groups could influence all of the housekeepers Ct values by a particular replicable pattern. The Ct values of both the Fructose and the control groups were always significantly higher than the other groups but did not differ from one another. This observation was the result of all available housekeepers tested. Refer to housekeeper selection data presented in Table 6.
APOC3 Gene Expression: After normalizing the housekeepers Ct values and adjusting the weighting factor for each group, there were some differences in gene expression among the treatment groups. The water group was our control and reference group for which APOC3 gene expression fold change was measured. The sucrose, & glucose groups had similar significantly positive fold changes at 2.68, and 2.59, respectively when compared to control (P < 0.05)(F = 7.1)(df = (4,37)). High - fructose corn syrup had a positive fold change of 2.40 but was not considered significant by the means ANOVA. Fructose elicited a negative fold change at 0.86 but was not considered significant but the means ANOVA. Refer to APOC3 gene expression presented in figure 3.
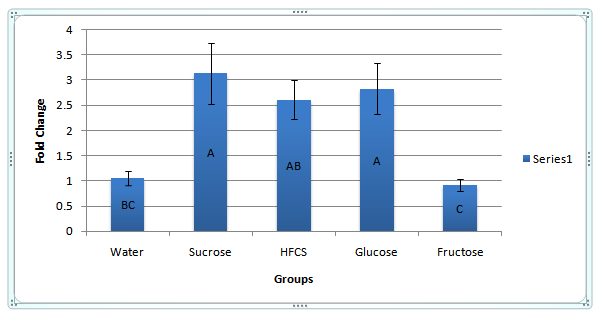
Figure 3: APOC3 mRNA Gene Expression. APOC3 mRNA gene expression is presented here with regards to fold changes using the 2^(-ddCt) equation. Presented are group means ± SEM of each treatment group. Only the glucose containing sugars sucrose, HFCS, and glucose were able to positively increase the mRNA expression of APOC3 in a significant manner (P < 0.05)(F = 7.1)(df = 4,36)).
Discussion
There is an alarming obesity epidemic in this country. The obesity problem is particularly worrying not only in terms of human health and quality of life but also in terms of dollars currently spent and will be spent on healthcare in the treatment of obesity related comorbidities. Obesity has become the nation’s most preventable health problem[24-25].
Despite its prevalence, there is no known cure for this disease or consensus about how it develops. One hypothesis for the cause of obesity is that dietary intake patterns of Americans have significantly shifted over the past fifty years by including unprecedented amounts of refined sugar[26].
The purpose of this experiment was to examine this hypothesis by evaluating how sugars affect triglyceride metabolism in the liver. Animals were given 24-hour access to a dilute glucose, sucrose, HFCS, or fructose sugar solution. Intake of both chow and sugar was measured. Hepatocyte tissue was collected and changes in APOC3 gene expression were measured using a RT-PCR assay for the different treatment groups.
Previous studies have shown that initial presentation of a sugar solution will result in rats consuming excess calories from sugar. Over time however this result washes out and total caloric intake returns to a level that resembles control[27-28].
These findings did not support previous studies that showed an increase in kcal upon initial presentation of sugar access. Our findings suggest that all animals were able to selectively regulate their overall total intake regardless of the type of sugar presented. All sugar-fed animals consumed the same amount of total calories and there were no differences in percent kcal from sugar for groups consuming fructose-containing sugars (sucrose, HFCS, fructose).
The rats in this experiment did not increase intake of glucose - fructose disaccharides (sucrose and HFCS) in such a way as to match the amount of fructose consumed in the fructose group. In other words rats did not have a threshold for fructose consumption and compensate by consuming 50% more sucrose or 45% more HFCS to match the total consumption of fructose in the fructose fed group. We applied the same model as Collier and Bolles did in their 1968 sugar dilution studies. Looking at intake of various sugar dilutions in rats, Collier and Bolles found that regardless of the type of sugar presented, rats will increase their intake of a dilute sugar so as to take in a certain threshold amount of total grams of sugar[29-31]. In the current study, this model was applied to dilutions of fructose intake. For example, sucrose fed animals had a solution that was 50% less fructose than the fructose animals. Replicating Collier and Bolles' findings, there was not set level for fructose intake as animals consuming sucrose and HFCS, which have less fructose, consumed the same amount of total kcal from sugar. These findings also show that fructose having a sweeter taste than glucose did not impact intake.
Fructose, high-fructose corn syrup, and sucrose caused a significant and robust increase in triglycerides with only 24 hours of access. Others have demonstrated that fructose alone could elicit HTG in 24 hours but never has sucrose and high-fructose corn syrup resulted in HTG in only 24 hrs. The importance of this finding is that hypertriglyceridemia occurred with only 24 - hour access to fructose and in addition with other fructose containing sugars. No differences in plasma insulin, glucose, and APOC3 were observed, as all blood samples were collected under ad libitum feeding conditions.
The reoccurring pattern of group differences for each housekeeper inhibited our ability to quantify gene expression using traditional methods. Traditionally, a housekeeper is defined by not being affected by the treatment itself and is used as a reference in 2^(- ddCt) equation. Some collaboration with experts in using RT-PCR was required before concluding that a weighting factor was a viable option. The control group in our experiment became the reference Ct value that was needed to correct for all other grouped beta-actin & APOC3 values and eventually applied to the 2^( - ddCt) equation.
An obvious limitation to the APOC3 gene expression results includes the manipulation of data as seen in the weighting factor that was applied. However, many attempts were made to elucidate a housekeeper gene that would allow the use of the more traditional method in gene expression studies. Each housekeeper was tested twice with duplicate sample data. In addition, the selection of housekeepers to be tested came from literature searchers that suggested they are widely utilized in the scientific community.
However limited the results may be, they are much different than expected. The available literature suggests that APOC3 is a possible link to eliciting hypertriglyceridemia via increased mRNA gene expression in liver that leads to increased protein expression in circulation. The literature also suggests chronic fructose consumption leads to an increase in APOC3 mRNA and Protein levels. Therefore, the current studies hypothesis was that treatment groups with the highest fructose concentration would have highest levels of APOC3, both message and protein. Interestingly, the results from this study tell quite a different story. The groups containing glucose (glucose, sucrose, and high-fructose corn syrup) elicited the highest APOC3 mRNA concentration in the liver compared to the control. The pure fructose treatment group, which was thought to increase APOC3 message the most, deviated from the hypothesis by slightly decreasing the message compared to control.
This study contributed a few novel items to the literature on fructose-induced HTG. First, this study confirmed that fructose-induced HTG could be elicited in 24 hrs or less in many of the readily available fructose containing sugars (fructose, sucrose, and high-fructose corn syrup). Note that these animals had free access to sugars for the first time and could control their own intake, which makes it physiologically relevant. Secondly, this study tested the validity of APOC3 and its role in the fructose-induced HTG mechanism in 24 hrs or less. Contrary to other studies that suggest APOC3 is responsible for HTG, here we conclude that there is an alternative mechanism to elicit HTG in 24 hrs or less that has not yet been identified. We speculate here that it may well be that the ratio of other lipoproteins to AOC3 may be the key to understanding how fructose consumption results in HTG. To be certain a more comprehensive study needs to be designed that could measure the ratios of other lipoproteins involved in newly synthesized VLDL and test their relative proportionalities to APOC3. This could confirm or deny APOC3’s involvement in the 24 h mechanism to elucidate HTG.
Funding: Grants, sponsors, funding: This work was supported in part by a grant from the Maryland Agricultural Experiment Station and a Collaborative Agreement with the USDA Human Nutrition Research Laboratory awarded to TWC.
References
- 1. Havel, P.J. Dietary Fructose: Implications for Dysregulation of Energy Homeostasis and Lipid/Carbohydrate Metabolism. (2005) Nutrition reviews 63(5): 133-157.
- 2. Tappy, L., Lê, K.A. Metabolic effects of fructose and the worldwide increase in obesity. (2010) Physiological reviews 90(1): 23-46.
- 3. Storlein, L.H., Oakes, N.D., Pan, D.A., et al. Diabetes 1993; 42: 457-62.
- 4. Kanarek, R.B., Orthen-Gambill, N. Differential effects of sucrose, fructose and glucose on carbohydrate-induced obesity in rats. (1982) J Nutrition 112: 1546-1554.
- 5. Bar-On, H., Stein, Y. Effect of glucose and fructose administration on lipid metabolism in the rat. (1967) J Nutr 94(1): 95-105.
- 6. Stanhope, K.L., Schwarz, J.M., Keim, N.L., et al. Consuming fructose-sweetened, not glucose-sweetened, beverages increases visceral adiposity and lipids and decreases insulin sensitivity in overweight/obese humans. (2009) The Journal of clinical investigation 119(5): 1322-1334.
- 7. State Obesity Prevalence, Adult Obesity Facts.
- 8. Cawley, J., Meyerhoefer, C. The medical care costs of obesity: an instrumental variables approach. (2012) J Health Econ 31: 219-230.
- 9. Institute of Medicine (US). Committee on Accelerating Progress in Obesity Prevention, & Glickman, D. (2012). Accelerating Progress in Obesity Prevention: Solving the Weight of the Nation. National Academies Press. Adv Nutr 3(5): 708-709.
- 10. Bocarsly, M.E., Powell, E.S., Avena, N.M., et al. High-fructose corn syrup causes characteristics of obesity in rats: increased body weight, body fat and triglyceride levels. (2010) Pharmacol Biochem Behav 97: 101-106.
- 11. Malik, V.S., Hu, F.B. Study Synopses: Sugar-Sweetened Beverages (SSBs) and Adult Obesity. (2012) Curr Diab Rep 12: 195–203.
- 12. Stanhope, K.L. Role of fructose-containing sugars in the epidemics of obesity and metabolic syndrome. (2012) Annu Rev Med 63: 329-343.
- 13. Vos, M.B., Kimmons, J.E., Gillespie, C., et al. Dietary fructose consumption among US children and adults: the Third National Health and Nutrition Examination Survey. (2008) Medscape J Med 10(7): 160.
- 14. Jong, M.C., Hofker, M.H., Havekes, L.M. Role of ApoCs in lipoprotein metabolism: functional differences between ApoC1, ApoC2, and ApoC3. (1999) Arteriosclerosis, thrombosis, and vascular biology 19(3): 472-484.
- 15. Chong, M.F., Fielding, B.A., Frayn, K.N. (2007) Mechanisms for the acute effect of fructose on postprandial lipemia. The American journal of clinical nutrition 85(6): 1511-1520.
- 16. Horton, J.D., Goldstein, J.L., Brown, M.S. SREBPs: activators of the complete program of cholesterol and fatty acid synthesis in the liver. (2002) J Clin Invest 109: 1125–1131.
- 17. Basciano, H., Federico, L., Adeli, K. Fructose, insulin resistance, and metabolic dyslipidemia. (2005) Nutr Metab (Lond) 2(1): 5.
- 18. Altomonte, J., Cong, L., Harbaran, S., et al. Foxo1 mediates insulin action on apoC-III and triglyceride metabolism. (2004) J Clin Invest 114: 1493–1503.
- 19. Qu, S., Su, D., Altomonte, J., et al. PPAR{alpha} mediates the hypolipidemic action of fibrates by antagonizing FoxO1. (2007) Am J Physiol Endocrinol Metab 292(2): E421-E434.
- 20. Schwarz, J.M., Neese, R.A., Schakleton, C., et al. De novo lipogenesis during fasting and oral fructose in lean and obese hyperinsulinemic subjects. (1993) Diabetes 42(Suppl 1):39A.
- 21. Moon, Y.A., Shah, N.A., Mohapatra, S., et al. Identification of a mammalian long chain fatty acyl elongase regulated by sterol regulatory element-binding proteins. (2001) J BiolChem 276: 45358–453566.
- 22. Altomonte, J., Cong, L., Harbaran, S., et al. Foxo1 mediates insulin action on apoC-III and triglyceride metabolism. (2004) J Clin Invest 114: 1493–1503.
- 23. Colley, D.E., London, B., Jiang, J., et al. Nova Science Publishers. Johnston BM and Collins AB (eds). Hauppage NY: 129-143.
- 24. Jong, M.C., Hofker, M.H., Havekes, L.M. Role of ApoCs in lipoprotein metabolism: functional differences between ApoC1, ApoC2, and ApoC3. (1999) Arterioscler Thromb Vasc Biol 19(3): 472–484.
- 25. Eckel, R.H. Lipoprotein lipase. A multifunctional enzyme relevant to common metabolic diseases. (1989) N Engl J Med 320(16): 1060-1068.
- 26. Jia, H., Lubetkin, E.I. (2010) Trends in quality-adjusted life-years lost contributed by smoking and obesity. Am J Prev Med 38: 138-144.
- 27. Flegal, K.M., Carroll, M.D., Ogden, C.L., et al. Prevalence and trends in obesity among US adults, 1999-2008. (2010) JAMA 303(3): 235-241.
- 28. Paeratakul, S., York-Crowe, E.E., Williamson, D.A., et al. Americans on diet: results from the 1994-1996 Continuing Survey of Food Intakes by Individuals. (2002) J Am Diet Assoc 102: 1247-1251.
- 29. London, E., Lala, G., Berger, R., et al. Sucrose access differentially modifies 11beta-hydroxysteroid dehydrogenase-1 and hexose-6-phosphate dehydrogenase message in liver and adipose tissue in rats. (2007) J Nutr 137: 2616-2621.
- 30. Kanarek, R.B., Orthen-Gambill, N. Differential effects of sucrose, fructose and glucose on carbohydrate-induced obesity in rats. (1982) J Nutr 112(8): 1546-1554.
- 31. Collier, G., Bolles, R. Some determinants of intake of sucrose solutions. (1968) J Comp Physiol Psychol 65: 379-383.


