
Homology modeling and molecular docking of URAT1 with chemotherapeutic agents in hyperuricemia and gout
Dan Zuo, Shaodan Chen, Diling Chen, Jiyan Su
Affiliation
- 1State Key Laboratory of Applied Microbiology Southern China, Guangdong Provincial Key Laboratory of Microbial Culture Collection and Application and Guangdong Open Laboratory of Applied Microbiology, Guangdong Institute of Microbiology, Guangzhou 510070, China
- 2Guangdong Yuewei Edible Fungi Technology Co., Guangzhou 510663, China
- 3Guangzhou Institutes of Biomedicine and Health, Chinese Academy of Sciences, Guangzhou 510530, China
Corresponding Author
Tianqiao Yong; State Key Laboratory of Applied Microbiology Southern China, Guangdong Provincial Key Laboratory of Microbial Culture Collection and Application and Guangdong Open Laboratory of Applied Microbiology, Guangdong Institute of Microbiology, Guangzhou 510070, China; Tel: +86-20-32059602; Fax: +86-20-32079392; E-mail: tianqiao@mail.ustc.edu.cn
Citation
Tianqiao Yong., et al. Homology Modeling and Molecular Docking of URAT1 with Chemotherapeutic Agents for Hyperuricemia and Gout (2017) Bioinfo Proteom Img Anal 3(2): 203-209.
Copy rights
© 2017 Tianqiao Yong. This is an Open access article distributed under the terms of Creative Commons Attribution 4.0 International License.
Keywords
URAT1, Homology modeling, Binding affinity, Molecular docking, Hyperuricemia
Abstract
Uric acid transporter 1 (URAT1), a protein involved in uric acid reabsorption, has been linked to pathogenesis of hyperuricemia and gout. Hence, targeting this protein is essential for improving drug design and preventing adverse interactions. The present study was aimed to build URAT1 3D structures by homology modeling and to examine chemotherapeutic drugs binding to URAT1 and the interactions therein. Based upon BLAST results, glucose transporter GLUT1 (PDB ID: 4PYP) was considered as a template for homology modeling. Homology models were constructed and refined using MODELLER program and validated using PROCHECK in which 99.2% of residues present in the favored regions of the Ramachandran plots. To examine the response of proteins toward various inhibitors, molecular docking study was carried out and binding affinities was evaluated between -151 to -305 kcal/mol using MMGBSA method. Analysis of docked conformers showed that the residues ARG172, ARG325, LYS145 and ARG477 were involved with the most number of interactions with the drugs tested.
Introduction
In humans, hyperuricemia is caused by reduction in renal urate (the salt of uric acid) excretion, and leads to diseases such as gout, urolithiasis, hypertension and diabetes mellitus[1,2] as well as cardiovascular diseases and renal failure[3]. Gout is a medical condition characterized by repeated occurrences of acute inflammatory arthritis resulting from crystallization and deposition of uric acid into joints and surrounding tissues. Gout and resulted kidney disease[4] has become more prevalent in recent decades, affecting about 1 - 2% of the population at some point in their lives[5]. The underlying cause of gout is the elevated levels of plasma uric acid resulting from diet, genetic predisposition, or under excretion of urate[6]. Given these considerations, the development of novel compounds that could lower serum uric acid levels could be therapeutically important.
Due to the lack of uricase in humans, uric acid is the final metabolite of purine[7] and serum uric acid levels highly depends on the renal elimination function[8], thus 70% of the daily output of uric acid is excreted through the kidney[9] and 80 to 90% of gouty patients are under excreters. Thus, the renal handling of urate transport constitutes an important target in the development of drugs to treat hyperuricemia. Urate is readily filtered by the kidney; it is both reabsorbed and secreted along the nephron. The cells lining the nephron contain specific transporters in contact with the urine, especially human uric acid transporter 1 (URAT1; SLC22A12)[10], which was mainly identified and demonstrated to mediate urate handling in the human kidney. It is a member of the organic anion transporter family and is expressed only in the kidney, where the protein is located at the apical membrane of the epithelium in the proximal tubules but not in the distal tubules. It is encoded by a gene (SLC22A12) located on chromosome 11q13 and is believed to regulate the reabsorption of urate from the lumen to the cytosol in the human kidney proximal tubules.
Uricosurics[11] including Benzbromarone, Sulfinpyrazone, Probenicid, Morin, Benzarone, 6-hydroxybenzbromarone, Indomethacin, E3040, Losartan, Irbesartan and Fenofibrate are drugs that act directly on the renal tubule and increase uric acid renal excretion by inhibiting urate reabsorption (Figure 1). Among them, benzbromarone effectively reduces serum urate levels[12], with most people achieving normal uric acid values. Sulfinpyrazone is a uricosuric medication used to treat gout[11,13]. Like other uricosurics, sulfinpyrazone works by competitively inhibiting uric acid reabsorption in the proximal tubule of the kidney. Probenicid is one of the currently prescribed uricosuric agents used in the treatment of hyperuricemia[14]. The natural compound, morin, which exhibits potent inhibitory action on urate uptake in rat renal brush-border membrane vesicles with IC50 of 18 μM, has an inhibitory effect on urate uptake is much more potent than that of probenecid, making this compound a potential candidate for further development into a therapeutic for the treatment of hyperuricemia in humans taking the advantage of low toxicity[15]. Benzarone and 6-hydroxybenzbromarone are produced in the human liver and excreted into urine through hydroxylating benzbromarone and have a chemical structure similar to that of benzbromarone[12]. Indomethacin and salicylate were shown to enhance the urinary excretion of urate by inhibiting urate reabsorption through URAT1 in vivo[11]. E3040 was originally developed as a novel anti-inflammatory drug and was used in the treatment of bowel diseases and has also been shown to have a uricosuric effect and to competitively inhibit urate uptake into BBMV from the rat renal cortex[16]. Losartan has been shown to increase urinary uric acid excretion and decrease serum uric acid level[17]. One report showed a tendency for irbesartan to decrease serum uric acid level in hypertensive patients with hyperuricemia[18]. Fenofibrate can significantly decrease serum uric acid levels by augmenting uric acid excretion[19].
In this study, we sought to perform homology modelling of URAT1, investigate its docking to chemotherapeutic drugs and probe the structural requirement(s) related to URAT1 inhibition in silico. Earlier, Xenopus oocytes expressing URAT1 were used as an in vitro method to assess the interactions of novel compounds for their ability to inhibit 14C-uric acid uptake via human URAT1[20]. Nowadays, in silico models provide fast, inexpensive and non-laborious screening platform to identify URAT1 inhibitors which gives promising and valuable results. Various computational approaches were developed to predict human URAT1 inhibitors such as pharmacophore modelling[21], quantitative structure activity relationship (QSAR) analysis[22] and molecular docking[23]. These studies have identified many drugs that may be useful in targeting URAT1[24]. In this study, we have discussed the results from computational approaches used to assess the binding of URAT1 to the uricosuric agents such as Benzbromarone, Sulfinpyrazone, Probenicid, Morin, Benzarone, 6-hydroxybenzbromarone, Indomethacin, E3040, Losartan, Irbesartan, and Fenofibrate.
Materials and Methods
Homology Modeling of URAT1: The 3D structure of hURAT1 was generated using the MODELER[6]. A BLAST search of PDB indicated the significant sequence identity (27%) between URAT1 and glucose transporter GLUT1 possessing the best E-value of 2 × 10⁻⁴ among all of the search results, including the protein sequence of transporters. Unanimously, the crystal structure of glucose transporter GLUT1 (PDB ID: 4PYP; resolution 3.17 Å) was selected as the template[25]. The transporter was co-crystallized with B-nonylglucoside. The output file for the sequence alignment of the target (URAT1) and template (GLUT1) was generated using the sequence analysis module of DS3.0. Before this output file served as an input for the design of the homology model, the health of this template structure was checked using the protein health module. Homology modelling was performed using knowledge-based model build method in Modeller[26], with the number of models to be set to 5. Amongst these five generated models, the model with the lowest energy was selected for further refinement, comprising of loop refinementand energy minimization. The final model was validated using PROCHECK[27]. The active site/binding site of URAT1 was identified using the binding site analysis tool of DS3.0, which identified several binding sites. Then these binding sites were compared with the template GLUT1. The prepared protein was then used for docking.
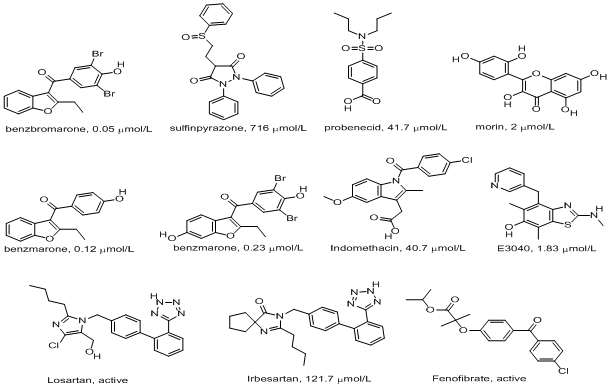
Figure 1: Structures of chemotherapeutic drugs tested in this study.
Ligand preparation and molecular docking: The structure of URAT1 modelled above was used for docking. The in silico docking studies were carried out by using the CDOCKER of receptor-ligand interaction protocol section of Discovery Studio 3.0. CDOCKER is a grid-based molecular dynamics-simulated- annealing-based algorithm docking procedure that utilizes CHARMm force fields[28]. It allows full ligand flexibility in the docking process by producing several ligand poses when the ligand is docked into the receptor’s binding site and by applying molecular dynamics-based simulated annealing and in situ minimization. Initially there was a pre-treatment process for both the protein and ligands. The structures of uricosuric agents (Figure 1) known to inhibit URAT1 were used for docking. Ligand preparation was done using the Prepare Ligand module in receptor- ligand interaction tool of Discovery Studio 3.0 and the prepared ligand was used for docking. Protein preparation was done using the Prepare Protein module of receptor-ligand interaction tool of Discovery Studio 3.0 and that was used for docking. The active site was selected based on the ligand binding domain of B-nonylglucoside and then the pre-existing ligand was removed and the prepared ligands were added. The most favorable docked pose was selected according to the minimum free energy of the protein-ligand complex and analyzed to investigate the interaction. Approximately 11 compounds were docked in this work.
Estimation of ligand binding energy: The ligand binding energy of each ligand to URAT1 was estimated using Molecular Mechanics-Generalized Born-Solvent Accessibility (MM-GBSA) method. The total free energy of binding, δGbind (kcal/mol) is estimated as:
δGbind = energy of complex (minimized)
- energy of ligand (minimized)
- energy of receptor (minimized)
wherein each energy term is a combination of coulomb energy, covalent binding energy, Van der Waals energy, lipophilic energy, generalized Born electrostatic solvation energy, hydrogen- bonding energy, Pi-Pi packing energy, and self-contact correction.
Results and discussion
Hyperuricemia and gout arises from abnormal production by liver or excretion by kidney of uric acids. We have mainly focussed our investigation on uricosurics associated with URAT1 due the high malignancy and high incidence of kidney dysfunction induced hyperuricemia. We have investigated chemotherapeutic drugs binding to URAT1 as experimental studies have shown these compounds interact with this protein.
Molecular modelling of URAT1: Among the experimentally determined structures of transporters, human glucose transporter GLUT1 (PDB ID: 4PYP) was found to be the most appropriate template for URAT1.
The initial search for templates for homology modelling of URAT1 through BLAST search revealed GLUT1 (PDB ID: 4PYP) as the best template for modelling with a sequence identity of 27%. The sequence alignment between URAT1 and GLUT1 has been presented in Figure 2. Hence, the 3 dimensional structure of GLUT1 was used as template for model generation (Figure 3).
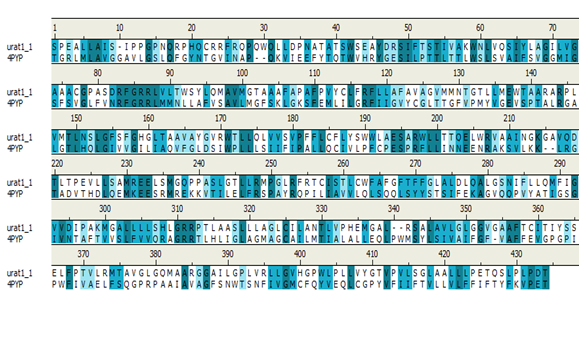
Figure 2: Alignment between URAT1 and GLUT1.
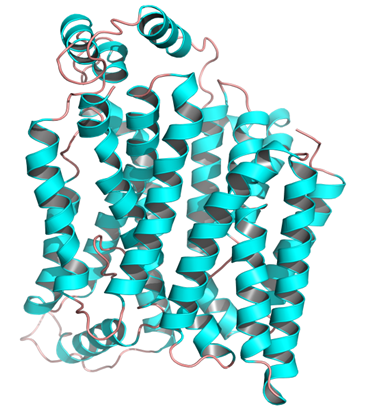
Figure 3: Homology modelled structure of URAT1.
The model generated via Modeller (9v12) was then validated via Ramachandran plot (Figure 4). Analysis of the plot revealed 99.2% of the residues were in the favoured regions with 18.1 in the additional allowed regions and 0.8% of the amino acids were in the disallowed regions indicating a superior structure comparing with the template GLUT1 determined by experiment (6 residues in disallowed areas; 1.3%). These -values support the validity of the modelled structure and hence this structure was used for docking studies.
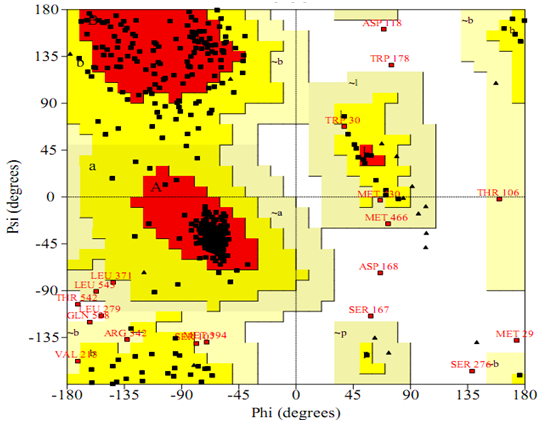
Figure 4: Ramachandran map of URAT1 model.
Analysis of docking results: The results of our docking analysis, pertaining to each drug are presented below. The docking scores and binding affinities are presented in Table 1.
Table 1: Docking and ligand binding free energy score of URAT1 with chemotherapeutic drugs.
| Drug name | Pubchem ID | -CDOCKER_energy (kcal/mol) | -CDOCKER_interaction_energy (kcal/mol) | Binding energy (kcal/mol) |
| Benzbromarone | 2333 | -2.8226 | 30.0325 | -158.3652 |
| Sulfinpyrazone | 5342 | -169.7192 | ||
| Probeinecid | 4911 | 37.2357 | 44.1278 | -298.6527 |
| Morin | 5281670 | 31.7000 | 43.1627 | -305.0004 |
| Benzarone | 255968 | 21.3066 | 34.8105 | -151.2299 |
| 6-Hydroxybenzbromarone | 10320994 | -4.0170 | 33.0751 | -189.3237 |
| Indomethacin | 3715 | - | - | -177.8571 |
| E3040 | 443292 | -2.5898 | 22.8849 | -158.8069 |
| Losartan | 3961 | - | - | -163.0648 |
| Irbesartan | 3749 | - | - | -175.4781 |
| Fenofibrate | 3339 | - | - | -229.2380 |
Benzbromarone: Through CDOCKER we found that, benzbromarone has CDOCKER energy of 2.82266 kcal/mol and CDOCKER interaction energy of -158.3652 kcal/mol. Analysis of the docked complex showed that the residues GLU326 and ARG325 were involved in hydrogen bonding with benzbromarone. The residues ARG172, ARG325 and LYS145 were involved in cation-Pi bonding with the ligand. ARG325 and GLU326 were observed to form H bonds with the O atom and H atom of hydroxyl attached to the phenyl moiety of benzbromarone. ARG325 and LYS15 were observed to interact via cation-Pi bonds with the bicyclic moieties. ARG172 were involved in bonding via cation-π linkages with the benzene ring of benzbromarone.
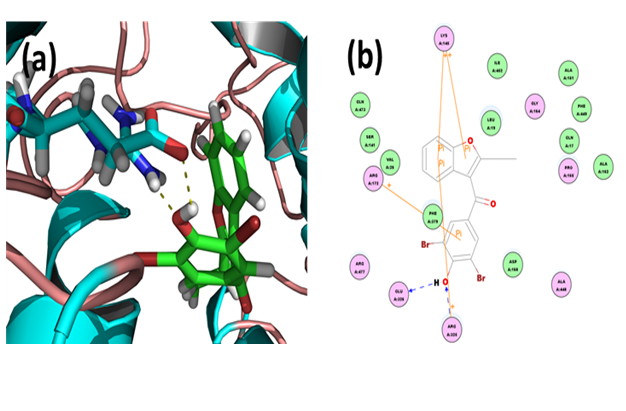
Figure 5: Docked complex of URAT1 and benzbromarone. (a) Structural view: yellow dashed lines indicate hydrogen bonds. (b) Ligand interaction diagram: blue lines represent hydrogen bonds.
Sulfinpyrazone: Analysis of the docked complex showed that the residues ARG172 and ARG477 were involved in hydrogen bonding with sulfinpyrazone. The residues ARG172 and ARG477 were involved in cation-Pi bonding with the ligand while PHE379 was involved in π-π interaction with the ligand. ARG172 and ARG477 formed H bonds with the O atoms of carbonyl groups attached to the pyrazolidine moiety of sulfinpyrazone. ARG325 and ARG477 interacted via cation-Pi bonds with the diphenyl moieties in sulfinpyrazone respectively. PHE379 was involved in bonding via Pi-Pi linkages with the benzene ring of sulfinpyrazone.
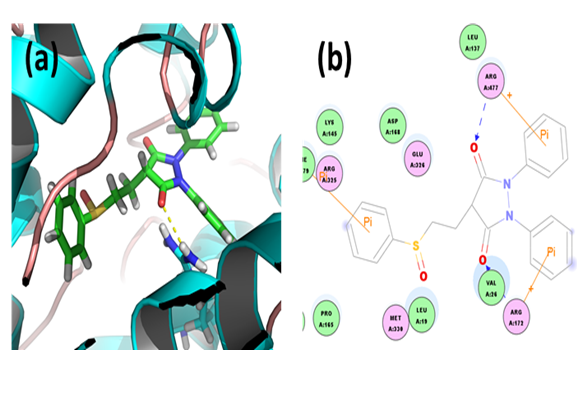
Figure 6: Docked complex of URAT1 and sulfinpyrazone. (a) Structural view: yellow dashed lines indicate hydrogen bonds. (b) Ligand interaction diagram: pink lines represent hydrogen bonds.
Probenecid: Through CDOCKER we found that, probenecid has CDOCKER energy of -37.2357 kcal/mol and CDOCKER interaction energy of -44.1278 kcal/mol. And the ligand-receptor binding energy is -298.6527 kcal/mol. Analysis of the docked complex showed that the residues ARG172, LYS145 and ARG477 were involved in hydrogen bonding with probenecid. The residue ARG477 was involved in cation-Pi bonding with the ligand. ARG172 and ARG477 were observed to form H bonds with the O atoms of carboxyl group attached to the benzoic moiety of probenecid. LYS145 were observed to interact via H bond with sulfamoyl moieties. ARG477 were involved in bonding via cation-Pi linkages with the benzene ring of probenecid.
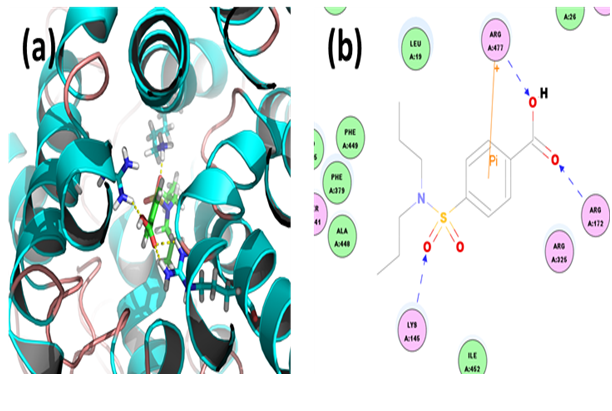
Figure 7: Docked complex of URAT1 and probenecid. (a) Structural view: yellow dashed lines indicate hydrogen bonds. (b) Ligand interaction diagram: pink lines represent hydrogen bonds.
Morin: Through CDOCKER we found that, morin has CDOCKER energy of -31.7 kcal/mol and CDOCKER interaction energy of -43.1627 kcal/mol. And the ligand-receptor binding energy is -305.0004 kcal/mol. Analysis of the docked complex showed that the residues ALA448, LYS145 and ARG172 were involvedin hydrogen bonding with morin. The residues ARG325, ARG477 and ARG172 were involved in cation-Pi bonding with the ligand. LYS145 was observed to form H bonds with the O atoms of hydroxyl and carbonyl attached to the dicyclic moiety of morin. ALA448 and ARG172 were observed to interact via H bonds with hydroxyl groups attached to the bicyclic and phenyl moieties respectively. ARG172, ARG325 and ARG477 were involved in bonding via cation-Pi linkages with the benzene ring of morin.
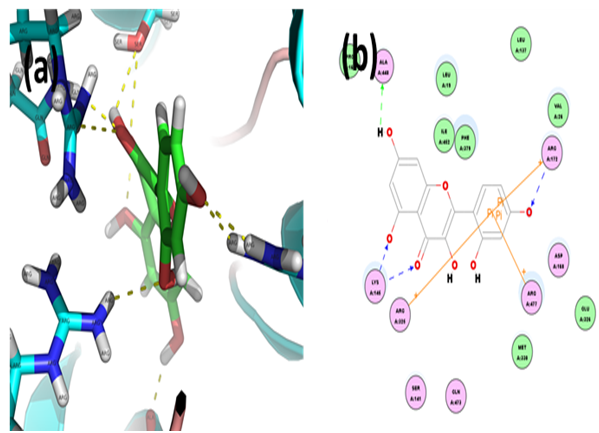
Figure 8: Docked complex of hURAT1 and morin. (a) Structural view: yellow dashed lines indicate hydrogen bonds. (b) Ligand interaction diagram: green and blue lines represent hydrogen bonds and brown lines cation-Pi bonds.
Benzarone: Through CDOCKER we found that, benzarone has CDOCKER energy of -21.3066 kcal/mol and CDOCKER interaction energy of -34.8105 kcal/mol. And the binding energy of ligand-receptor was -151.2299 kcal/mol. Analysis of the docked complex showed that the residues ALA448 and ARG172 were involved in hydrogen bonding with morin. The residues ARG325 were involved in cation-Pi bonding with the ligand. ARG172 was observed to form H bonds with the O atoms of carbonyl attached to the methylene between the dicyclic and benzene moieties of benzarone. ALA448 were observed to interact via H bonds with hydroxyl groups attached to the phenyl moiety. ARG325 were involved in bonding via cation-Pi linkages with the furan ring of benzarone.
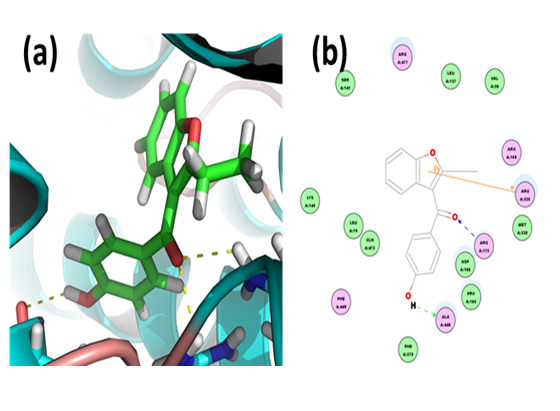
Figure 9: Docked complex of hURAT1 and benzarone. (a) Structural view: yellow dashed lines indicate hydrogen bonds. (b) Ligand interaction diagram: green and blue lines represent hydrogen bonds and brown lines cation-Pi bonds.
6-Hydroxybenzbromarone
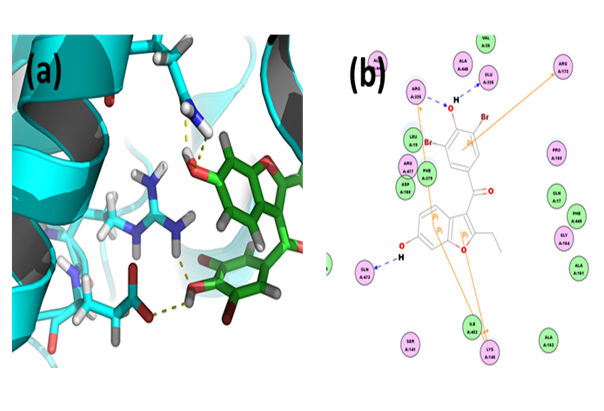
Figure 10: Docked complex of hURAT1 and 6-Hydroxybenzbromarone. (a) Structural view: yellow dashed lines indicate hydrogen bonds. (b) Ligand interaction diagram: green and blue lines represent hydrogen bonds and brown lines cation-Pi bonds.
Through CDOCKER we found that, 6-Hydroxybenzbromarone has CDOCKER energy of -4.01701 kcal/mol and CDOCKER interaction energy of -33.0751 kcal/mol. And the binding energy of ligand-receptor was -189.3237 kcal/mol. Analysis of the docked complex showed that the residues GLN473, ARG325 and GLU326 were involved in hydrogen bonding with 6-hydroxybenzbromarone. The residues ARG325, ARG172 and LYS145 were involved in cation-Pi bonding with the ligand. GLN473 was observed to form H bonds with the O atoms of hydroxyl group attached to the dicyclic moiety of 6-hydroxybenzbromarone. ARG325 and GLU326 were observed to interact via H bonds with hydroxyl groups attached to the phenyl moiety. ARG325 and LYS145 were involved in bonding via cation-Pi linkages with the dicyclic moiety and ARG172 with the benzene group.
Indomethacin: Through docking we found that, indomethacin has a binding energy of 177.8571 kcal/mol with the target. Analysis of the docked complex showed that the residues ARG477 and ARG325 were involved in hydrogen bonding with indomethacin. The residues LYS145 were involved in cation-Pi bonding with the ligand. ARG477 and ARG325 was observed to form H bonds with the O atoms of carbonyl group and ether group attached to the dicyclic moiety of indomethacin respectively. LYS145 were involved in bonding via cation-Pi linkage with the dicyclic moiety.
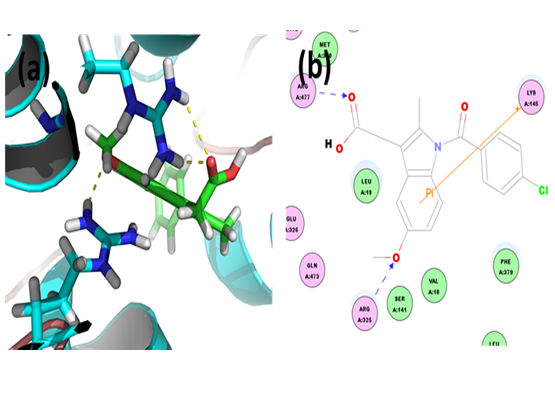
Figure 11: Docked complex of hURAT1 and indomethacin. (a) Structural view: yellow dashed lines indicate hydrogen bonds. (b) Ligand interaction diagram: green and blue lines represent hydrogen bonds and brown lines cation-Pi bonds.
E3040: Through CDOCKER we found that, E3040 has CDOCKER energy of -2.58985 kcal/mol and CDOCKER interaction energy of -22.8849 kcal/mol. And the binding energy of ligand-receptor was -158.8069 kcal/mol. Analysis of the docked complex showed that the residues ASP168, SER141 and ARG477 were involved in hydrogen bonding with E3040. The residues ASP168, SER141 and ARG477 were involved in cation-Pi bonding with the ligand. ASP168 was observed to interact via H bonds with amino groups attached to the bicyclic moiety. SER141 and ARG477 were involved in bonding via H bond linkages with the hydroxyl group attached to bicyclic moiety.
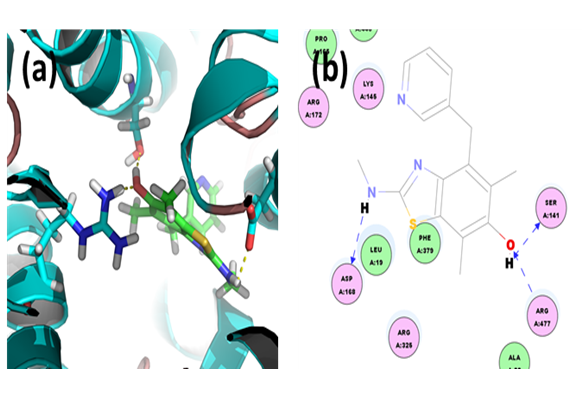
Figure 12: Docked complex of hURAT1 and E3040. (a) Structural view: yellow dashed lines indicate hydrogen bonds. (b) Ligand interaction diagram: green and blue lines represent hydrogen bonds and brown lines cation-Pi bonds.
Losartan: Through docking we found that the binding energy of ligand-receptor was -163.0648 kcal/mol. Analysis of the docked complex showed that the residues SER66 and ARG477 were involved in hydrogen bonding with losartan. The residues ARG477 were involved in cation-Pi bonding with the ligand. SER66 was observed to interact via H bonds with N-H groups attached to the imidazol moiety. ARG477 were involved in bonding via H bond linkages with the hydroxyl group attached to tetrazol moiety. Also, ARG477 interacts with the three cyclic moieties consisting of phenyl, tetrazol and imidazole groups through cation-Pi linkages.
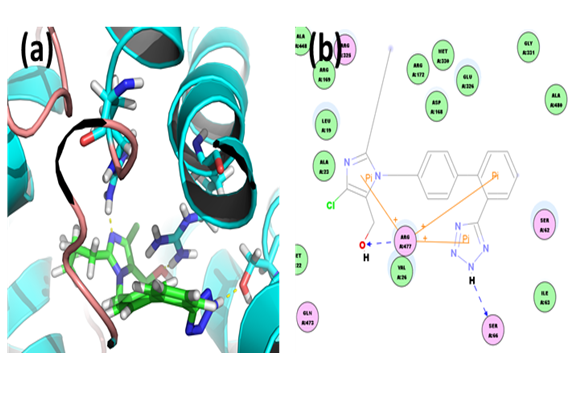
Figure 13: Docked complex of hURAT1 and Losartan. (a) Structural view: yellow dashed lines indicate hydrogen bonds. (b) Ligand interaction diagram: green and blue lines represent hydrogen bonds and brown lines cation-Pi bonds.
Irbesartan: Through docking we found that the binding energy of ligand-receptor was -175.4781 kcal/mol. Analysis of the docked complex showed that the residues ARG477 were involved in hydrogen bonding with irbesartan. The residues ARG172 and ARG325 were involved in cation-Pi bonding with the ligand. ARG477 was observed to interact via H bonds with O atom of carbonyl group attached to the diazaspiro moiety. ARG172 and ARG325 were involved in bonding via cation-Pi linkages with the two phenyl groups respectively.
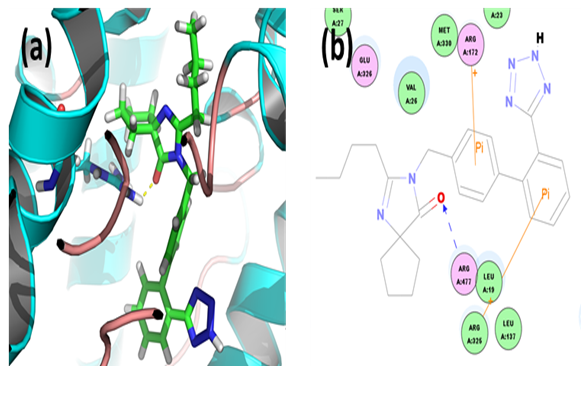
Figure 14: Docked complex of hURAT1 and Irbesartan. (a) Structural view: yellow dashed lines indicate hydrogen bonds. (b) Ligand interaction diagram: green and blue lines represent hydrogen bonds and brown lines cation-Pi bonds.
Fenofibrate: Through docking we found that the binding energy of ligand-receptor was -229.2380 kcal/mol. Analysis of the docked complex showed that the residues SER141, ARG172 and ARG477 were involved in hydrogen bonding with fenofibrate. The residue ARG325 was involved in cation-Pi bonding with the ligand. ARG477 was observed to interact via H bonds with O atom of ether group attached to the phenyl moiety. SER141 and ARG172 were involved in bonding via H bond linkages with the two carbonyl groups respectively. ARG325 interacted with the phenyl group through cation-Pi bond.
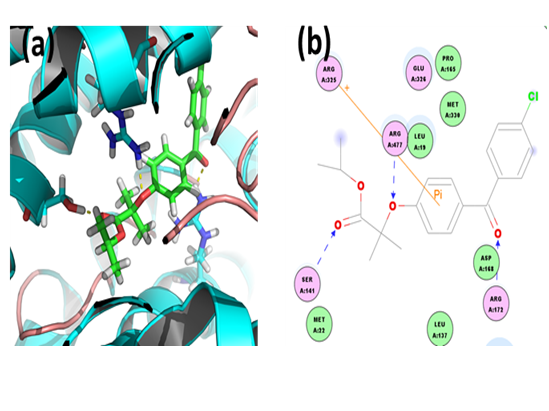
Figure 15: Docked complex of hURAT1 and Fenofibrate. (a) Structural view: yellow dashed lines indicate hydrogen bonds. (b) Ligand interaction diagram: green and blue lines represent hydrogen bonds and brown lines cation-Pi bonds.
Residue frequencies: Analysis of docked conformers showed that the residues ARG172, ARG325, LYS145 and ARG477 were involved with the most number of interactions with the drugs tested. Further, the highest frequency of residue interactions was observed.
Conclusion
In the present study, our target protein URAT1 was homology modelled and tested for docking against various chemotherapeutic agents including benzbromarone, sulfinpyrazone, probenicid, morin, benzarone, 6-hydroxybenzbromarone, indomethacin, E3040, losartan, irbesartan, Fenofibrate and salicylate to understand drug-target interactions. Constructed structure of URAT1 has 99.2% of residues in the favoured regions of the Ramachandran plots, suggesting high quality of it. Molecular docking study was carried out and binding affinities was evaluated between -151 to -305 kcal/mol using MMGBSA method. Analysis of docked conformers showed that the residues ARG172, ARG325, LYS145 and ARG477 were involved with the most number of interactions with the drugs tested. The identification of 3D structures, binding modes for various inhibitive molecules will guide us designing molecular tools for therapeutic intervention that may prove useful in numerous diseases associated with uric acid levels.
Acknowledge:
This work was supported by grants from Nanyue Talent Program of Microbiology of Guangdong Microbiology Institute (GDIMYET20140204), Science and Technology Program of Guangdong (2015A020211021) and Science and Technology Program of Guangzhou (2015042817082572).
References
- 1. Saag, K.G., Choi, H. Epidemiology, risk factors, and lifestyle modifications for gout. (2006) Arthritis Res Ther 8 (Suppl 1): S2.
Pubmed || Crossref || Others - 2. Anzai, N., Jutabha, P., Endou, H. Renal Solute Transporters and Their Relevance to Serum Urate Disorder. (2010) Current Hypertension Reviews 6:148-154.
Pubmed || Crossref || Others - 3. Choi, H.K., Mount, D.B., Reginato, A.M. Pathogenesis of Gout. (2005) Ann Intern Med 143: 499-516.
Pubmed || Crossref || Others - 4. Hwang, S.J., Lin, M.Y., Chen, H.C. Prevalence of chronic kidney disease in China. (2012) The Lancet 380: 1
Pubmed || Crossref || Others - 5. Choi, H.K., Curhan, G. Gout: epidemiology and lifestyle choices. (2005) Curr Opin Rheumatol 17: 341-345.
Pubmed || Crossref || Others - 6. Hak, A.E., Choi, H.K. Lifestyle and gout. (2008) Current opinion in rheumatology 20: 179-186.
Pubmed || Crossref || Others - 7. Terkeltaub, R. Update on gout: new therapeutic strategies and options. (2010) Nat Rev Rheumatol 6: 30-38.
Pubmed || Crossref || Others - 8. Kutzing, M.K., Firestein, B.L. Altered uric acid levels and disease states. (2008) J Pharmacol Exp Ther 324: 1-7.
Pubmed || Crossref || Others - 9. Anzai, N., Kanai, Y., Endou, H. New insights into renal transport of urate. (2007) Current opinion in rheumatology19: 151-157.
Pubmed || Crossref || Others - 10. Enomoto, A., Kimura, H., Chairoungdua, A., et al. Molecular identification of a renal urate anion exchanger that regulates blood urate levels. (2002) Nature 417: 447-452.
Pubmed || Crossref || Others - 11. Shin, H.J., Takeda, M., Enomoto, A., et al. Interactions of urate transporter URAT1 in human kidney with uricosuric drugs. (2011) Nephrology16: 156-162
Pubmed || Crossref || Others - 12. Mc.Donald, M.G., Rettie, AE. Sequential metabolism and bioactivation of the hepatotoxin benzbromarone: formation of glutathione adducts from a catechol intermediate. (2007) Chemical research in toxicology 20: 1833-1842.
Pubmed || Crossref || Others - 13. Terkeltaub, R., Bushinsky, D.A., Becker, M.A. Recent developments in our understanding of the renal basis of hyperuricemia and the development of novel anti hyperuricemia therapeutics. (2006) Arthritis Res Ther 8 (Suppl 1): S4.
Pubmed || Crossref || Others - 14. Lee, M.H., Graham, G.G., Williams, K.M., et al. A benefit-risk assessment of benzbromarone in the treatment of gout. Was its withdrawal from the market in the best interest of patients? (2008) Drug safety 31: 643-665.
Pubmed || Crossref || Others - 15. Yu, Z., Fong, W.P., Cheng, C.H. Morin (3, 5, 7, 2’, 4’-pentahydroxyflavone) exhibits potent inhibitory actions on urate transport by the human urate anion transporter (hURAT1) expressed in human embryonic kidney cells. (2007) Drug Metab Dispos 35: 981-986.
Pubmed || Crossref || Others - 16. Yamada, H., Kotaki, H., Itoh, T, et al. Effect of anti-inflammatory bowel disease drug, E3040, on urate transport in rat renal brush border membrane vesicles. (2000) Eur J Pharmacol 406: 45-48.
Pubmed || Crossref || Others - 17. Khan, M., Khan, R.A, Islam, F., et al. To study the efficacy of Losartan on urinary uric acid excretion in Thiazide induced hyperuricemia and hypertensive patients. (2011) Pak J Pharmaceutical sciences 24: 583-587.
Pubmed || Crossref || Others - 18. Wurzner, G., Gerster, J.C., Chiolero, A. et al. Comparative effects of losartan and irbesartan on serum uric acid in hypertensive patients with hyperuricemia and gout. (2001) J Hypertension 19: 1855-1860.
Pubmed || Crossref || Others - 19. Elisaf, M., Tsimichodimos, V., Bairaktari, E., et al. Effect of micronized Fenofibrate and losartan combination on uric acid metabolism in hypertensive patients with hyperuricemia. (1999) J Cardiovasc Pharm 34: 60-63.
Pubmed || Crossref || Others - 20. Wempe, M.F., Jutabha, P., Quade, B., et al. Developing potent human uric acid transporter 1 (hURAT1) inhibitors. (2011) J Med Chem 54: 2701-2713.
Pubmed || Crossref || Others - 21. Zhao, W., Gu, Q., Wang, L., et al. Three-Dimensional Pharmacophore Modelling of Liver-X Receptor Agonists. (2011) J Chem info and modelling 51: 2147-2155.
Pubmed || Crossref || Others - 22. Evans, D.A., Doman, T.N., Thorner, D.A., et al. 3D QSAR Methods: Phase and Catalyst Compared. (2007) J Chem info and modelling 47: 1248-1257.
Pubmed || Crossref || Others - 23. Elokely, K.M., Doerksen, R.J. Docking Challenge: Protein Sampling and Molecular Docking Performance. (2013) J Chem info and modelling 53: 1934-1945.
Pubmed || Crossref || Others - 24. Peng, J., Hu, Q., Gu, C., et al. Discovery of potent and orally bioavailable inhibitors of Human Uric Acid Transporter 1 (hURAT1) and binding mode prediction using homology model. (2016) Bioorganic & Medicinal Chemistry Letters 26: 277-282
Pubmed || Crossref || Others - 25. Deng, D., Xu, C., Sun, P., et al. Crystal structure of the human glucose transporter GLUT1. (2014) Nature 510: 121-125.
Pubmed || Crossref || Others - 26. Eswar, N., Eramian, D., Webb, B., et al. Protein structure modelling with MODELLER. (2008) Methods in molecular biology (Clifton, NJ) 426: 145-159.
Pubmed || Crossref || Others - 27. Laskowski, R.A., Mac. Arthur, M.W., Moss, D.S., et al. PROCHECK: a program to check the stereochemical quality of protein structures. (1993) J Appl Crystallogr 26: 283-291.
Pubmed || Crossref || Others - 28. Wu, G., Robertson, D.H., Brooks, C.L., et al. Detailed analysis of grid-based molecular docking: A case study of CDOCKER-A CHARMm-based MD docking algorithm. (2003) J Comput Chem 24: 1549-1562.
Pubmed || Crossref || Others


