
Influence of Healthy Living Habits in the Triggering of HIV Lipodystrophy Syndrome
Andressa Rodrigues Ramos Reis1, Tuane Rodrigues de Carvalho1, Paulo Adriano Schwingel2, Vaníria Auxiliadora Guedes Brandão3, Iracema Hermes Pires de Mélo Montenegro4
Affiliation
- 1Graduate in Nutrition. University of Pernambuco, Petrolina Campus, College of Nutrition. Petrolina, PE, Brazil.
- 2Doctor in Medicine and Health. University of Pernambuco, Petrolina Campus, College of Nutrition. Petrolina, PE, Brazil.
- 3Specialist in Gerontology and Public Health. University of Pernambuco, Petrolina Campus, College of Nutrition. Petrolina, PE, Brazil.
- 4Doctor in Nutrition. University of Pernambuco, Petrolina Campus, College of Nutrition. Petrolina, PE, Brazil.
Corresponding Author
Iracema Hermes Pires de Mélo Montenegro, University of Pernambuco, Petrolina Campus, College of Nutrition, BR 203, Km 2 - Vila Eduardo, Petrolina - PE, 56328-903, Tel: (87) 3866-6468; Fax: (87) 3866-6470; E-mail: iracemamelo@hotmail.com
Citation
de Melo Montenegro, I.H., et al. Influence of Healthy Living Habits in the Triggering of HIV Lipodystrophy Syndrome. (2016) Int J Food Nutr Sci 3(2): 343-349.
Copy rights
© 2016 de Melo Montenegro, I.H. This is an Open access article distributed under the terms of Creative Commons Attribution 4.0 International License.
Keywords
Acquired immunodeficiency syndrome; Lipodystrophy; Nutrition assessment; Food habits, Motor activity
Abstract
Patients in HAART (highly active antiretroviral therapy) showed peripheral fat loss, central fat accumulation and/or lipid and glucose metabolic manifestations, characteristics of HIV lipodystrophy syndrome (HIVLS). The present study aimed to assess the influence of healthy lifestyle habits on HIVLS effects. The sample included 51 volunteers with serum chemistry changes that matched lipodystrophy. Food Frequency and International Physical Activity - Short Form questionnaires were used to form the following groups: control (proper feed and active, N = 31) and study (inadequate feed and/or inactive, N = 20). The groups were assessed regarding body anthropometry and lipodystrophy severity. Both groups were formed by active individuals. A poor diet contributed to high waist-hip ratio in males from the study group (p < 0.05). In addition, a poor diet also contributed to body weight increase, which causes elevated blood glucose in patients with HIVLS. There was no interference of healthy living habits in HIVLS physical severity. However, anthropometric parameters and serum biochemistry monitoring can provide valuable information for early diagnosis of secondary morphological changes related to antiretroviral therapy.
Introduction
Since 1996, highly active antiretroviral therapy – HAART – has been reducing the incidence of opportunistic infections, viral load and consumptive syndromes associated with HIV[1]. In addition to the therapy advances and benefits aforementioned, it was noticed that patients undergoing HAART showed peripheral fat loss and/or central fat accumulation, besides possible lipid and glucose metabolic manifestations[2]. These changes were named HIV Lipodystrophy Syndrome (HIVLS), with prevalence ranging from 8 to 84%[3].
Lipodystrophy diagnosis is based on the assessment of the patient’s nutritional, metabolic and clinical status[4]. Thus, nutritional monitoring is essential to control HIVLS metabolic and physical changes and to maintain health and immunity[5,6]. Therefore, the present study aimed to evaluate the influence of healthy lifestyle habits on HIV Lipodystrophy Syndrome (HIVLS) effects in HIV/AIDS patients of a reference center from the municipality of Petrolina, Pernambuco state.
Methods
The present study was a retrospective cohort of patients with HIV/AIDS and HIV lipodystrophy syndrome (HIVLS) served by the Specialized Care (SC) from Petrolina-PE. For quantification of the number of subjects, WinPepi software was used[7]. The total population of people with HIV/AIDS and HIVLS in the institution under study (n = 117), α = 12: 05 bilateral statistics, 80% power, the estimated ratio of young adults in Brazil’s northeastern region with an anthropometric profile considered inadequate (10.8%)[8], 5% absolute accuracy around the estimation and a possible loss of 20% of volunteers were considered. A 2.0 risk was estimated for events in the exposed population, compared with the non-exposed population, and a 2: 1 ratio was obtained in a total of 60 HIV/AIDS patients with HIVLS (40 non-exposed and 20 exposed).
The study population consisted of subjects with HIV lipodystrophy syndrome (HIVLS) according to the following biochemical characteristics[4]: fasting glucose higher than 100 mg/dL, value by which impaired glucose tolerance is already identified, according to the Brazilian Society of Diabetes (2014)[9]; triglyceride levels higher than 150 mg / dL; total cholesterol higher than 200 mg / dl; HDL-cholesterol < 50 mg / dL for women or > 40 mg / dl for men; LDL-cholesterol > 160 mg / dL[10]. Information, such as sex, age, AIDS diagnosis time, antiretroviral therapy type, antiretroviral use time, beginning of biochemical changes and initial weight variables were collected from medical records.
Group formation
Food consumption data were collected through interviews with an average duration of 15 minutes using the Food Frequency Questionnaire (FFQ) based on Matarazzo et al[11], considered a practical and informative method for diet consumption assessment[12]. Interviews were conducted by a single evaluator, and confirmation questions were used to avoid research bias. Foods reported in the questionnaire were divided into the following groups: cereals, breads and tubers; fruits; vegetables; dairy products; meat and eggs; legumes; oils and fat; and sugars and sweets, classified according to the Brazilian Food Pyramid[13].
For food chemical composition analysis, NUTWIN 1.6 (2010) software was used to obtain macronutrient, total fat (g and %), saturated fat (g and %) and total cholesterol (mg) values. After diet quantitative analysis, qualitative evaluation was conducted by Adapted Healthy Eating Index (IASad). Each IASad component has a score ranging from zero to ten. After the individual values of each item were calculated, they were summed, and the total score of each individual was divided into the following categories, according to IASad: good quality (score of more than 100 points - Control group), in need of improvement (score between 71 - 100 points - Study Group) and poor quality (score of less than 71 points - Study Group)[14].
Physical activity level was determined by the International Physical Activity Questionnaire - Short Form (IPAQ), which gathers information on daily physical activity frequency and duration, and has a typical week or the last week as reference period[15,16]. The questionnaire was applied by a single evaluator, in order to avoid misinterpretations. Subjects were classified in active (with high physical activity level, ≥ 300 minutes/week, or moderate, 150 - 299 minutes/week) or inactive (low physical activity level, with less than 150 minutes per week)[16,17].
Thereby, the control group (C, n = 31) was formed by individuals with HIVLS who had adequate living habits, healthy eating and regular physical activity, with an active individual score in the IPAQ. The study group (E, n = 20) consisted of subjects with HIVLS who had poor eating habits and/or physical inactivity, with an inactive score, according to the response obtained by IPAQ. Both groups were similar regarding age, disease diagnosis time and antiretroviral type.
Anthropometric assessment
Weight, height, body mass index (BMI), arm (AC), waist (WC) and hip circumference (HC), triceps (TF), abdomen (AF) and suprailiac fold (SF) variables were collected by one trained evaluator. Weight and height were measured on a scale coupled with a Filizola anthropometer with capacity of 150 Kg and division scale of 0.1 kg. BMI was calculated and classified according to cutoff points established by WHO[18] and PAHO[19] for the elderly. AC was used for the assessment of nutritional status, and muscle tissue and subcutaneous fat peripheral distribution. Measurement was carried out through a tape measure with 0 - 150 cm scale and 0.1 cm resolution. Protocol and reference standard values by Frisancho[20] were used. Classification regarding suitability was conducted in accordance with Blackburn & Thornton[21].
For waist circumference and waist-hip ratio classification, which are risk factors for cardiovascular diseases, WHO cutoff points were used[22]. Through the sum of triceps, abdomen and suprailiac fold values, the obtained value was confronted with parameters set by Guedes[23]. Finally, the previously found fat percentages were classified using fat percentages established by Pollock & Wilmore[24] as cutoff points.
Lipodystrophy severity grading scale(LSGS)
Severity of Lipodystrophy syndrome physical changes in HIV/AIDS patients was evaluated according to the Lipodystrophy Severity Grading Scale (LSGS)[25]. Clinical evaluation takes into account reports of fat accumulation or loss by the patient and by one trained professional, with scores from 0 to 21. Patients are classified as having no severity (score 0), mild severity (score from 1 to 7), moderate severity (score from 8 to 14) or critical severity (score from 15 to 21)[10].
Statistical analysis
GraphPad Prism 6.0 software was used for data analysis. Food Frequency Questionnaire, International Physical Activity Questionnaire and Lipodystrophy Severity Grading Scale underwent descriptive analysis with tabular and graphical presentation, in percentage, mean and standard deviation presentation (normal data), and median and quartiles presentation (non-normal data). Anthropometric and LSGS data underwent statistical analysis of mean and standard deviation (normal data), median and quartiles (non-normal data) and maximum and minimum values, with normality test followed by Student’s t-test (normal data) or Mann-Whitney’s test (non-normal data) (p < 0.05). For correlation, Spearman’s test was used.
Results
Sample characterization
317 medical records were evaluated. Through collection of biochemical characteristics of patients treated by SC, it was observed that 117 patients had dyslipidemia or glucose intolerance. However, only 55 patients had laboratory tests performed within 6 months. Of these, 51 individuals were found and agreed to be research volunteers.
Sex differences were observed between groups (C = 45.16% men and 54.84% women vs. S = 50% men and 50% women). Both groups were similar regarding age, AIDS diagnosis, antiretroviral therapy type, antiretroviral use time and initial weight (Table 1). As for antiretroviral types used by the subjects, it was observed that drugs belonged to the following four groups: Reverse-transcriptase nucleoside inhibitors (C = 56.89% vs. S = 58.82%), protease inhibitors (C = 27.60% vs. S = 20.60%), reverse-transcriptase non-nucleoside inhibitors (C = 15.51% vs. S = 19.11%) and integrase inhibitors (C = 0.00% vs. S = 1.47%).
Table 1: Variables of control (N = 31) and study (N = 20) individuals with HIVLS from Petrolina, PE (2014), analyzed on minimum, maximum, mean and standard deviation values.
| Control group (N = 31) | Study group (N = 20) | |||||
|---|---|---|---|---|---|---|
| 1ºQuartil | Median | 3ºQuartil | 1ºQuartil | Median | 3ºQuartil | |
| Age (years) | 39 | 47 | 57 | 37,5 | 47 | 48 |
| Diagnostic time (months) | 42 | 96 | 143 | 16 | 34 | 84,75 |
| Start time of biochemical changes (months) | 25 | 42 | 114 | 12 | 31 | 99,75 |
| Weigth at start of treatment (Kg) | 54,5 | 63,6 | 70 | 47,3 | 66,35 | 76,28 |
| Current weigth (Kg) | 58,8 | 66 | 74 | 56,63 | 69,20 | 80,90 |
Lipodystrophy was observed in both groups by biochemical profile alteration (Table 2). There was no statistical difference between biochemical variables among control and study groups. Statistical difference between the groups could probably be found with a larger sample.
Table 2: Biochemical profile of control (N = 31) and study (N = 20) individuals with HIVLS from Petrolina, PE (2014), analyzed on minimum, maximum, mean and standard deviation values.
| Control group (N = 31) | Study group (N = 20) | |||||
|---|---|---|---|---|---|---|
| 1ºQuartil | Median | 3ºQuartil | 1ºQuartil | Median | 3ºQuartil | |
| Glycemia (mg/dL) | 81 | 90 | 98 | 82,43 | 90 | 107 |
| Triglycerides (mg/dL) | 160,8 | 215 | 254 | 165 | 244,5 | 504 |
| Total cholesterol (mg/dL) | 179,8 | 209,5 | 237,3 | 176,8 | 221,5 | 253,3 |
Group formation
The sample was divided into groups, according to living habits (C = adequate feed [with good quality] and active, S = inadequate feed and active). As for diet, the study group had lower feed quality, according to the Adapted Healthy Eating Index (IASad) regarding quality, quantity and variety values in the consumption of different food groups (cereals, breads and tubers; fruits; vegetables; dairy products; meat and eggs; legumes; oils and fat; and sugars and sweets) quality, and variety, compared to the control group, which had better feed quality (C = 108.42 ± 6.21 vs. 94.06 S = ± 6.66, p < 0.05). Thus, the study group had less food variety and lower intake of food belonging to dairy, fruit and vegetable groups compared to the control group. It was also observed that the study group ate higher amounts total fat, saturated fat, and cholesterol amounts. Regarding physical activity level, both groups were considered active, according to the average physical activity level in minutes (S = 1072.50 ± 934.07 vs. C= 940.55 ± 823.90; p > 0.05). Predominant physical activities were, as follows: walking for at least 10 minutes, as a mean of transportation, leisure or exercise (49%); moderate activities, such as household chores (40%); vigorous activities, such as playing soccer, doing heavy work, and cycling (10%); and physical exercises, such as a running or going to the gym (4%).
Anthropometric assessment
There was similarity between groups regarding anthropometric measurements, except for waist-hip ratio increase in men from the study group (Table 3). Average BMI for the adult age group (C = 26.12 ± 4.52 vs. S = 25.82 ± 6.79) showed an overweight trend. As for the elderly, average BMI showed low weight for the control group, while showing low weight and overweight for the study group, which is a concern regarding nutritional status in this age group (C = 21.10 ± 3.65 vs. S = 25.71 ± 4.87).
Table 3: Anthropometric assessment of control (N = 31) and study (N = 20) individuals with HIVLS from Petrolina, PE (2014), analyzed on mean and standard deviation values.
| Control group (N = 31) | Study group (N = 20) | |||||
|---|---|---|---|---|---|---|
| 1ºQuartil | Median | 3ºQuartil | 1ºQuartil | Median | 3ºQuartil | |
| Weigth (Kg) | 58,80 | 66,00 | 74,00 | 56,63 | 69,20 | 80,90 |
| Heigth (m) | 1,55 | 1,60 | 1,68 | 1,58 | 1,64 | 1,76 |
| Body mass Index (Kg/m²) | 22,42 | 25,60 | 27,96 | 21,52 | 23,99 | 28,33 |
| Arm circumference – AC (cm) | 26,75 | 29,00 | 32,10 | 26,00 | 29,0 | 32,00 |
| Adequacy of AC (%) | 85,34 | 92,72 | 103,40 | 87,42 | 93,02 | 101,80 |
| Waist circumference (cm) | ||||||
| Men | 85,75 | 92,25 | 98 | 85,18 | 92,5 | 97,2 |
| Women | 79,55 | 89 | 98,05 | 80,7 | 86,6 | 96,28 |
| Hip circumference (cm) | 95 | 98,3 | 106 | 96,2 | 100 | 105,5 |
| Abdominal circumference (cm) | 87 | 91,6 | 101,2 | 86,63 | 93 | 103,1 |
| Waist/ hip ratio | ||||||
| Men | 0,89 | 0,92 | 0,97 | 0,98 | 0,98* | 0,98 |
| Women | 0,82 | 0,89 | 0,92 | 0,81 | 0,87 | 0,95 |
| Fat percentage (%) | ||||||
| Men | 5,10 | 10,28 | 14,71 | 8,84 | 10,76 | 12,49 |
| Women | 20,44 | 24,07 | 26,17 | 19,05 | 26,14 | 31,59 |
* C vs E, Teste Mann-Whitney (p < 0.05).
There was higher cardiovascular disease risk among women of both groups compared to men. Waist-hip ratio averages indicated cardiovascular disease risk for women (C = 0.89 ± 0.08 vs. S = 0.88 ± 0.10). Waist circumference was positively correlated with BMI in both groups. It was also observed that weight was correlated to blood glucose levels in the study group (Figure 1).
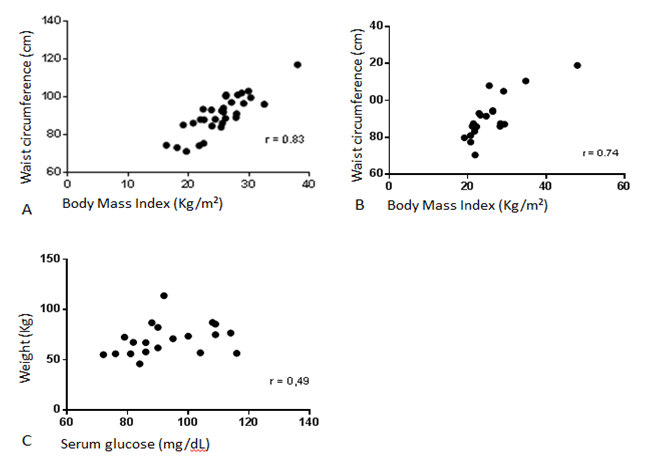
Figure 1: Correlation between anthropometric and biochemical variables of individuals with HIVLS, Petrolina, PE (2014). A. Positive correlations between waist circumference and Body Mass Index in the control group (N = 31); B. Positive correlations between waist circumference and Body Mass Index in the study group (N = 20). C. Positive correlation between weight and serum glucose in the study group.
During fat percentage assessment, men with very low fat percentage (C = 50.00% vs. S = 70.00%), excellent fat percentage (C = 42.85% vs. S = 30.00%) and fat reserves in good quantity (C = 7.19% vs. S = 0.00%) were observed. Women showed very low (C = 11.76% vs. S = 10.00%), excellent (C = 23.52% vs. S = 20.00%), very good (C = 17.60% vs. S = 0.00%), good (C = 29.41% vs. S = 30.00%), suitable (C = 11.76% vs. S = 0.00%), moderately high (C = 5.88% vs. S = 20.00%) or very high (C = 0.00% vs. S = 20.00%) fat reserves.
Lipodystrophy Severity Grading Scale (LSGS)
Regarding HIVLS manifestations, similarity of physical change severity was observed in the groups (C = 6.77 ± 3.58 vs. S = 7.05 ± 7.23). Among study group individuals, 5% scored zero, indicating no physical changes. Other group members had mild (C = 58.00% vs. S = 55.00%) or moderate (C = 42.00% vs. S = 40.00%) severity. In the total population (control and study group), higher lipoatrophy prevalence was observed in males (73.95%), compared to females (56.48%). As for abdominal lipohypertrophy, 100.00% of women showed alterations, while 87.50% of men had alterations
Discussion
Similar variables (age, sex, weight, and antiretroviral use time and type) were used for both groups, as these variables are also risk factors for HIV Lipodystrophy Syndrome development[10]. Sex hormones and body composition differences observed between men and women, corroborated by age, could influence the reliability of results.
Serum biochemistry was used for diagnosis and selection of patients with lipodystrophy[4]. Among serum changes, triglycerides, total cholesterol, and HDL- cholesterol were the parameters that underwent the highest number of changes, followed by glucose. Similar results were found by Silva et al[26]. It was observed that 15.68% of subjects had already had serum chemistry changes before antiretroviral use, with hypertriglyceridemia and hypercholesterolemia being the most common changes. As found by Silva et al.[26], it was observed that lipid profile changes are more evident after antiretroviral therapy initiation.
The research stated that HAART is the main HIVLS trigger. Among HAART drug groups, protease inhibitors (PIs) stood out on this effect. API action mechanism hypothesis states that the IP site bounded to the viral protein has a similar molecular structure to certain proteins involved in lipid metabolism. Thus, introducing this medication would lead to partial or total inhibition of the metabolic mechanisms involved.
Inhibition of these proteins increases adipocyte apoptosis rate and reduces preadipocytes differentiation rate in adipocytes, reducing triglyceride reserves and increasing lipid release[27]. In this study, it was found that the control group had a proportionately higher PI use, which may have contributed to patients’ dyslipidemia and hyperglycemia, even when they had healthy eating habits and were active.
Another nuance refers to improper eating by the study group, which contributes to increases in serum cholesterol and triglycerides. In addition, excessive consumption of foods rich in simple carbohydrates (which was common in the study group) also contributed to increases in weight, triglyceride and blood sugar[28], biochemical parameters that were higher in this group than in the control group. The earlier the dietary intervention coupled with physical exercises, more significant was the nutritional status improvement, contributing to weight maintenance and lower metabolic change progress[29].
Regarding physical activity level assessment, there was prevalence of walks for various purposes. Physical activities promoted several benefits for patients with dyslipidemia. The main benefits were energy expenditure increase, HDL-cholesterol increase, LDL-cholesterol and triglycerides decrease, weight control, fat loss, and lean body mass preservation, in addition to visceral fat deposit decrease. Another benefit expected after regular physical exercise is food consumption control[30]. However, IPAQ analyzes both activities conducted by the individual on a daily basis and the exercise type practiced by them. It would be advisable to only analyze the physical exercises practiced by individuals, in order to observe a more reliable correlation of this variable.
For anthropometric profile, higher weight gain trend was observed in the study group, compared to the control group. Currently, after HAART introduction, weight gain, obesity and fat redistribution are new nutritional problems that people with HIV/AIDS face due to metabolic and physical changes caused by the therapy.
In this study, overweight and obesity prevalence was observed among patients. In a study by Silva, Mori & Guimarães 27, high overweight percentage was also observed, surpassing malnutrition cases. Thus, nutritional status evaluation and monitoring in HIV/AIDS patients is of great importance, as there are relations between nutritional status and weight gain evolution.
In both groups, physical changes were different between sexes. High waist circumference, waist-hip ratio and body fat percentage prevailed in women. Estrogenic hormonal changes may explain body fat excess and high waist circumference in women aged 45 years old or older. However, HIVLS also contributed to abdominal fat accumulation. Such changes, associated with triglyceride concentration increase and HDL-c level reduction, as well as blood glucose and insulinemia increase, constitute cardiovascular risk factor[31].
In men, when AC, PCT and AC adequacy were assessed, high prevalence of muscle tissue and peripheral adipose tissue deficit was observed. Morphologically, men have less body fat than women[27]. In other studies, it was also possible to observe fat reserve loss prevalence in the men’s peripheral region, which was characterized by lipoatrophy predominance[27]. Men of the study group had higher waist- hip ratio (p < 0.05), which may express poor eating quality in this group.
It was observed that, as expected, excessive weight was correlated with waist circumference increase and, concomitantly, cardiovascular diseases risk. Overweight and glucose level increase were also correlated. Thus, nutrition education and nutritional therapy, patient management and the adoption of healthy eating habits, which meet a healthy diet regarding quality, quantity, harmony and nutritional adequacy, are critical to control patient weight and reduce associated comorbidities. Dietary treatment must prioritize weight loss, which promotes improved insulin sensitivity, besides other benefits[32]. The decision for an appropriate nutritional treatment aimed at dyslipidemia and insulin resistance will depend on the presence of symptoms, and the clinical picture[33].
In HIVSL physical severity assessment, it was observed that some patients failed to observe changes. It is estimated that lipodystrophy only becomes visible with the alteration of at least 30% of adipose tissue. Lipodystrophy physical signs usually appear gradually, increasing severity for a period from 18 to 24 months, and then stabilizing for at least two years[3].
Conclusion
Although interference of healthy living habits was not observed in HIVLS physical severity, especially regarding eating habits, monitoring of anthropometric parameters, associated with serum biochemical evaluation, may provide valuable information for early diagnosis of secondary morphological changes related to antiretroviral therapy. A poor diet contributed to waist-hip ratio increase in males. In addition, it may have also interfered with body weight increase, which causes blood glucose increase in patients with HIVLS.
It is worth mentioning that nutritional monitoring is essential to promote a better quality of life and to reduce comorbidities associated with HIVLS. Nutritional intervention studies with a larger number of individuals are needed to elucidate the diet effect on other factors involving HIVLS.
Acknowledgement:
The authors want to thank the DST/ HIV/AIDS and Viral Hepatitis Reference Center Team from the Specialized Care (SAE) sector for collaborating with the research.
References
- 1. Polacow, V.O., Scagliusi, F.B., Furtado, L.S.M., Carré ML, et al. Nutritional status alterations and diet therapy in the HIV infection. (2004) Braz J Clin Nutr 19(2): 79-85.
- 2. Castelo, F.A, Abrao, P. Alterações Metabólicas do Paciente Infectado por HIV. (2007) Arq Bras Endocrinol Metab 51(1): 5-7.
- 3. Brazil. Clinical protocol and therapeutic guidelines for the management of HIV infection in adults. (2013) Ministry of Health
- 4. Dutra, C.D., Libonati, R.M.F. Metabolic and nutritional approach of lipodystrophy in the use of antiretroviral therapy. (2008) Braz J Nutr 21(4): 439-446.
- 5. Rachid M, Schechter M. (2008) Manual de HIV/AIDS. 9ª ed. Rio de Janeiro: Revinter.
- 6. World Health Organization (WHO). Nutrient requirements for people living with HIV/AIDS. Reports of a technical consultation. (2003) Genebra: WHO.
- 7. Abramson, J.H. WINPEPI (PEPI-for-Windows): computer programs for epidemiologists. (2004) Epidemiol Perspect Innov 1(1): 6.
- 8. Abrantes, M.M., Lamounier, J.A., Colosimo, E.A. Overweight and obesity prevalence among children and adolescents from Northeast and Southeast regions of Brazil. (2002) J Pediatr. 78(4): 335-340.
- 9. Sociedade Brasileira de Diabetes. Diretrizes da Sociedade Brasileira de Diabetes: 2013-2014. São Paulo: AC Farmacêutica, 2014.
- 10. Diehl, L.A., Dias, J.R., Paes, A.C., et al. Prevalence of HIV-associated lipodystrophy in Brazilian outpatients: relation with metabolic syndrome and cardiovascular risk factors. (2008) Braz Arch Endocrinol Metab. 52(4): 658-667.
- 11. Matarazzo, H.C.Z., Marchioni, D.M.L., Figueiredo, R.A.O., et al. Reproducibility and validity of a food frequency questionnaire used in a case-control study of oral cancer. (2006) Braz J Epidemiol. 9 (3): 316-324.
- 12. 12. Ladeira, P.O., Silva, D.C. Nutritional status and food profile of patients assisted by the programme of STD/Aids and viral hepatitis a health center of Itaperuna-RJ. (2012) Braz J Sex Transm Dis. 24(1): 28-31.
- 13. Philippi, S.T., Latterza, A.R., Cruz, A.T. , et al. Adapted food pyramid: a guide for a right food choice. (1999) Braz J Nutr 2 (1): 65-80.
- 14. Mota, J.F., Rinaldi, A.E., Pereira, A.F., et al. Adaptation of the healthy eating index to the food guide of the Brazilian population. (2008) Braz J Nutr. 21(5): 545-552.
- 15. Guedes, D.P., Lopes, C.C., Guedes, J.E. Reprodutibilidad de la validez de la Encuesta Internacional de Actividad Física en adolescentes. (2005) Braz J Sports Med. 11(2): 151-158.
- 16. Segatto, A.F.M., Freitas, Junior, I.F., Santos, V.R., et al. Lipodystrophy in HIV/AIDS patients with different levels of physical activity while on antiretroviral therapy. (2011) Rev Braz Soc Med Trop. 44 (4): 420-424.
- 17. Medina C, Barquera S, Janssen I. Validity and reliability of the International Physical Activity Questionnaire among adults in Mexico. (2013) Rev Panam salud Public a 34(1): 21-28.
- 18. World Health Organization (WHO). Obesity: preventing and managing the global epidemic of obesity. Report of the WHO Consultation of Obesity. Genebra: WHO; 1997.
- 19. OPAS. Organização Pan-Americana de Saúde. XXXVI Reunión del Comitê Asesor de
- 20. Ivestigaciones em Salud – Encuestra Multicêntrica – Salud Beinesta y Envejecimeiento (SABE) en América Latina e el Caribe. Informe preliminar: 2002.
- 21. Frisancho, A.R. New norms of upper limb fat muscle areas for assessment of nutritional status. (1981) American Journal of Clinical Nutrition. 34(11): 2540-2545.
- 22. Blackburn, G.L., Thornton, P.A. Nutritional assessment of the hospitalized patient. (1979) Medical Clinical North American 63(5): 1103-1115.
- 23. Obesity: preventing and managing the global epidemic. Report of a WHO consultation. (2000) World Health Organ Tech Rep Ser 894(i-xii): 1-253.
- 24. Guedes, D.P. Body composition technical principles and applications. 2ª ed (1994) Londrina: APEF.
- 25. Pollock, M.L., Wilmore, J.H., Exercícios na saúde e na doença: avaliação e prescrição para prevenção e reabilitação. (1993) Rio de Janeiro: Medsi.
- 26. Santos, L. Anthropometric indicators of body fat in aid to the diagnosis of HIV lipodystrophy syndrome (HIVLS). (2012) Pelotas UFPel: ESEF.
- 27. Silva, E.F.R., Lewi, D.S., Vedovato, G.M., et al. Nutritional and clinical status, and dietary patterns of people living with HIV/AIDS in ambulatory care in Sao Paulo, Brazil.( 2010) Rev Braz Epidemiol 13(4): 677-688.
- 28. Silva, V.S., Mori, R.M.S.C., Guimarães, S.M. Nutritional Changes in Patients with HIV/Aids Associated Lipodystrophy in a Reference Unit in Belém – Pará. (2012) Braz J Sex Transm Dis 24 (4): 233-238.
- 29. Oliveira, O.M., Medeiros, R.S., Nascimento, M.A., et al. Nutritional profile and evaluation of the risk factors for central obesity of people who live with HIV/AIDS. (2008) Rep Health Sci.19 (4): 305-314.
- 30. Seidl EMF, Machado ACA. Psychological well-being, coping and lipodystrophy in hiv/aids people. (2008) Psicol Estud. 13(2): 239-247.
- 31. Matsudo, V.K., Matsudo, S.M. Physical exercise in treating obesity. (2006) Einstein 4(1): S29-S43.
- 32. Oliveira, E.P., Souza, M.L.A., Lima, M.D.A. Prevalence of metabolic syndrome in a semi-arid rural area in Bahia. (2006) Arg Bras Endocrinol Metabol 50(3): 456-465.
- 33. Santos, C.R.B., Portella, E.S., Avila, S.S.,et al. Dietary factors in preventing and treating comorbidities associated with the metabolic syndrome. (2006) Rev. Nutr., Campinas 19(3), 389-401.
- 34. Braga, I.S., Guimarães, N.S., De, Figueiredo, S.M. Nutritional and metabolic disorders caused by antiretroviral therapy and nutritional approach: a narrative review. (2015) Nutr. clín. diet. Hosp 35(1): 71-75.


