
Influence of Surrounding Conditions on Visual Determination of Tooth Shade
Thomas Klinke-Wilberg
Affiliation
Polyclinic for dental prosthetics, geriatric dentistry and medical material science, University of Greifswald, Germany
Corresponding Author
Thomas Klinke-Wilberg, Polyclinic for dental prosthetics, geriatric dentistry and medical material science, University of Greifswald, Germany, Tel: +49 (0) -3834-86-19625; Office: +49 (0) -3834-86-7155; E-mail: klick@uni-greifswald.de
Citation
Klinke-Wilberg, T., et al. Influence of Surrounding Conditions on Visual Determination of Tooth Shade. (2018) J Dent Oral Care 4(2): 23- 29.
Copy rights
© 2018 Klinke-Wilberg, T . This is an Open access article distributed under the terms of Creative Commons Attribution 4.0 International License.
Abstract
Statement of problem: Environmental conditions play a major role for accurate determination of tooth color. However, often underestimated is the impact like intensity of illumination, individual adaptation time as well as the influence of environmental conditions on color determination?
Purpose: The aim of this research is to analyze the influence of background color on the visual determination of tooth color.
Material and methods: Dental students (N = 37) at the Universities in Dresden, Leipzig, Berlin, Olomuc and Greifswald participated in this research. A standardized lecture, followed by the web-based Toothguide-Trainer tool (www.toothguide.de) prepares the students for templates matching with the computer aided “Tooth guide-Training-Box” (TTB, VITA Zahnfabrik). After color matching in neutral grey surrounding (reference), the participants repeated the matching on modified TTBs (red, yellow and blue). Color distance to the selected templates (ΔE) was calculated confounded by gender and age. The mean and standard deviation (SD), median and the 95 % confidence interval (95% CI) were calculated using Mann-Whitney U test (α = .05).
Results: Compared with the reference (neutral grey) a color distance (mean ΔE) of 2.45 and standard deviation (SD) ± 2.6, ΔE for red background was 3.35 (± 2.8), blue had a ΔE value of 2.98 (± 2.6). U test showed highest significant differences (P < 001) to the reference. Yellow background showed a mean of ΔE 2.94 (± 2.7) with P < .01. 95% CI for reference was 2.16 – 2.49, red 3.07 – 3.44, blue 2.71 – 3.05 and yellow 2.67 – 3.02. Odds ratio of misassessment (?E > 3) for red environment was 2.14 (P < 001), for blue background with 1.73 (P < 001) and yellow with 1.53 (P = .001) significant higher compared with reference (neutral grey). For all background colors (“yellow”, “blue”, “red”), men needed a significantly longer evaluation time (P < 05, respectively) in color differentiation than for the grey background (reference).
Conclusion: The environmental conditions play a major role and influence the visual determination of tooth color significantly. Standardized conditions are required to get exact results in the tooth color differentiation.
Clinical implications: Color determination requires “dazzle-free” standard environment conditions (neutral grey environment, day light illumination) to improve the visual color differentiations procedures. Eliminable factors, like colorful outerwear, make-up, colorful walls and ceilings as well as colorful dental instruments have to be avoided.
Introduction
In addition to the undeniable need for functional aspects in restorative and reconstructive dentistry, the esthetic appearance of fixed restorations gaining an increasing importance today. For patients, a perfect color match is important; no patient would like an optically prominent fixed or removable prosthesis. However, the determination of tooth color is a challenge for dentists and plays an important role for direct and indirect fabrication of highly aesthetic reconstructions in dentistry. The communication of color with the dental laboratory is essential for high esthetic and excellent restorations and reduces additional costs for color correction[1]. Therefore, the determination of the patient’s tooth color is an important, often underestimated treatment step and is routinely performed with a visual method[2] and is still considered a standard method. In the United States the majority of dentists in private offices use visual shade taking (59.8%) using Vita Classical shade guide and Vita 3D-Master (34.4%) (Both VITA Zahnfabrik)[3]. Only 1 dentist (3.1%) used an electronic instruments (VITA Easy shade Compact; VITA Zahnfabrik), and another dentist used digital images when communication with the dental laboratory[3]. In European dental schools visual color determination by Vita Classical shade guide (17 to 67%) and subsequently by Vita 3D-Master shade guide (0 to 47%) represents the most popular teaching method for shade selection. Dozic et al. corroborate these findings in their study and showed that only a minority of students (2 to 47%) had been introduced to the methods available for digital shade determination[4]. Based on the Munsell-color-system[5], the tooth selected for shade matching is compared to a current sample of the color scale (reference) at neutral light conditions[6-8]. In Munsell’s theory; he described color by terms of hue, value and chroma. 3D-Master shade guide (VITA Zahnfabrik) determines tooth color in three consecutive phases: lightness (5 categories), chroma (5 categories) and hue (3 categories) with 26 shade defined taps[8-10]. Through the determination of lightness (value) in the first level, up to 60% of incorrect assessment are eliminated. Both further steps, the determination of chroma and hue, reduce color-matching errors with a compliance of almost 70%[6,8]. Clinical studies have demonstrated that the subjective color determination independent of the used color scale, but - in fact - gender-dependent can be learned[9,10-14]. In their research with 614 participants of 15 universities in 9 countries, Haddad et al came to the conclusion that female achieved better in color determination results than male[11] and contradicts to Della Bona et al[15] who had assumed that only experience was the deciding factor in color determination. Three training phases and a final test of the Toothguide-Training Box (Vita Zahnfabrik) used Gulden et al in their research to compared color shade-matching ability of graduate students and dental technician students[9]. They concluded that dental technician students were more successful in shade matching than graduate students in the final test[9]. All of these used systems of visual tooth color determination exhibit various accuracies and reliabilities. Color determination has to be performed under the same reproducible conditions (i.e. daylight, viewing distance and angle) a precondition for visual color differentiation[30]. The important role of illumination for color differentiation is focused by different research projects[16-19]. Thus, a key issue addressed by Wee et al. was focused on light conditions in private dental practices which can lead to differences in color determination. The conclusion of their research was that the use of ambient light in dental offices is not sufficient to ensure accurate color differentiation[3]. Color differentiation was performed under different illumination conditions like daylight, halogen light fluorescent (5000 K) and fluorescent (nonspecific ceiling light)[12]. As the consequence and effects of lighting conditions it is concluded that the fluorescent light sources and day light had significant influences on visual color determination[12]. For that reason digital devices like color spectrometers, spectrophotometric, and digital images are used in dental offices to eliminate the influences[21-25]. However, only in one publication was focused on the importance and influence of background / surrounding color[20]. Dudea et al performed color matching of 10 color-competent observers under reproducible conditions (optical geometry, viewing distance) under two different illumination (6500K and 5000K) and 5 different colored surroundings (grey, white, and black, red and light blue)[20].Their results showed that observers with perfect color matching competence achieved better matching results compared to those with the average color discrimination competence. Most errors in tooth color determinations were detected to blue background compared to other backgrounds. Background colors like white and black generated significantly better results, followed by grey and red. Furthermore, they found that darker tooth colors (color tabs) were more often mismatched and influenced by the background color[20].
The aim of the study was to assess the influence of background color in the direct field of view on color differentiation and to analyze the risk (odds-ratio) of color mismatch. Consequently, the null hypotheses were as follows:
The background color does affect the tooth color differentiation.
Gender did not influence the shade matching quality.
Neutral grey is the background for color matching and reduce the risk of misinterpretation.
Materials and Methods
Students (N = 37, men n = 9, mean age 22.25 yrs ± 2.99, woman n = 28, mean age 22.8 2yrs ± 0.84) in the preclinical and clinical phase at the Universities in Greifswald, Berlin, Dresden, Leipzig (Germany) and Olomouc (Czech Republic) participated in this prospective study. These voluntarily participants attended the preclinical course “Learning tooth color differentiation”, assumed pseudonyms for the purpose for the data generation once they had agreed to participate in the research project. The Ethical Committee of the University of Greifswald (Ref. BB 058/16) approved the study protocol. A standardized lecture at each university “How to determine tooth color”, followed by the web-based Toothguide-Trainer tool (TT, www.toothguide.de, VITA Zahnfabrik) prepares each student for its study participation. The free-available software trains each user for template matching according to Munsell theory by determining hue, value and lightness. The used shade guide (3D-Master, VITA Zahnfabrik) uses the same parameters for tooth color determination. All participants were tested with Color Vision Deficiency Test (CVD) using a beamer projection of the Ishihara test charts, before starting the test[26] The Toothguide-Training-Box (TTB, VITA Zahnfabrik, Figure 1) performs color matching under reproducible conditions, designed by Jakstat in 2002 and later improved in 2007[13] . The tooth-shaped shade tabs were presented in the field of view in neutral grey background (reference). Flexible artificial daylight source (5500K, Dialite Color, Eickhorst & Co. KG) illuminated the field of view where all participants matched color in three training phases: 1. brightness, 2. brightness and chroma, and 3. brightness, chroma and hue. During the final test, randomly selected templates were presented in the same order according to the software algorithm at each TTB.
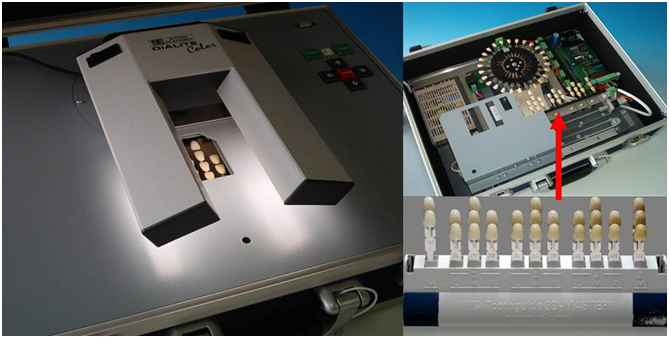
Figure 1: Toothguide Training Box (TTB, Vita Zahnfabrik) with flexible artificial daylight source (5500K, Dialite Color, Eickhorst& Co. KG).
Participants perform additional final test on modified TTBs, where its background was altered by TFT-monitor. The surrounding of field of view was covered by red-, yellow- or blue-colored sheets and the monitor in the background was adjusted to the same color value (Figure 2). In accordance to the CMC system (Colour Measurement Committee of English Dyers & Colorists Society”[27]) the discrepancy of ΔE = 1 has been noted as a “good color match, its differences are only visible for the trained eye”. The correct color match will perceived in the close or direct neighborhood of the color location (ΔE = 1) only. Results at ΔE > 5 are defined as totally unacceptable and were evaluated as different color(Table 1). Clinical research described, that discrepancies of ΔE = 1 and ΔE = 2.5 (partially dependent on the end point) have been found by users (“normal, untrained beholder”) with less or none experience[27,28]. Additionally it is concluded that the evaluation time plays an important role, because results are influenced by the ability of the observer to determine color differences[28]. For that reason, the determination time and a “cut-off”-category for assumed result of ΔE > 0 and ΔE >3 were added in this study consequently. The distance between 2 colors (ΔE[1]) was calculated as Euclidian distance according to ISO 12647 and ISO 13655; the results were added and the mean and standard deviation (SD) as well as the median and the 25/75 %-quantiles.
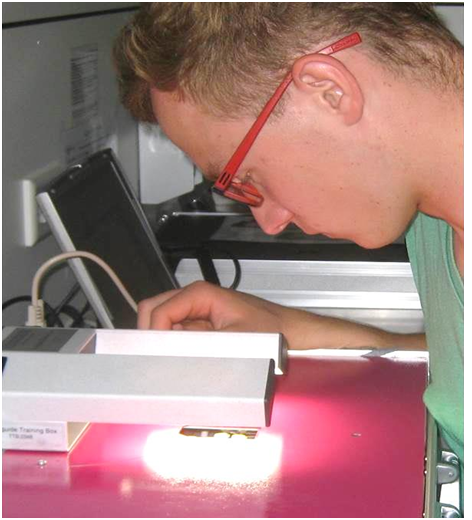
Figure 2: Participant’s determination of tooth color with modified TTB in red environment.
Table 1: Evaluation of ΔE according to CMC system[27].
| Scale | ΔE | Valuation |
|---|---|---|
| 1 | 0.0 - 0.5 | exact match/no difference in colour |
| 2 | 0.5 - 1.0 | very good match/small difference, visible for a trained eye |
| 3 | 1.0 - 2.0 | Non recognizable color difference, good match/acceptable |
| 4 | 2.0 - 4.0 | recognizable color difference, poor match |
| 5 | 4.0 - 5.0 | Noticable color difference, hardly acceptable |
| 6 | > 5.0 | mismatch/totally unacceptable, difference will be evaluated as a different color |
ΔE = √((L1 - L2)2 + (a1 - a2)2 + (b1 - b2)2 ) [1]
A statistics program (SPSSv19.0; IBM Corp.) was used to evaluate the results. Mann-Whitney test (U-Test) was used to evaluate the differences in the allocation of the ΔE values between grey (reference) and the colored backgrounds (α = .05). Chi2-test (P < .05) has been used for categorical variables to show the significance between the groups. Additional, multilevel regression models were used to account the hierarchical structure of the data (clustering of teeth within the investigator); therefore random effects were included in the model. For linear models, the regression coefficients (RC) with the 95% confidence intervals are shown for fixed effects. Logistic mixed models (STATA, StataCorp LP) confounded by gender were used to show the odds ratios (OR with the 95% confidence intervals (95% CI)) to describe the risk of miss-assessment.
Results
None of the participants in the preclinic and clinic had a color vision deficiency (Ishihara-Test). The statistical evaluation on influence of colored backgrounds on visual tooth color differentiation revealed highest significant differences with a median ΔE = 3.74 (25%; 75% quantil: 0;5.34) for red background in comparison with the reference (ΔE1.84(0;4.25), P < .0001) (Table 2). The median ΔE = 3.07 (0; 5[25].) was found for yellow background (P < .05) and ΔE = 3.12 (0;4.88) for blue surrounding color (P < .001). Additional, the ΔE variables were divided into two categories: once Cutoff ΔE > 0 and with the Cutoff ΔE > 3 (Table 3). The Cutoff ΔE > 0 showed significant differences compared to ΔE > 0 between the colors:70.1% red / 69.6% blue and the reference 62.0% (grey color, (P < .05)). No statistical differences were found in 66.3% yellow background (P = .13). Differences for the cutoff ΔE > 3 in the proportion of ΔE values >3 between the individual colors and the reference color “grey” are significantly recognizable.The ΔE values ΔE >3 are between 42.7% (reference) and 61.1% (red background).In comparison with reference, the statistical evaluation of the proportion of ΔE >3 is significantly different for yellow background (P = .001), blue and red environment (P < .001). The influence of the different background colors were calculated with Odds ratio (OR). Fixed models were used and adjusted regarding gender and age (Table 3). The risk (odds ratio) of misassessment (ΔE > 3) in the color differentiation was for red environment 2.14 (P < .001), for blue background with 1.73 (P < .001) and yellow with 1.53 (P = .001) significant higher compared with reference (neutral grey) (Table 3). An effect modification by gender (P = .007) was found in the interaction term of the statistical model. Therefore the model was separated for men and women set up again (Table 4). The influence of background colors on the evaluation time (logarithmic) of men were much more pronounced than in women. For all background colors (“yellow”, “blue”, “red”), men needed a significantly longer evaluation time (P < .05, respectively) in color differentiation than for the grey background (reference).Women demonstrated a significantly lower evaluation time with red background (RC (95% CI): -0.16 (-0.24; -0.07); P < .001) compared to the reference (grey colored background).For other background colors like “yellow” and “blue”, no significant differences were found.
Table 2: Delta E (ΔE) of tooth color (3D-Master, Vita Zahnfabrik) depending on background color.
| Back ground color |
Template | ||||||||||||||||
|---|---|---|---|---|---|---|---|---|---|---|---|---|---|---|---|---|---|
| 1M10 | 2L25 | 2M10 | 2M20 | 2M30 | 2R15 | 2R25 | 3M10 | 3M20 | 3M30 | 3R25 | 4L15 | 4M30 | 5M10 | 5M20 | |||
| grey | Mean | 1.06 | 1.84 | 1.70 | 1.43 | 3.31 | 5.51 | 6.26 | 2.77 | 1.38 | 1.50 | 2.97 | 3.82 | 1.58 | 0.58 | 0.35 | |
| Standard error (SE) | 0.36 | 0.24 | 0.47 | 0.35 | 0.44 | 0.39 | 0.39 | 0.52 | 0.33 | 0.37 | 0.30 | 0.37 | 0.31 | 0.32 | 0.24 | ||
| 95% CI | Lower limit | 0.33 | 1.35 | 0.74 | 0.72 | 2.41 | 4.71 | 5.46 | 1.71 | 0.70 | 0.74 | 2.36 | 3.06 | 0.94 | -0.08 | -0.15 | |
| Upper limit | 1.79 | 2.33 | 2.66 | 2.14 | 4.21 | 6.31 | 7.07 | 3.82 | 2.06 | 2.26 | 3.58 | 4.58 | 2.22 | 1.24 | 0.84 | ||
| Median | Q25 | 0.00 | 0.94 | 0.00 | 0.00 | 3.19 | 4.58 | 4.00 | 0.00 | 0.00 | 0.00 | 1.66 | 1.39 | 0.00 | 0.00 | 0.00 | |
| Q50 | 0.00 | 0.94 | 0.00 | 0.00 | 3.19 | 5.34 | 6.37 | 3.36 | 0.00 | 0.00 | 3.14 | 4.96 | 1.84 | 0.00 | 0.00 | ||
| Q75 | 1.07 | 2.64 | 3.65 | 3.12 | 4.07 | 7.98 | 6.85 | 4.25 | 3.41 | 3.77 | 3.74 | 5.07 | 1.84 | 0.00 | 0.00 | ||
| Variance | 3.84 | 1.74 | 6.34 | 3.22 | 6.01 | 4.59 | 4.96 | 8.55 | 3.58 | 4.75 | 2.77 | 4.16 | 2.85 | 2.81 | 1.50 | ||
| Standard deviation (SD) | 1.96 | 1.32 | 2.52 | 1.80 | 2.45 | 2.14 | 2.23 | 2.92 | 1.89 | 2.18 | 1.66 | 2.04 | 1.69 | 1.68 | 1.22 | ||
| Minimum (Min) | 0.00 | 0.94 | 0.00 | 0.00 | 0.00 | 2.31 | 3.73 | 0.00 | 0.00 | 0.00 | 1.66 | 1.39 | 0.00 | 0.00 | 0.00 | ||
| Maximum (Max) | 5.18 | 4.47 | 5.99 | 4.22 | 9.00 | 8.35 | 10.04 | 11.36 | 6.38 | 7.92 | 9.96 | 9.44 | 5.79 | 5.87 | 4.50 | ||
| Range | 5.18 | 3.54 | 5.99 | 4.22 | 9.00 | 6.04 | 6.30 | 11.36 | 6.38 | 7.92 | 8.30 | 8.04 | 5.79 | 5.87 | 4.50 | ||
| Inter-quartile range | 1.07 | 1.70 | 3.65 | 3.12 | 0.88 | 3.40 | 2.85 | 4.25 | 3.41 | 3.77 | 2.08 | 3.68 | 1.84 | 0.00 | 0.00 | ||
| yellow | Mean | 0.17 | 3.35 | 2.27 | 2.60 | 3.73 | 5.52 | 6.09 | 2.68 | 2.14 | 3.91 | 3.23 | 4.01 | 1.96 | 1.86 | 0.66 | |
| Standard error (SE) | 0.17 | 0.44 | 0.34 | 0.39 | 0.51 | 0.33 | 0.27 | 0.38 | 0.32 | 0.47 | 0.23 | 0.31 | 0.39 | 0.47 | 0.29 | ||
| 95% CI | Lower limit | -0.18 | 2.46 | 1.58 | 1.82 | 2.69 | 4.85 | 5.55 | 1.90 | 1.48 | 2.96 | 2.77 | 3.38 | 1.18 | 0.90 | 0.09 | |
| Upper limit | 0.52 | 4.23 | 2.96 | 3.38 | 4.77 | 6.18 | 6.63 | 3.45 | 2.79 | 4.86 | 3.69 | 4.64 | 2.74 | 2.82 | 1.24 | ||
| Median | Q25 | 0.00 | 0.94 | 0.00 | 0.00 | 1.59 | 5.34 | 5.89 | 0.00 | 0.00 | 0.00 | 1.66 | 1.39 | 0.00 | 0.00 | 0.00 | |
| Q50 | 0.00 | 3.69 | 3.02 | 3.07 | 3.19 | 5.34 | 5.89 | 2.48 | 2.94 | 5.24 | 3.74 | 4.96 | 1.84 | 0.00 | 0.00 | ||
| Q75 | 0.00 | 4.47 | 4.27 | 4.02 | 5.22 | 7.51 | 6.85 | 4.25 | 3.84 | 5.24 | 3.74 | 5.28 | 3.82 | 4.87 | 0.00 | ||
| Variance | 1.11 | 7.08 | 4.33 | 5.53 | 9.75 | 3.97 | 2.62 | 5.34 | 3.86 | 8.06 | 1.91 | 3.62 | 5.49 | 8.30 | 3.01 | ||
| Standard deviation (SD) | 1.05 | 2.66 | 2.08 | 2.35 | 3.12 | 1.99 | 1.62 | 2.31 | 1.96 | 2.84 | 1.38 | 1.90 | 2.34 | 2.88 | 1.73 | ||
| Minimum (Min) | 0.00 | 0.94 | 0.00 | 0.00 | 0.00 | 1.01 | 0.77 | 0.00 | 0.00 | 0.00 | 1.66 | 1.39 | 0.00 | 0.00 | 0.00 | ||
| Maximum (Max) | 6.41 | 9.80 | 5.99 | 6.41 | 11.13 | 8.35 | 10.04 | 9.51 | 5.25 | 11.81 | 5.58 | 8.53 | 5.79 | 9.59 | 6.60 | ||
| Range | 6.41 | 8.86 | 5.99 | 6.41 | 11.13 | 7.34 | 9.26 | 9.51 | 5.25 | 11.81 | 3.92 | 7.14 | 5.79 | 9.59 | 6.60 | ||
| Inter-quartile range | 0.00 | 3.54 | 4.27 | 4.02 | 3.63 | 2.16 | 0.96 | 4.25 | 3.84 | 5.24 | 2.08 | 3.88 | 3.82 | 4.88 | 0.00 | ||
| Back ground color |
Template | ||||||||||||||||
|---|---|---|---|---|---|---|---|---|---|---|---|---|---|---|---|---|---|
| 1M10 | 2L25 | 2M10 | 2M20 | 2M30 | 2R15 | 2R25 | 3M10 | 3M20 | 3M30 | 3R25 | 4L15 | 4M30 | 5M10 | 5M20 | |||
| blue | Mean | 0.75 | 2.50 | 2.53 | 3.11 | 4.01 | 5.40 | 6.65 | 2.92 | 2.23 | 2.81 | 2.74 | 4.46 | 1.75 | 1.91 | 0.98 | |
| Standard error (SE) | 0.29 | 0.32 | 0.34 | 0.31 | 0.36 | 0.33 | 0.30 | 0.46 | 0.32 | 0.41 | 0.22 | 0.39 | 0.32 | 0.51 | 0.34 | ||
| 95% CI | Lower limit | 0.16 | 1.86 | 1.85 | 2.48 | 3.27 | 4.74 | 6.04 | 1.98 | 1.58 | 1.99 | 2.30 | 3.67 | 1.09 | 0.87 | 0.28 | |
| Upper limit | 1.34 | 3.15 | 3.21 | 3.75 | 4.75 | 6.06 | 7.26 | 3.86 | 2.87 | 3.64 | 3.18 | 5.26 | 2.41 | 2.95 | 1.67 | ||
| Median | Q25 | 0.00 | 0.94 | 0.00 | 3.12 | 3.19 | 5.34 | 5.89 | 0.00 | 0.00 | 0.00 | 1.66 | 3.02 | 0.00 | 0.00 | 0.00 | |
| Q50 | 0.00 | 0.94 | 3.02 | 3.12 | 3.19 | 5.34 | 6.85 | 4.25 | 3.41 | 3.77 | 1.66 | 4.96 | 1.84 | 0.00 | 0.00 | ||
| Q75 | 0.00 | 3.69 | 3.02 | 3.82 | 4.07 | 7.51 | 6.85 | 4.48 | 3.41 | 3.89 | 3.74 | 5.40 | 1.84 | 4.87 | 0.00 | ||
| Variance | 3.10 | 3.74 | 4.17 | 3.65 | 4.93 | 3.92 | 3.38 | 7.93 | 3.76 | 6.14 | 1.71 | 5.68 | 3.87 | 9.80 | 4.34 | ||
| Standard deviation (SD) | 1.76 | 1.93 | 2.04 | 1.91 | 2.22 | 1.98 | 1.84 | 2.82 | 1.94 | 2.48 | 1.31 | 2.38 | 1.97 | 3.13 | 2.08 | ||
| Minimum (Min) | 0.00 | 0.94 | 0.00 | 0.00 | 0.00 | 2.31 | 4.00 | 0.00 | 0.00 | 0.00 | 1.66 | 1.39 | 0.00 | 0.00 | 0.00 | ||
| Maximum (Max) | 6.41 | 6.70 | 6.09 | 7.61 | 9.00 | 8.35 | 10.04 | 9.51 | 5.35 | 8.18 | 5.58 | 15.00 | 5.79 | 9.59 | 6.60 | ||
| Range | 6.41 | 5.76 | 6.09 | 7.61 | 9.00 | 6.04 | 6.03 | 9.51 | 5.35 | 8.18 | 3.92 | 13.61 | 5.79 | 9.59 | 6.60 | ||
| Inter-quartile range | 0.00 | 2.75 | 3.02 | 0.69 | 0.88 | 2.16 | 0.96 | 4.48 | 3.41 | 3.89 | 2.08 | 2.38 | 1.84 | 4.88 | 0.00 | ||
| red | Mean | 0.66 | 4.37 | 1.15 | 2.83 | 5.29 | 6.06 | 6.01 | 4.27 | 3.09 | 3.57 | 2.89 | 3.62 | 2.50 | 2.52 | 1.36 | |
| Standard error (SE) | 0.28 | 0.33 | 0.31 | 0.35 | 0.30 | 0.26 | 0.31 | 0.57 | 0.35 | 0.37 | 0.23 | 0.37 | 0.49 | 0.63 | 0.35 | ||
| 95% CI | Lower limit | 0.09 | 3.70 | 0.53 | 2.13 | 4.67 | 5.53 | 5.38 | 3.12 | 2.37 | 2.82 | 2.43 | 2.88 | 1.50 | 1.24 | 0.65 | |
| Upper limit | 1.23 | 5.04 | 1.78 | 3.53 | 5.90 | 6.60 | 6.64 | 5.42 | 3.80 | 4.32 | 3.35 | 4.37 | 3.49 | 3.81 | 2.06 | ||
| Median | Q25 | 0.00 | 3.69 | 0.00 | 0.00 | 4.07 | 5.34 | 4.00 | 0.00 | 0.00 | 3.77 | 1.66 | 1.39 | 0.00 | 0.00 | 0.00 | |
| Q50 | 0.00 | 3.69 | 0.00 | 3.12 | 4.07 | 5.34 | 5.89 | 4.25 | 3.41 | 3.77 | 3.14 | 3.02 | 0.00 | 0.00 | 0.00 | ||
| Q75 | 0.00 | 5.95 | 3.02 | 4.22 | 6.38 | 7.51 | 6.85 | 6.60 | 4.18 | 4.56 | 3.74 | 5.40 | 5.79 | 4.87 | 4.34 | ||
| Variance | 2.96 | 4.01 | 3.49 | 4.41 | 3.39 | 2.57 | 3.57 | 11.91 | 4.62 | 5.04 | 1.91 | 4.99 | 8.91 | 14.80 | 4.52 | ||
| Standard deviation (SD) | 1.72 | 2.00 | 1.87 | 2.10 | 1.84 | 1.60 | 1.89 | 3.45 | 2.15 | 2.24 | 1.38 | 2.23 | 2.98 | 3.85 | 2.13 | ||
| Minimum (Min) | 0.00 | 0.94 | 0.00 | 0.00 | 3.19 | 2.31 | 3.73 | 0.00 | 0.00 | 0.00 | 1.66 | 1.39 | 0.00 | 0.00 | 0.00 | ||
| Maximum (Max) | 6.41 | 7.77 | 5.99 | 7.61 | 9.00 | 8.35 | 12.56 | 9.51 | 7.30 | 8.18 | 5.58 | 7.86 | 10.56 | 12.53 | 5.79 | ||
| Range | 6.41 | 6.83 | 5.99 | 7.61 | 5.81 | 6.04 | 8.82 | 9.51 | 7.30 | 8.18 | 3.92 | 6.47 | 10.56 | 12.53 | 5.79 | ||
| Inter-quartile range | 0.00 | 2.26 | 3.02 | 4.22 | 2.31 | 2.16 | 2.85 | 6.60 | 4.18 | 0.80 | 2.08 | 4.01 | 5.79 | 4.88 | 4.34 | ||
Table 3: ΔE(continuous and categorical) depending on background color and Odds Ratio (95 %CI) for ΔE>3.
| Backgound color |
ΔE | ΔE >0 | ΔE >3 | Odds Ratio (95 % CI), ΔE>3¥ |
||||
|---|---|---|---|---|---|---|---|---|
| neutral grey (reference) | 2.45 ± 2.53 1.84 (0; 4.25) | - | 344 (62.0%) | - | 237 (42.7%) |
- | 1.00 | - |
| yellow | 2.94 ± 2.68 3.07 (0; 5.24) | P = .002◊ | 368 (66.3%) | P= .13‡ | 294 (53.0%) |
P = .001‡ | 1.53 (1.20; 1.94) |
P = .001‡ |
| blue | 2.98 ± 2.63 3,12 (0; 4.88) | P <.001◊ | 386 (69.6%) | P = .008‡ | 311 (56.3%) |
P <.001‡ | 1.73 (1.36; 2.20) |
P <.001‡ |
| red | 3.35 ± 2.80 3.74 (0; 5.34) | P <.001◊ | 389 (70.1%) | P = .004‡ | 339 (61.1%) |
P < .001‡ | 2.14 (1.68; 2.73) |
P <.001‡ |
Mean ± SD and median (25%; 75% quantile) or as N (%). ◊ Mann - Whitney test versus reference ‡. Chi2 test versus reference. ¥ Odds Ratio modells adjusted to gender and age.
Table 4: Influence of background color on evaluation time (logarithmic).
| Odds ratio (95 % CI) | P value | |
|---|---|---|
| Male (N = 540) | ||
| Fixed effects | ||
| Background color | ||
| grey | 0.00 (Ref.) | - |
| yellow | -0.38 (-0.54; -0.22) | P < .001 |
| blue | -0.20 (-0.36; -0.04) | P = .017 |
| red | -0.23 (-0.39; -0.07) | P < .01 |
| Random effect | 0.37 (SE 0.091) | |
| Female (N = 839) | ||
| Fixed effects | ||
| Background color | ||
| grey | 0.00 (Ref.) | - |
| yellow | -0.04 (-0.12; 0.04) | P = .31 |
| blue | -0.05 (-0.14; 0.03) | P = .19 |
| red | -0.16 (-0.24; -0.07) | P < .001 |
| Random effect | 0.38 (SE 0.011) |
Models adjusted to gender and age. The clustering of the data within the examiner was recognized through inclusion of a random effect in the model.
Discussion
This study presents the results of the influence of colored environment on subjective determination of tooth color. The manual color differentiation represents the most popular teaching methods for shade selection at universities[4]. So it’s not surprising that in dental practice in Europe and the U.S., subjective visual color determination is still frequently practiced[3-5,9]. As the literature suggests, environmental parameters have a substantial influence in the visually subjective determination of color[3,12]. Physical factors like brightness, illumination[29], chameleon-effect of surrounding restorations, color temperature of the viewing light[3,12], and surface condition of the subject tooth viewed[15] etc. are additional imponderability’s, which influence the determination of color. Apart from the consideration biological-physiological effects such as the construction of the color pigments within the cones of the retina are substantially responsible for color perception and color differentiation[27]. Furthermore, pathophysiological causes such as deficits in color perception (red-green color visual impairments, cataract, and sight defects) have a negative influence on the outcome of subjective color perception[27]. International standards organization (ISO) working on a standardization of tooth shade determination since 2011[20]. However, current efforts are complicated by the involvement of experienced observers and inefficient. Tests for color competency of observer which are based on Ishihara color blindness test or Farnsworth-Munsell 100 hue test are less practicable for use in dental offices. But color competency tests can be done before at ophthalmologist to eliminate color vision-deficient observers.
Dental color differentiations in dental offices or dental laboratories need to be easy, quick and practicable. An easy and practical implementation of the tooth shade determination is to determine the tooth in a distance of arm’s length. Determination (< 20 sec) of dentin color only (area of interest) should be done under adequate illumination (artificial daylight, 5500K) and simultaneous neutralization of the field of interest (covering with windowed neutral grey carton). Electronic tools for tooth color matching are available today to dental practitioners. They might be helpful because of a high rate of reproducibility, could help to eliminate the influence of surrounding colors and can improve communication with the dental laboratory.
Conclusion
Based in the findings of this clinical study, the following conclusions were made:
Color perception is affected by the reflection and interference from the surrounding colors.
Tooth color differentiation requires reproducible standardized conditions for better results, which are usually not available in dental practice.
Environmental conditions plays a major role in tooth color determination, different colors of the surroundings leads to false determination of tooth color.
Color differentiation need “dazzle-free” standard environment conditions (neutral grey environmental conditions, daylight or artificial illumination) for better color matching results.
The effects of colorful outdoor clothing should be covered up by neutral grey scarf or pinafore and colorful makeup, especially lipstick should be removed.
The current effort of the standardization of tooth shade determination by International Standard Organisation (ISO) is complicated and complex due to involvement of experienced, trained human observers.
Acknowledgements: This study was supported by VITA Zahnfabrik, H.Rauter GmbH & Co, KG, and Germany.
References
- 1. Corcodel, N., Zenthöfer, A., Setz, J., et al. Estimating costs for shade matching and shade corrections of fixed partial dentures for dental technicians in Germany: A pilot investigation. (2011) Acta Odontol Scand 69(5): 319-320.
- 2. Park, J.H., Lee, Y.K., Lim, B.S., Influence of illuminants on the color distribution of shade guides. (2006) J Prosthet Dent 96(6): 402-411.
- 3. Wee, A.G., Meyer, A., Wu,W., et al. Lighting conditions used during visual shade matching in private dental offices. (2016) J Prosthet Dent 115(4): 469-474.
- 4. Dozic, A., Kharbanda, A.K., Kamell, H., et al. European dental students’ opinions about visual and digital tooth colour determination systems. (2011) J Dent 39(3): 23-28.
- 5. Munsell, A .H. Book of Color: The Color Sphere, Boston. (1929)
Pubmed || Crossref || Others
- 6. Hassel, A.J., Zenthofer, A., Corcodel, N., et al. Determination of VITA Classical shades with the 3D-Master shade guide. (2013) Acta Odontol Scand 71(3-4): 721-726.
- 7. Marcucci, B. A shade selection technique. (2003) J Prosthet Dent 89(5): 518-521.
- 8. Zenthöfer, A., Wiesberg, S., Hildenbrandt, A., et al. Selecting VITA classical shades with the VITA 3D-master shade guide. (2014) Int J Prosthodont 27(4): 376-382.
- 9. Sinmazisik, G., Trakyali, G., Tarcin, B. Evaluating the ability of dental technician students and graduate dentists to match tooth color. (2014) J Prosthet Dent 112(6): 1559-1566.
- 10. Llena, C., Forner, L., Ferrari, M., et al. Toothguide Training Box for dental color choice training. (2011) J Dent Educ 75(3): 360-364.
- 11. Haddad, H.J., Jakstat, H.A., Arnetzl, G., et al. Does gender and experience influence shade matching quality? (2009) J Dent 37(1): 40-44.
Pubmed || Crossref || Others
- 12. Kroger, E., Matz, S., Dekiff, M., et al. In vitro comparison of instrumental and visual tooth shade determination under different illuminants. (2015) J Prosthet Dent 114(6): 848-855.
- 13. Olms, C., Jakstat, H.A. Learning Shade Differentiation Using Toothguide Trainer and Toothguide Training Box: A Longitudinal Study with Dental Students. (2016) J Dent Educ 80(2): 183-190.
- 14. Olms, C., Klinke, T., Pirek, P., et al. Randomized multi-centre study on the effect of training on tooth shade matching. (2013) J Dent 41(12): 1259-1263.
- 15. Della Bona, A., Barrett, A.A., Rosa, V., et al. Visual and instrumental agreement in dental shade selection: three distinct observer populations and shade matching protocols. (2009) Dent Mater 25(2): 276-281.
- 16. Gokce, H.S., Piskin, B., Ceyhan, D., et al. Shade matching performance of normal and color vision-deficient dental professionals with standard daylight and tungsten illuminants. (2010) J Prosthet Dent 103(3): 139-147.
- 17. Gomez-Polo, C., Gomez-Polo, M., CeleminVinuela, A., et al. A clinical study relating CIELCH coordinates to the color dimensions of the 3D-Master System in a Spanish population. (2015) J Prosthet Dent 113(3):185-190.
- 18. Gomez-Polo, C., Munoz, M.P., Lorenzo Luengo, M.C., et al. Comparison of the CIELab and CIEDE 2000 color difference formulas. (2016) J Prosthet Dent 115(1): 65-70.
- 19. Gomez-Polo, C., Portillo Munoz, M., Lorenzo Luengo, M.C., et al. Comparison of two color-difference formulas using the Bland-Altman approach based on natural tooth color space. (2016) J Prosthet Dent 115(4): 482-488.
- 20. Dudea, D., Gasparik, C., Botos, A., et al. Influence of background/surrounding area on accuracy of visual color matching. (2016) Clin Oral Investig 20(6): 1167-1173.
- 21. Klinke, T., Olms, C., Pirek, P., et al. Influence of tounge position on the determination of tooth shade. (2017) J Prosthet Dent 117(2): 289-293.
- 22. Lehmann, K.M., Devigus, A., Igiel, C., et al. Repeatability of color-measuring devices. (2011) Eur J Esthet Dent 6(4): 428-435.
Pubmed || Crossref || Others
- 23. Lehmann, K.M., Igiel, C., Schmidtmann, I., et al. Four color-measuring devices compared with a spectrophotometric reference system. (2010) J Dent 38(2): 65-70.
- 24. Olms, C., Setz, J.M. The repeatability of digital shade measurement- A clinical study. (2013) Clin Oral Investig 17(4): 1161-1166.
- 25. Ratzmann, A., Klinke, T.U., Schwahn, C., et al. Reproducibility of electronic tooth colour measurements. (2008) Biomed Tech (Berl) 53(5): 259-263.
Pubmed || Crossref || Others
- 26. Borbely, J., Varsanyi, B., Fejerdy, P., et al. Toothguide Trainer tests with color vision deficiency simulation monitor. (2010) J Dent 38(2): 41-49.
- 27. Clarke, F.J.J., McDonald, R., Rigg, B. Modification to the JPC79 colour-difference formula. (1984) JSDC 100(4): 128-132.
- 28. Has, M., Newman, T. Color Management: Current Practice and the Adoption of a New Standard. (1998) conf paper 010: 9.
Pubmed || Crossref || Others
- 29. Dagg, H., O’Connell, B., Claffey, N., et al. The influence of some different factors on the accuracy of shade selection. (2004) J Oral Rehabil 31(9): 900-904.
- 30. ISO.ISO/TR 28642:2016 Dentistry-Guidanceon colour measurement.
Pubmed || Crossref || Others


