
Integration of OMICS Data for Obesity
Caroline Brettfeld1, Ales Maver1, Eva Aumüller1, Borut Peterlin1, Alexander G. Haslberger2*
Affiliation
- 1Department of Human Genetics, University of Ljubljana
- 2Department for Nutrition Sciences, University of Vienna
Corresponding Author
Alexander G. Haslberger, University Doz. Min.R, Department of Nutritional Sciences, University of Vienna, Althanstrasse 14; UZA II, 1090 Vienna, Austria ; Tel: +43 6991 2211212; E-mail: alexander.haslberger@univie.ac.at
Citation
Haslberger, G.H., et al. Integration of OMICS Data for Obesity. (2015) J Diab Obes 2(2): 67- 75.
Copy rights
© 2015 Haslberger, G.H. This is an Open access article distributed under the terms of Creative Commons Attribution 4.0 International License.
Keywords
Obesity; OMIC-data Integration; Microbiota; Inflammation
Abstract
Introduction: Obesity is a multifactorial condition that results from the interactions among genetic, dietary, environmental, and lifestyle factors. In our study, we have employed a novel integrative approach to identify mechanisms involved in human disease.
Method: In contrast to previous methodologies employed for integration of heterogeneous OMIC data, we based the integration on genomic positions of alterations in human disease. A data search for various types of studies on obesity (genome-wide association, meta-analysis, transcriptomic, proteomic studies and epigenetic studies) was conducted in literature sources and OMIC data repositories, using GWAS Central and Medline database with search string (obesity) AND (transcriptome OR proteome OR genome-wide OR microarray OR profiling OR epigenetics). Additionally, Gene Expression Omnibus (GEO) repository, Array Express and Stanford Microarray Database were searched to discover suitable sources of data for inclusion in our initial dataset.
Results and Discussion: As a result of the employed high through put technology, 71 high scoring regions were identified. We identified 8 high scoring gene regions (ATP5O, ALK7, CR1, CR2, S100, GAPDH, TLR1 and TLR6) that have not yet been associated to obesity. Interestingly, all of these genes were identified by Gene Ontology and Kyoto Encyclopedia of Genes and Genomes to be implicated in the energy metabolism and the immune response, which are known to be involved in obesity.
Conclusion: In our study, we have performed a novel integrative approach to identify candidate regions and genes involved in human disease. The results showed that none of the high scoring genes that were identified were yet associated with obesity per se, but that they were found to be implicated in the immune response or the energy metabolism. Further research will be needed to validate the found gene regions for obesity.
Introduction
Obesity is a multifactorial condition that results from the interactions among genetic, dietary, environmental, and lifestyle factors[1]. It has become an epidemic in the recent years primarily due to a higher intake in high-caloric food and a decrease in physical exercise[2]. The World Health Organization (WHO) estimates that worldwide approximately 1.6 billion adults are overweight (BMI > 25) and at least 400 million are obese (BMI > 30)[3]. Obesity is linked to increased morbidity due to cardiovascular diseases, to the development of insulin resistance and Type II diabetes mellitus, and to certain types of cancer[4].
Societal, economic, and cultural conditions have contributed to the rise in obesity[5]. People who live in poor communities may have less access to quality grocery stores that sell healthy and affordable options[6]. In these areas, it might be easier and cheaper for residents to purchase less healthy foods and beverages[6,7].
However, obesity also appears to be under strong genetic control, with numerous genes contributing to an individual’s predisposition towards obesity[8]. It is estimated that 40% to 70% of human fat mass is heritable[9]. Genome-wide scans have led to the identification of several chromosome regions that are likely to harbor genes determining susceptibility[10,11]. The human genome contains millions of single nucleotide polymorphisms (SNPs) which may be associated to the disease directly through effects on gene expression or protein function, or indirectly through the linkage disequilibrium[12]. Extensive molecular studies using experimental models, have helped establish critical pathways that regulate body fat and food intake[13,14]. Despite all efforts however, the genetic alterations identified cannot fully explain the observed heritability. Possible reasons for that might be the presence of (1) a much higher number of gene variants contributing to metabolic diseases than discovered until now, (2) copy number variations (CNV), (3) miRNAs, (4) epigenetics, and/or (5) more complex alterations such as large deletions or duplications.
The term epigenetics refers to heritable changes in gene expression that does not involve changes to the underlying DNA sequence. Epigenetic mechanisms explain how different phenotypes can arise from the same genotype. The viable yellow (Avy/a) mouse strain provided the earliest model for studying epigenetic inheritance in mammals[15,16] and also provided insight into the metabolic syndrome[17-19]. Depending on the mother’s diet during pregnancy the agouti gene of the offspring is activated or silenced. An active agouti gene leads to a yellow coat color and the mouse develops obesity and associated metabolic disorders[17,18]. The offspring with the silenced agouti gene shows a brown fur and they stay lean and healthy[15,16,20]. These studies demonstrated that both the quantity and quality of the food a pregnant woman consumes during her pregnancy can influence the risks or protection of her infant towards a disease, presumably by modulating epigenetic modifications on genes encoding key metabolic enzymes and hormones[21-23].
Further, research has indicated that the risk of developing metabolic disorders may also involve factors from the intestinal microbiome (also termed the gut metagenome), which originates from the gastrointestinal microbiota colonizing the humans gut. The composition of the intestinal microbiome could affect our predisposition to obesity or even other complex diseases[24].
The composition and metabolism of the gut microbiota is influenced through lifestyle and diet. Thus, a high-fat as well as a high-fructose diet was shown to impact the circulating levels of lipo polysaccharides (LPS) and endotoxins produced by gram-negative bacteria.
For common multi factorial traits like obesity, GWAS have been very informative but have not addressed much of the heritable risk. Rarer variants may prove important but in general, more integrated approaches are needed in which environmental risk factors are considered and combined with functional genomics analyses.
We utilized a new approach for integration of such multi-origin data based on positions of genetic alterations occurring in obesity to identify possible new gene regions of interest for further investigation.
Methods
A data search for various types of studies on obesity (genome-wide association, meta-analysis, transcriptomic, proteomic studies and epigenetic studies) was conducted in online repositories, using GWAS Central (http://www.gwascentral.org) Medline database (http://www.ncbi.nlm.nih.gov/pubmed/) with search string (obesity) AND (transcriptome OR proteome OR genome-wide OR microarray OR profiling OR epigenetics). Additionally, Gene Expression Omnibus (GEO) repository (http://www.ncbi.nlm.nih.gov/geo/), ArrayExpress (http://www.ebi.ac.uk/arrayexpress/) and Stanford Microarray Database (http://smd.stanford.edu) were searched to discover suitable sources of data for inclusion in our initial dataset. Studies that were conducted in adults (male and female) of any ethnic origin were included in the data set. Studies conducted in animals, children or elderly, and studies missing information of gender, age, study design and ethnicity were excluded from the data set. The data search was started from the Jan 01, 2000 to Jan 01, 2014.
GWAS and Meta-Analysis
Data from 20 GWA Studies and Meta Analysis were obtained and are listed in Table 1[25-46].
Table 1: List of GWAS and Meta-Analysis for initial Data Set
| Name | Number of Individuals | Analytical Method | Total Markers Imported | Related citations |
|---|---|---|---|---|
| GWAS of adiposity-related heterogeneity in patterns of type II diabetes susceptibility | Initial Panel 4,862 (Cases 1,924, Controls 2,938)Second Panel 9,103 (Cases 3,757, Controls 5,346) | Affymetrix 393,453 | 5 | Timpson NJ et al.[25] Hindorff LA et al.[26] |
| GWAS of type II diabetes mellitus | 5,975 (Cases 531, Controls 5,275) | Hap300 | 55 | Steinthorsdottir V et al.[27] Johnson AD et al.[28] |
| GWAS of waist circumference in individuals of Caucasian descent | Initial Panel 31,373 Replication Panel 38,641 | Affymetrix & Illumina up to 512,349 | 7 | Heard-Costa NL et al.[29] Hindorff LA et al.[26] |
| GWAS of extreme obesity | 3,972 (Cases 775, Controls 3,197) | Illumina 457,251 | 13 | Cotsapas C et al.[30] Hindorff LA et al.[26] |
| GWAS of body mass index | 10,657 | Affymetrix 490,032 | 1 | Frayling TM et al.[31] Hindorff LA et al.[26] |
| GWAS of body mass index in individuals of European descent | 16,876 | Affymetrix 344,883 | 2 | Loos RJ et al.[32] Hindorff LA et al.[26] |
| GWAS of body mass index | 32,387 | Illumina and Affymetrix 2,399,588 | 11 | Willer CJ et al.[33] Hindorff LA et al. [26] |
| GWAS of body mass index and weight | 80,969 | Illumina 305,846 | 17 | Thorleifsson G et al.[34] Hindorff LA et al.[26] |
| GWAS of body mass index and waist circumference in the Framingham Heart Study | 1,341 | Affy100K | 34 | Fox CS et al. [35] Johnson AD et al.[28] Hindorff LA et al.[26] |
| GWAS of obesity-related traits | 4,298 | Affy10K Affy500K | 37 | Scuteri A et al.[36] Johnson AD et al[28]. Hindorff LA et al.[26] |
| GWAS of weight and body mass index | 3,925 | Illumina 318,237 | 6 | Johansson A et al.[37] Hindorff LA et al.[26] |
| GWAS of extreme obesity | Initial Panel 5,373 (Cases 2,633, Controls 2,740) Replication Panel 29,181 | Illumina 545,349 | 4 | Paternoster L et al.[38] Hindorff LA et al.[26] |
| GWAS of obesity | Initial Panel 1,060 (Cases 520, Controls 540) Replication Panel 1,196 | Illumina ~550,000 | 4 | Wang K et al.[39] Hindorff LA et al.[26] |
| GWAS of obesity | Initial Panel 327 (Cases 164, Controls 163) Replication Panel 10,337 (Cases 4,674, Controls 5,663) | Affymetrix 406,177 | 2 | Jiao H et al.[40] Hindorff LA et al.[26] |
| GWAS of body mass index | Initial Panel 1,715 Replication Panel 3,274 | Affymetrix 746,626 | 2 | Ng MC et al.[41] Hindorff LA et al.[26] |
| GWAS of body mass index | Initial Panel 123,865 Replication Panel 125,931 | Affymetrix, Illumina and Perlegen ~2.8 million (imputed) | 38 | Speliotes EK et al.[42] Hindorff LA et al.[26] |
| Meta-analysis of extreme obesity | Initial Panel 2,258 Replication Panel A 5,829 Replication Panel B 31,182 | Affymetrix & Illumina 1,596,878 (imputed) | 5 | Scherag A et al.[43] Hindorff LA et al.[26] |
| GWAS of adult body mass index in a British population | 9,377 | Affymetrix GeneChip Mapping 500K Illumina Infinium HumanHap550 | 528,865 | Strachan DP et al.[44] |
| GWAS of obesity | 10,391 | Illumina 1,283,957 (imputed) | 1 | Dorajoo R et al.[45] Hindorff LA et al.[26] |
| Meta-analysis of GWAS informative for adult waist circumference and waist-hip ratio | Initial Panel 38,580 Replication Panel 102,064 | Affymetrix & Illumina 2,573,738 (imputed) | 3 | Lindgren CM et al.[46] Hindorff LA et al.[26] |
List of all included GWA studies and Meta-analysis studies, with additional information on the number of participants, the analytical method, markers that were imported, as well as the references.
Transcriptional Data
Raw data on transcriptomic alterations in adipose, omental, subcutaneous fat, as well as liver and skeletal muscle were obtained from GEO repository. Transcriptomic alterations were treated as separate data sets to account for possible differences in transcriptional alterations observed in these tissues samples[47-54].
Proteomic, microRNA Data and Epigenetics
We have included three studies investigating proteomic, microRNA and Epigenetic alterations by Arner E et al[53], Hittel DS et al[55] and Wang X et al[56]. The three studies were treated as separate datasets to account for their different biological layer and the different tissues samples that were utilized for the analysis.
Graph 1 depicts the distribution of all studies engaged in the data set.
Graph 1: Distribution of all included Studies
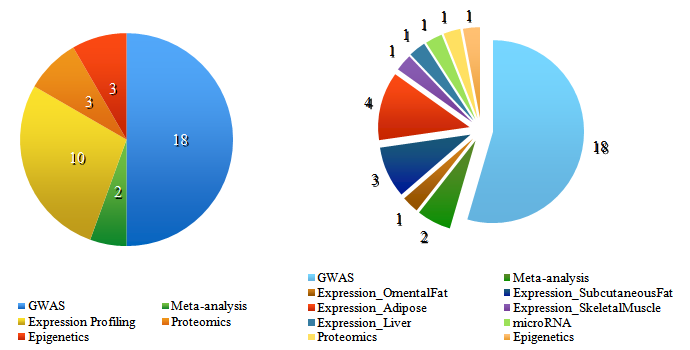
The pie chart on the left shows how many types of studies (GWAS-, Meta-analysis-, Expression-, Proteomic- and Epigenetic Data) were included in our investigated data set. The chart on the right splits up the Expression Data further as here the tissue information was given to separate data sets to account for possible differences in transcriptional alterations observed in these tissue samples.
The pie chart on the left shows how many types of studies (GWAS, Meta-analysis-, Expression-, Proteomic- and Epigenetic Data) were included in our investigated data set. The chart on the right splits up the Expression Data further as here the tissue information was given to separate data sets to account for possible differences in transcriptional alterations observed in these tissue samples.
Positional integration introduced by Maver et al[57] in 2011 was performed by mapping significant signals from included types of studies. The tool allows the user to weigh the different data sets and select the kb length. Weighing settings were not adjusted and as mentioned above a 50kb length was selected.
For this approach, hg19 genomic backbone was divided in bins of 50kb length and the signals coming from OMIC studies were distributed in those bins. Subsequently, our initial data assembly was subdivided into 50kb regions, and signals from aforementioned studies were arranged into the corresponding regions according to their genomic positionby the Integratomics Software.
Evaluation was performed by searching for a direct association of genes located in top regions selected by the integration process and obesity in the Medline database (http://www.ncbi.nlm.nih.gov/pubmed). The search was performed on articles that appeared in Medline using the following search string: ‘Obesity AND Gene, ’where ‘Gene’ entry represented candidate genes located in the regions discovered by the integration process.
Additionally functional profiles of genes located in the set of top region have been profiled using Gene Ontology (GO, http://www.geneontology.org[58]) and Kyoto Encyclopedia of Genes and Genomes (KEGG, http://www.genome.jp/kegg/[59]).
Results and Discussion
The positional integration approach yielded a prioritized list of genomic region, where the regions containing the highest accumulation of diverse biological alterations in obesity rank highest.
Table 2: List of Expression Data for initial Data Set
| Identification No. | Title | Number of Individuals | Analytical Method | Refernce |
|---|---|---|---|---|
| GSE20950 | Morbidly obese insulin-resistant patients: omental and subcutaneous adipose tissue | 10 | Affymetrix Human Genome U133 Plus 2.0 Array & real time PCR | Hardy OT, Perugini RA, Nicoloro SM, Gallagher-Dorval K et al.[47] |
| GSE27951 | Adipogenesis and obesity: subcutaneous adipose tissue (HG-U133_Plus_2) | 20 | Affymetrix Human Genome U133 Plus 2.0 Array | Keller P, Gburcik V, Petrovic N, Gallagher IJ et al.[48] |
| GSE15524 | Morbid obesity: subcutaneous and omental adipose tissues | 11 | CodeLink UniSet Human 20K I Bioarray | MacLaren RE, Cui W, Lu H, Simard S et al.[49] |
| GSE474 | Obesity and fatty acid oxidation | 16 | Affymetrix Human Genome U133A Array | Park JJ, Berggren JR, Hulver MW, Houmard JA et al.[50] |
| GSE15773 | Obesity-associated insulin resistance independent of BMI: omental and subcutaneous adipose tissues | 20 | Affymetrix Human Genome U133 Plus 2.0 Array | Hardy OT, Perugini RA, Nicoloro SM, Gallagher-Dorval K et al.[47] |
| GSE15653 | Obese patients with and without type 2 diabetes: liver | 18 (Cases 13, Controls 5) | Affymetrix Human Genome U133A Array | Pihlajamäki J, Boes T, Kim EY, Dearie F et al.[51] |
| GSE22435 | Expression of Splicing Factor Genes is Reduced in Human Obesity and Contributes to Enhanced Lipogenesis | 17 (Cases 7, Controls 10) | Affymetrix Human Genome U133 Plus 2.0 Array | Pihlajamäki J, Lerin C, Itkonen P, Boes T et al.[52] |
| GSE25401 | Adipose Tissue MicroRNAs as Regulators of CCL2 Production in Human Obesity [gene expression] | 56 (Cases 30, Conroles 26) | Affymetrix Human Gene 1.0 ST Array | Arner E, Mejhert N, Kulyté A, Balwierz PJ et al.[53] |
| GSE25402 | Adipose Tissue MicroRNAs as Regulators of CCL2 Production in Human Obesity | 56 | Affymetrix Human Gene 1.0 ST Array [transcript (gene) version] | Arner E, Mejhert N, Kulyté A, Balwierz PJ et al.[53] |
| GSE24883 | Worsening of Obesity and Metabolic Status Yields Similar Molecular Adaptations_Subcutaneous and Visceral Adipose Tissue | 32 | Agilent-014850 Whole Human Genome Microarray 4x44K G4112F (Feature Number version) | Klimcáková E, Roussel B, Márquez-Quiñones A, Kovácová Z et al.[54] |
List of Expression Data with additional information on the number of individuals, analytical data and the study reference.
Graph 2: Genome-wide distribution of significance value for integrated regions
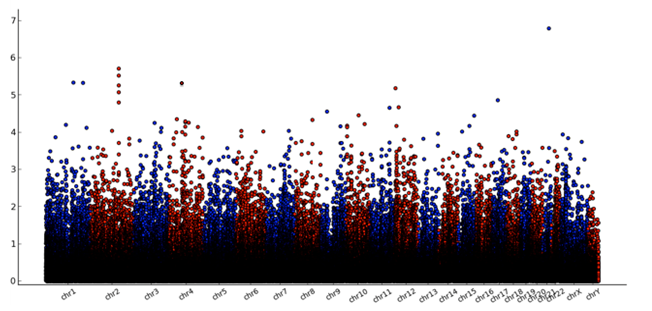
Graph 2 gives a first impression of our high scoring gene regions. A genome-wide plot displays the distribution of calculated P-values across the genome. X-axis represents locations of the region on genomic backbone and Y-axis represents −log10p estimates of P-values obtained permutation.
With the Integratomics Software[57] we identified 71 regions (see Supplementary data) that scored with a value 3,8. For our evaluation we selected the 8 highest scoring gene regions that are shown in Table 3 and investigated their association to obesity and there functional profile.
Supplimentary Data
| Gene Name | Chromosome Name | Region start | Region stop | Score |
|---|---|---|---|---|
| ATP5O | chr21 | 35275000 | 35324999 | 6.8 |
| ALK7 | chr2 | 158375000 | 158524999 | 5.7 |
| CR1 | chr1 | 207650000 | 207699999 | 5.3 |
| CR2 | chr1 | 207650000 | 207699999 | 5.3 |
| S100A1 | chr1 | 153600000 | 153649999 | 5.3 |
| GAPDH | chr12 | 6625000 | 6674999 | 5.2 |
| TLR1 | chr4 | 38825000 | 38874999 | 5.2 |
| TLR6 | chr4 | 38825000 | 38874999 | 5.2 |
| NCAPD2 | chr12 | 6625000 | 6674999 | 5.2 |
| IFFO1 | chr12 | 6625000 | 6674999 | 5.2 |
| S100A13 | chr1 | 153600000 | 153649999 | 5.2 |
| CHTOP | chr1 | 153600000 | 153649999 | 5.1 |
| RHOT1 | chr17 | 30550000 | 30599999 | 4.9 |
| ATM | chr11 | 108150000 | 108199999 | 4.7 |
| GLULP4 | chr9 | 34900000 | 34949999 | 4.6 |
| YWHAZP6 | chr9 | 34900000 | 34949999 | 4.6 |
| DDX50 | chr10 | 70650000 | 70699999 | 4.5 |
| STOX1 | chr10 | 70650000 | 70699999 | 4.5 |
| ATP8A1 | chr4 | 42400000 | 42449999 | 4.4 |
| IQGAP1 | chr15 | 90925000 | 90974999 | 4.4 |
| RAD23B | chr9 | 110025000 | 110074999 | 4.4 |
| SHISA3 | chr4 | 42400000 | 42449999 | 4.4 |
| FAM13A | chr4 | 89650000 | 89999999 | 4.3 |
| HADH | chr4 | 108900000 | 108949999 | 4.3 |
| LSAMP | chr3 | 115850000 | 115899999 | 4.3 |
| NIPAL2 | chr8 | 99300000 | 99349999 | 4.3 |
| CEPT1 | chr1 | 111675000 | 111724999 | 4.2 |
| CUEDC2 | chr10 | 104175000 | 104224999 | 4.2 |
| DAPK2 | chr15 | 64200000 | 64249999 | 4.2 |
| DRAM2 | chr1 | 111675000 | 111724999 | 4.2 |
| ETV6 | chr12 | 11875000 | 11924999 | 4.2 |
| FAM13A-AS1 | chr4 | 89650000 | 89699999 | 4.2 |
| FBXL15 | chr10 | 104175000 | 104224999 | 4.2 |
| MIR146B | chr10 | 104175000 | 104224999 | 4.2 |
| PFKFB3 | chr10 | 6175000 | 6324999 | 4.2 |
| PSD | chr10 | 104175000 | 104224999 | 4.2 |
| ADCK3 | chr1 | 227175000 | 227224999 | 4.1 |
| ARHGEF26 | chr3 | 153950000 | 153999999 | 4.1 |
| CDC42BPA | chr1 | 227175000 | 227224999 | 4.1 |
| RAPGEF2 | chr4 | 160275000 | 160324999 | 4.1 |
| AIF1 | chr6 | 31575000 | 31624999 | 4.0 |
| CNKSR3 | chr6 | 154725000 | 154774999 | 4.0 |
| GOLGA8IP | chr15 | 23250000 | 23299999 | 4.0 |
| GRM8 | chr7 | 126350000 | 126399999 | 4.0 |
| IGSF10 | chr3 | 151150000 | 151199999 | 4.0 |
| IRS2 | chr13 | 110400000 | 110449999 | 4.0 |
| MED12L | chr3 | 151150000 | 151199999 | 4.0 |
| PRRC2A | chr6 | 31575000 | 31624999 | 4.0 |
| PTPN4 | chr2 | 120725000 | 120774999 | 4.0 |
| SLC4A4 | chr4 | 72425000 | 72474999 | 4.0 |
| SNORA38 | chr6 | 31575000 | 31624999 | 4.0 |
| TXNL1 | chr18 | 54275000 | 54349999 | 4.0 |
| UQCRHP1 | chr6 | 31575000 | 31624999 | 4.0 |
| WDR7 | chr18 | 54300000 | 54349999 | 4.0 |
| C2 | chr6 | 31875000 | 31924999 | 3.9 |
| CFB | chr6 | 31875000 | 31924999 | 3.9 |
| ECHDC2 | chr1 | 53375000 | 53424999 | 3.9 |
| EGFL6 | chrX | 13600000 | 13649999 | 3.9 |
| MIR1273F | chr1 | 53375000 | 53424999 | 3.9 |
| RAB31 | chr18 | 9725000 | 9774999 | 3.9 |
| SCP2 | chr1 | 53375000 | 53424999 | 3.9 |
| SORBS2 | chr4 | 186775000 | 186824999 | 3.9 |
| CBX5 | chr12 | 54650000 | 54699999 | 3.8 |
| DHX15 | chr4 | 24525000 | 24574999 | 3.8 |
| DTNA | chr18 | 32425000 | 32474999 | 3.8 |
| FLT1 | chr13 | 28875000 | 28924999 | 3.8 |
| HNRNPA1 | chr12 | 54650000 | 54699999 | 3.8 |
| LUC7L2 | chr7 | 139075000 | 139124999 | 3.8 |
| MAOB | chrX | 43675000 | 43724999 | 3.8 |
| MIR3155A | chr10 | 6175000 | 6224999 | 3.8 |
| PECR | chr2 | 216900000 | 216949999 | 3.8 |
Table 3: High scoring gene regions
| Gene Name | Chromosome Name | Region start | Region stop | Score |
|---|---|---|---|---|
| ATP5O | chr21 | 35275000 | 35324999 | 6.8 |
| ALK7 | chr2 | 158375000 | 158524999 | 5.7 |
| CR1 | chr1 | 207650000 | 207699999 | 5.3 |
| CR2 | chr1 | 207650000 | 207699999 | 5.3 |
| S100 | chr1 | 153600000 | 153649999 | 5.3 |
| GAPDH | chr12 | 6625000 | 6674999 | 5.2 |
| TLR1 | chr4 | 38825000 | 38874999 | 5.2 |
| TLR6 | chr4 | 38825000 | 38874999 | 5.2 |
The table displays the 8 highest scoring genes that were selected from the supplementary data and were investigated for this study.
ATP5O is described as a nuclear encoded subunit of complex V of the respiratory chain. Its location is based in the stem of the ATP synthase complex where it seems to havebuilt a connection to the catalytic core (F1 subunit) and the membrane proton channel (F0 subunit), thereby manipulating the transmission of conformational alterations and proton conductance[60]. In an mRNA expression profile performed by Mootha et al[61] ATP5O was the most reduced OXPHOS gene in skeletal muscle from patients with T2D compared with healthy control subjects. Rönn et al[62] performed a twin study, which identified that genetic variations in the ATP5O gene region is linked-to- with mRNA expression in skeletal muscle and glucose uptake in young twins. Interestingly, it was shown in a number of respective studies that aging has a negative effect on ATP5O mRNA expression, which is also in line with findings for other OXPHOS genes[63-65]. These findings suggest combinations of genetic and non-genetic factors may shape the reduced expression of ATP5O in T2D[62], which would be in line with our performed integration study for obesity..
Activin receptor-like kinase 7 (ALK7) has been identified to be expressed in pancreatic islets and beta-cell lines[66]. In a study by Watanabe R. et al[67] it was observed, that human insulin promoter was mobilized in ALK7 pathway by Smad2, Smad3 and homeobox factor-1 (PDX-1) of pancreas and duodenum. The study results indicate that one of the direct target genes of Nodal and Activin AB signals is the insulin gene in pancreatic beta-cells and that PDX-1 is directly involved in the ALK7-Smad pathway[67-69]. ALK7 does not indicate a direct connection to obesity, however it suggests a strong implication to T2D.
Another identified region was CR1 (Complement Receptor 1), a membrane receptor for C3b and C4b, found on leukocytes, erythrocytes and podocytes. It plays an essential role in the irradiation of immune complexes and pathogens coated with C3b and C4b. It also regulates the complement cascade activation by preventing formation of classical and alternative pathways from converting and by helping as a cofactor for factor 1 mediated cleavage of C3b to iC3b, C3c and C3dg. CR1 is a polymorphic molecule, which means it can alter in molecular weight and the level of the CR1 expression on erythrocytes. It takes part in pathogenesis and development of various autoimmune and infectious diseases[70]. Reduction in expression of this protein has been linked with gallbladder carcinomas, mesangio-capillary glomerulonephritis, systemic lupus erythematosus and sarcoidosis.
Additionally, we also revealed a high score for the CR2 (Complement Receptor 2)region. Recent studies have indicated that CR2 polymorphisms may be linked to immunologically mediated diseases such as systemic lupus erythematosus[71] and multiple sclerosis[72]. CR2 encodes a membrane protein, which functions as a receptor for Epstein-Barr virus (EBV) binding on B and T lymphocytes.
Further, we identified the region coding for S100. The protein that is encoded by the S100 gene is a member of the S100 family. S100 proteins are found in the cytoplasm and nucleus of many different cells, and implicated in many cellular processes. S100 genes include probably 13 or even more members which are localized in form of a cluster on chromosome 1q21. A possible function of the protein is the stimulation of Ca2+-induced Ca2+ release, inhibition of microtubule assembly, and inhibition of protein kinase C-mediated phosphorylation. One of the most recent studies showed that S100 expression and interleukin-10 polymorphisms associated with ulcerative colitis and diarrhea predominant irritable bowel syndrome[73], which have been also associated with obesity[74].
Another high score region we found is GAPDH. GADPH encodes a member of the glyceraldehyde-3-phosphate dehydrogenase protein family. It is responsible of catalyzing an important energy-yielding move in carbohydrate metabolism, which is the reversible oxidative phosphorylation of glyceraldehyde-3-phosphate in the presence of inorganic phosphate and nicotinamide adenine dinucleotide[75].
GADPH was previously implicated and discussed in neurodegenerative diseases[76] and different types of cancers[77]. GAPDH is a glycolytic enzyme with multiple functions. Hwang et al. 2009[78] study confirms that a major oxidative target of reactive oxygen species (ROS) is GAPDH. One consequence of oxidative stress is a fall in cellular ATP levels and choked glycolysis[79,80], due to the inactivation of the glycolytic enzyme GAPDH[81].
Finally, TLR1 (toll-like receptor 1) and TLR6 (toll-like receptor 6) belong to a class of proteins that play a major role in the innate immune system. TLRs are single, membrane-spanning receptors, non-catalytic, that are usually expressed in cells such as dendritic cells and macrophages that are able to identify structurally conserved molecules derived from microorganisms. Once the microbes have overcome the physical barrier such as the skin or intestinal tract mucosa, they are recognized by TLRs, which initiate immune cell responses[82]. TLR3, TLR7, TLR8, and TLR9 are expressed in intracellular compartments to discover microbial nucleic acids, whereas TLR1, TLR2, TLR4, TLR5, TLR6, and TLR11 are expressed on cell surfaces and detect mainly microbial membrane components. Specifically, TLR2 forms heterodimers with TLR1 or TLR6 to recognize peptidoglycan, lipopeptides and lipoteichoic acid from gram-positive bacteria[82,83]. It has been hypothesized that alterations of TRLs/ligands may contribute to the pathogenesis of human diseases, especially to age-related diseases, such as cardiovascular diseases, diabetes, neurodegenerative diseases and cancers[83,84] which are all also risk factors for obesity[4].
We observed that none of the high scoring genes could be associated to obesity per se, but that they were found to be implicated in the immune response or the energy metabolism.
In our study, we performed a novel integrative approach to identify candidate regions and genes involved in human disease. In contrast to previous methodologies employed for integration, this approach is based on genomic positions of alterations in human disease. The approach was used for discovery of putative regions and genes related to obesity, using a comprehensive and unique set of data sources (GWAS, expression studies, proteomic studies and epigenetic).
In the past there have been many different ways to integrate data, starting with meta-analysis to merge raw data which may be obtained in public repositories, combining several studies to increase statistical power. The known limitations being that meaningful raw data simply not be available for most studies, especially when combining different sources of data such as genomic and proteomic data. Cahan et al[85] suggested to improve meta-analysis and meta reviews with the aid of a “scheme” framework that integrates all omics data with diverse approaches taken from different studies. As one example, the Public Health Genomics–Common Complex Diseases (PHG–CCD) model by Taneri et al[86], which integrates four main sources of data, personal genome data, personal enviroment data, molecular genetics/genomic evidence and environmental factors implicated in gene–environment interactions underlying common complex disease phenotypes could be mentioned. A second example could be the model by Bochud et al[87], which suggests to identify environmental exposures, genetic susceptibility factors and gene-environmental and gene-gene interactions over a life-time. Both of the framework approaches suffer from the lack of data and the ability to integrate data from different sources.
Two more gene-centric based integration issues were discussed by Maver et al[57]. The first limitation may arise due to contradictions in gene annotation used for publishing the results in various types of large-scale studies. Annotations for reporting significant results of these studies are often provided using differing annotations. Transformation of these annotations to a common gene identifier is often associated with challenges.
The second discussed limitation is that gene regions located outside the gene’s coding region that may account for disease susceptibility may be overlooked[58]. Various genetic alterations are adjacent to gene regulatory regions several kilo bases upstream or downstream and impact gene expression and/or function[88].
We based the integration of data from various types of studies on positions of genetic alterations associated with obesity, to address the prior mentioned limitations. Limitations due to inadequate conversion of annotations were tackled by converting annotations to their positions on genome coordinates. Where we could not perform a conversion, we utilized BLAST services to find the corresponding genomic positions. This approach also takes into consideration interplays between adjacent genetic alterations and is not limited by the nature of genetic changes to be included in the integration process. It is flexible enough to permit inclusion of anticipated data from studies investigating epigenetic modifications and microRNA changes in human disease.
To point out a possible difficulty of the position-centric integration approach we have to mention the choice of region size used for integration, which is not straight forward. Choosing a region too small may result in missing important long-range interactions, while choosing a larger region may result in high amount of false positive genes.
Conclusion
Obesity is a multifactorial disease, which is correlated with multi-organ damage and increased susceptibility to cardiovascular disease, cancer onset and progression, and infections such as influenza. Obesity is a state of low-grade, chronic inflammation linked with changes in immune cell populations, including dynamic fluxes in the number and types of cells found within the inflamed tissue. Also, immune cells have been shown to infiltrate adipose tissues at the onset of weight gain and directly contribute to continuous weight gain, persistent adipose inflammation, and systemic insulin resistance.
In our study, we performed a novel integrative approach to identify candidate regions and genes involved in human disease. The results showed that none of the high scoring genes that were identifiedwere yet associated with obesity per se, but that they were found to be implicated in the immune response or the energy metabolism. Of course, further research is necessary to validate the found results for obesity. A possible next investigation step could be the weighing of the different OMICS layers, network analysis and evaluation of the identified gene regions.
Conflict of Interest No Conflict of Interest
References
- 1. Boutin, P., Philippe, F. Genetics of human obesity. (2001) Best Practice & Research Clinical Endocrinology & Metabolism 15(3): 391- 404.
- 2. National Institutes of Health. Clinical guidelines on the identification, evaluation, and treatment of overweight and obesity in adults—the evidence report. (1998) Obes Res 6 (suppl 2): 51S– 209S.
- 3. World Health Organization. (2008) Obesity.
- 4. Kopelman, P. Health risks associated with overweight and obesity. (2007) Obes Rev 8(Suppl 1): 13– 17.
- 5. McLaren, L. Socioeconomic status and obesity. (2007) Epidemiol Rev 29: 29– 48.
- 6. Winkleby, M.A., Gardner, C.D., Taylor, C.B. The influence of gender and socioeconomic factors on Hispanic/white differences in body mass index. (1996) Prev Med 25(2): 203– 211.
- 7. Seidell, J.C. Obesity, insulin resistance and diabetes-a worldwide epidemic. (2000) Br J Nutr 83(S1): S5- S8.
- 8. Bell, C.G., Walley, A.J., Froguel, P. The genetics of human obesity. (2005) Nat Rev Genet 6(3): 221- 234.
- 9. Herbert, A. The fat tail of obesity as told by the genome. (2008) Curr Opin Clin Nutr Metab Care 11(4): 366-370.
- 10. Chen, Y., Zhu , J., Lum, P.Y., et al. Variations in DNA elucidate molecular networks that cause disease. (2008) Nature 452(7186): 429- 435.
- 11. Ng, M.C., So, W.Y., Lam, V.K., et al. Genome-wide scan for metabolic syndrome and related quantitative traits in Hong Kong Chinese and confirmation of a susceptibility locus on chromosome 1q21-q25. (2004) Diabetes 53(10): 2676- 2683.
- 12. Loktionov, A. Common gene polymorphisms and nutrition: emerging links with pathogenesis of multifactorial chronic diseases (review). (2003) J Nutr Biochem 14(8): 426- 451.
- 13. Blakemore, A.I., Froguel, P. Is obesity our genetic legacy? (2008) J Clin Endocrinol Metab 93(11 Suppl 1): S51- S56.
- 14. Lee, Y.S. The role of genes in the current obesity epidemic. (2009) Ann Acad Med Singapore 38(1): 45- 53.
- 15. Cooney, C.A., Dave, A.A., Wolff, G.L. Maternal methyl supplements in mice affect epigenetic variation and DNA methylation of offspring. (2002) J Nutr 132(8 Suppl): 2393S– 2400S
- 16. Wolff, G.L., Kodell, R.L., Moore, S.R., et al. Maternal epigenetics and methyl supplements affect agouti gene expression in Avy/a mice. (1998) FASEB J 12(11): 949– 957.
- 17. Wolff, G.L., Roberts, D.W., Galbraith, D.B. Prenatal determination of obesity, tumor susceptibility, and coat color pattern in viable yellow (Avy/a) mice. The yellow mouse syndrome. (1986) J Hered 77(3): 151– 158.
- 18. Wolff, G.L., Roberts, D.W., Mountjoy, K.G. Physiological consequences of ectopic agouti gene expression: The yellow obese mouse syndrome. (1999) Physiol Genomics 1(3): 151– 163.
- 19. Klebig, M.L., Wilkinson, J.E., Geisler, J.G., et al. Ectopic expression of the agouti gene in transgenic mice causes obesity, features of type II diabetes, and yellow fur. (1995) Proc Natl Acad Sci USA 92(11): 4728– 4732.
- 20. Waterland, R.A., Jirtle, R.L. Transposable elements: Targets for early nutritional effects on epigenetic gene regulation. (2003) Mol Cell Biol 23(15): 5293– 5300.
- 21. Godfrey, K.M., Sheppard, A., Gluckman, P.D., et al. Epigenetic gene promoter methylation at birth is associated with child’s later adiposity. (2011) Diabetes 60(5): 1528- 1534.
- 22. Lillycrop, K.A. Effect of maternal diet on the epigenome: Implications for human metabolic disease. (2011) Proc Nutr Soc 70(1): 64– 72.
- 23. Weaver, I.C. Shaping adult phenotypes through early life environments. (2009) Birth Defects Res C Embryo Today 87(4): 314– 326.
- 24. Vijay-Kumar, M., Aitken, J.D., Carvalho, F.A., et al. Metabolic syndrome and altered gut microbiota in mice lacking Toll-like receptor 5. (2010) Science 328(5975): 228- 231.
- 25. Timpson, N.J., Lindgren, C.M., Weedon, M.N., et al. Adiposity-related heterogeneity in patterns of type 2 diabetes susceptibility observed in genome-wide association data. (2009) Diabetes 58(2): 505- 510.
- 26. Hindorff, L.A., Sethupathy, P., Junkins, H.A., et al. Potential etiologic and functional implications of genome-wide association loci for human diseases and traits. (2009) Proc Natl Acad Sci USA 106(23): 9362- 9367.
- 27. Steinthorsdottir, V., Thorleifsson, G., Reynisdottir, I., et al. A variant in CDKAL1 influences insulin response and risk of type 2 diabetes. (2007) Nat Genet 39(6): 770- 775.
- 28. Johnson, A.D., O'Donnell, C.J. An open access database of genome-wide association results. (2009) BMC Med Genet 10(1): 6.
- 29. Heard-Costa, N.L., Zillikens, M.C., Monda, K.L., et al. NRXN3 is a novel locus for waist circumference: a genome-wide association study from the CHARGE Consortium. (2005) PLoS Genet 5(6): e1000539.
- 30. Cotsapas, C., Speliotes, E.K., Hatoum, I.J., et al. Common body mass index-associated variants confer risk of extreme obesity. (2009) Hum Mol Genet 18(18): 3502- 3507.
- 31. Frayling, T.M., Timpson, N.J., Weedon, M.N., et al. A common variant in the FTO gene is associated with body mass index and predisposes to childhood and adult obesity. (2007) Science 316(5826): 889- 894.
- 32. Loos, R.J., Lindgren, C.M., Li, S., et al. Common variants near MC4R are associated with fat mass, weight and risk of obesity. (2008) Nat Genet 40(6): 768- 775.
- 33. Willer, C.J., Speliotes, E.K., Loos, R.J., et al. Six new loci associated with body mass index highlight a neuronal influence on body weight regulation. (2009) Nat Genet 41(1): 25- 34.
- 34. Thorleifsson, G., Walters, G.B., Gudbjartsson, D.F., et al. Genome-wide association yields new sequence variants at seven loci that associate with measures of obesity. (2009) Nat Genet 41(1): 18- 24.
- 35. Fox, C.S., Heard-Costa, N., Cupples, L.A., et al. Genome-wide association to body mass index and waist circumference: the Framingham Heart Study 100K project. (2007) BMC Med Genet 8(Suppl 1): S18.
- 36. Scuteri, A., Sanna, S., Chen, W.M., et al. Genome-wide association scan shows genetic variants in the FTO gene are associated with obesity-related traits. (2007) PLoS Genet 3(7): e115.
- 37. Johansson, A., Marroni, F., Hayward, C., et al. Linkage and genome-wide association analysis of obesity-related phenotypes: association of weight with the MGAT1 gene. (2010) Obesity (Silver Spring) 18(4): 803- 808.
- 38. Paternoster, L., Evans, D.M., Nohr, E.A., et al. Genome-wide population-based association study of extremely overweight young adults–the GOYA study. (2011) PLoS One 6(9): e24303.
- 39. Wang, K., Li, W.D., Zhang, C.K., et al. A genome-wide association study on obesity and obesity-related traits. (2011) PloS One 6(4): e18939
- 40. Jiao, H., Arner, P., Hoffstedt, J., et al. Genome wide association study identifies KCNMA1 contributing to human obesity. (2011) BMC Med Genomics 4(1): 51.
- 41. Ng, M.C., Hester, J.M., Wing, M.R., et al. Genome-Wide Association of BMI in African Americans. (2012) Obesity (Silver Spring) 20(3): 622- 627.
- 42. Speliotes, E.K., Willer, C.J., Berndt, S.I., et al. Association analyses of 249,796 individuals reveal 18 new loci associated with body mass index. (2010) Nat Genet 42(11): 937- 948.
- 43. Scherag, A., Dina, C., Hinney, A., et al. Two new Loci for body-weight regulation identified in a joint analysis of genome-wide association studies for early-onset extreme obesity in French and german study groups. (2010) PLoS Genet 6(4): e1000916.
- 44. Strachan, D.P., Rudnicka, A.R., Power, C., et al. Life course influences on health among British adults: effects of region of residence in childhood and adulthood. (2007) Int J Epidemiol 36(3): 522- 531.
- 45. Dorajoo, R., Blakemore, A.I.F., Sim, X., et al. Replication of 13 obesity loci among Singaporean Chinese, Malay and Asian-Indian populations. (2012) Int J Obes (Lond) 36(1): 159- 163.
- 46. Lindgren, C.M., Heid, I.M., Randall, J.C., et al. Genome-wide association scan meta-analysis identifies three Loci influencing adiposity and fat distribution. (2009) PLoS Genet 5(6): e1000508.
- 47. Hardy, O.T., Perugini, R.A., Nicoloro, S.M., et al. Body mass index-independent inflammation in omental adipose tissue associated with insulin resistance in morbid obesity. (2011) Surg Obes Relat Dis 7(1): 60- 67.
- 48. Keller, P., Gburcik, V., Petrovic, N., et al. Gene-chip studies of adipogenesis-regulated microRNAs in mouse primary adipocytes and human obesity. (2011) BMC Endocr Disord 11: 7.
- 49. MacLaren, R.E., Cui, W., Lu, H., et al. Association of adipocyte genes with ASP expression: a microarray analysis of subcutaneous and omental adipose tissue in morbidly obese subjects. (2010) BMC Med Genomics 3: 3.
- 50. Park, J.J., Berggren, J.R., Hulver, M.W., et al. GRB14, GPD1, and GDF8 as potential network collaborators in weight loss-induced improvements in insulin action in human skeletal muscle. (2006) Physiol Genomics 27(2): 114-121.
- 51. Pihlajamäki, J., Boes, T., Kim, E.Y., et al. Thyroid hormone-related regulation of gene expression in human fatty liver. (2009) J Clin Endocrinol Metab 94(9): 3521- 3529.
- 52. Pihlajamäki, J., Lerin, C., Itkonen, P., et al. Expression of the splicing factor gene SFRS10 is reduced in human obesity and contributes to enhanced lipogenesis. (2011) Cell Metab 14(2): 208- 218.
- 53. Arner, E., Mejhert, N., Kulyté, A., et al. Adipose tissue microRNAs as regulators of CCL2 production in human obesity. (2012) Diabetes 61(8): 1986- 1993.
- 54. Klimcáková, E., Roussel, B., Márquez-Quiñones, A., et al. Worsening of obesity and metabolic status yields similar molecular adaptations in human subcutaneous and visceral adipose tissue: decreased metabolism and increased immune response. (2011) J Clin Endocrinol Metab 96(1): E73- ER82.
- 55. Hittel, D.S., Hathout, Y., Hoffman, E.P., et al. Proteome Analysis of Skeletal Muscle from Obese and Morbidly Obese Women. (2005) Diabetes 54(5): 1283- 1288.
- 56. Wang, X., Zhu, H., Snieder, H., et al. Obesity related methylation changes in DNA of peripheral blood leukocytes. (2010) BMC Med 8: 87
- 57. Maver, A., Peterlin, B. Positional integratomic approach in identification of genomic candidate regions for Parkinson’s disease. (2011) Bioinformatic 27(14): 1971– 1978.
- 58. Ashburner, M., Ball, C.A., Blake, J.A., et al. Gene Ontology: tool for the unification of biology. (2000) Nature Genet 25(1): 25- 29.
- 59. Ogata, H., Goto, S., Sato, K., et al. KEGG: Kyoto encyclopedia of genes and genomes. (1999) Nucleic Acids Research 27(1): 29- 34.
- 60. Devenish, R.J., Prescott, M., Boyle, G.M. The Oligomycin Axis of Mitochondrial ATP Synthase: OSCP and the Proton Channel. (2000) J Bioenerg Biomembr 32(5): 507– 515.
- 61. Mootha, V.K., Lindgren, C.M., Eriksson, K.F., et al. PGC-1alpha-responsive genes involved in oxidative phosphorylation are coordinately downregulated in human diabetes. (2003) Nat Genet 34(3): 267- 273.
- 62. Rönn, T., Poulsen, P., Tuomi, T., et al. Genetic Variation in ATP5O Is Associated with Skeletal Muscle ATP50 mRNA Expression and Glucose Uptake in Young Twins. (2009) PLoS ONE 4(3): e4793.
- 63. Ling, C., Poulsen, P., Simonsson, S., et al. Genetic and epigenetic factors are associated with expression of respiratory chain component NDUFB6 in human skeletal muscle. (2007) J Clin Invest 117(11): 3427– 3435.
- 64. Rönn, T., Poulsen, P., Hansson, O., et al. Age influences DNA methylation and gene expression of COX7A1 in human skeletal muscle. (2008) Diabetologia 51(7): 1159– 1168.
- 65. Trounce, I., Byrne, E., Marzuki, S. Decline in skeletal muscle mitochondrial respiratory chain function: possible factor in ageing. (1989) Lancet 1(8639): 637– 639.
- 66. Bertolino, P., Holmberg, R., Reissmann, E., et al. Activin B receptor ALK7 is a negative regulator of pancreatic beta-cell function. (2008) Proc Natl Acad Sci USA 105(20): 7246– 7251.
- 67. Watanabe, R., Shen, Z.P., Tsuda, K., et al. Insulin gene is a target in activin receptor-like kinase 7 signaling pathway in pancreatic beta-cells. (2008) Biochem Biophys Res Commun 377 (3): 867- 872.
- 68. Lafontan, M., Langin, D. Lipolysis and lipid mobiization in human adipose tissue. (2009) Prog Lipid Res 48(5): 275- 297.
- 69. Farmer, S.R. Transcriptional control of adipocyte formation. (2006) Cell Metab 4(4): 263- 273.
- 70. Melhorn, M.I., Brodsky, A.S., Estanislau, J., et al. CR1-mediated ATP release by human red blood cells promotes CR1 clustering and modulates the immune transfer process. (2013) J Biol Chem 288(43): 31139- 31153.
- 71. Wu, H., Boackle, S.A., Hanvivadhanakul, P., et al. Association of a common complement receptor 2 haplotype with increased risk of systemic lupus erythematosus. (2007) Proc Natl Acad Sci USA 104(10): 3961– 3966.
- 72. Cruickshank, M.N., Karimi, M., Mason, R.L., et al. Transcriptional effects of a lupus-associated polymorphism in the 5′ untranslated region (UTR) of human complement receptor 2 (CR2/CD21). (2012) Mol Immunol 52(3-4): 165– 173.
- 73. Blain, A., Cattan, S., Beaugerie, L., et al. Crohn's disease clinical course and severity in obese patients. (2002) Clin Nutr 21(1): 51– 57.
- 74. Shiotani, A., Kusunoki, H., Kimura, Y., et al. S100A expression and interleukin-10 polymorphisms are associated with ulcerative colitis and diarrhea predominant irritable bowel Syndrome. (2013) Dig Dis Sci 58(8): 2314- 2323.
- 75. Matsuda, T., Sakaguchi, M., Tanaka, S., et al. Prolyl oligopeptidase is a glyceraldehyde-3-phosphate dehydrogenase-binding protein that regulates genotoxic stress-induced cell death. (2013) Int J Biochem Cell Biol 45(4): 850- 857.
- 76. Allen, M., Cox, C., Belbin, O., et al. Association and heterogeneity at the GAPDH locus in Alzheimer's disease. (2012) Neurobiol Aging 33(1): 203.e25- 33.
- 77. Krasnov, G.S., Dmitriev, A.A., Snezhkina, A.V., et al. Deregulation of glycolysis in cancer: glyceraldehyde-3-phosphate dehydrogenase as a therapeutic target. (2013) Expert Opin Ther Targets 17(6): 681- 693.
- 78. Hwang, N.R., Yim, S.H., Kim,Y.M., et al. Oxidative modifications of glyceraldehyde-3-phosphate dehydrogenase play a key role in its multiple cellular functions. (2009) Biochem J 423(2): 253- 264.
- 79. Colussi, C., Albertini, M.C., Coppola, S., et al. H2O2-induced block of glycolysis as an active ADP-ribosylation reaction protecting cells from apoptosis. (2000) FASEB J 14(14): 2266- 2276.
- 80. Spragg, R.G., Hinshaw, D.B., Hyslop, P.A., et al. Alterations in adenosine triphosphate and energy charge in cultured endothelial and P388D1 cells after oxidant injury. (1985) J Clin Invest 76(4): 1471- 1476.
- 81. Sirover, M.A. New insights into an old protein: the functional diversity of mammalian glyceraldehyde-3-phosphate dehydrogenase. (1999) Biochim Biophys Acta 1432(2): 159- 184.
- 82. Kawai, T., Akira, S. The role of pattern-recognition receptors in innate immunity: update on Toll-like receptors. (2010) Nat Immunol 11(5): 373- 384.
- 83. Jin, C., Flavell, R.A. Innate sensors of pathogen and stress: Linking inflammation to obesity. (2013) J Allergy Clin Immunol 132(2): 287- 294.
- 84. Himes, R.W., Smith, C.W. Tlr2 is critical for diet-induced metabolic syndrome in a murine model. (2010) FASEB J 24(3): 731- 739.
- 85. Cahan, P., Rovegno, F., Mooney, D., et al. Meta-analysis of microarray results: challenges,opportunities, and recommendations for standardization. (2007) Gene 401(1-2): 12- 18.
- 86. Taneri, B., Ambrosino, E., van Os, J., et al. A new public health genomics model for common complex diseases, with an application to common behavioral disorders. (2012) Personalized Medicine 9(1): 29- 38.
- 87. Bochud, M., Malats, N. Public health genomics and the challenges for epidemiology. (2011) Eur J Public Health 21(1): 5- 6.
- 88. Kleinjan, D.A., van Heyningen,V. Long-range control of gene expression: emerging mechanisms and disruption in disease. (2005) Am J Hum Genet 76(1): 8– 32.


