
Investigation of Biological Property of Nanohydroxyapatite Materials
Affiliation
Institute of Physical Electron and Life Science and Technology, University of Electronic Science and Technology of China, Chengdu 610054, P.R. China
Corresponding Author
Pang Xiao-feng, Institute of Physical Electron and Life Science and Technology, University of Electronic Science and Technology of China, Chengdu 610054, P.R. China. E-mail: pangxf2006@yahoo.com.cn
Citation
Pang Xiao-feng. Investigation of Biological Property of Nanohydroxyapatite Materials. (2017) J Nanotechnol Material Sci 4(2): 75- 81.
Copy rights
© 2017 Pang Xiao-feng. This is an Open access article distributed under the terms of Creative Commons Attribution 4.0 International License.
Keywords
Nanohydroxyapatite; Cell proliferation; Biological function; Toxicity; Infrared spectrum; Electrophoresis; Human serum albumin; Molecular structure
Abstract
The biological effects of nanohydroxyapatites and its cell toxicity have been studied using the MTT and ALP method, infrared spectrum of absorption and electrophoresis method, respectively. The nanohydroxyapatites are prepared and made by using Sol-gel method, in which the parameters of process and reaction are controlled as: pH > 9, Ca / P = 1.67, sintering temperature of 1100°C and sintering time 2 hours. Studied results show that nanohydroxyapatites can interact with human serum albumin and change its second structure and weight of molecules. We find that the nanohydroxyapatites and complex of nano HAP+ nanoCrO2 can all restrain the proliferation of MG63 cells, but their toxicities are first degree or minor, the toxicity of the complex is smaller than that of pure nanohydroxyapatites.
Introduction
As it is known, the ceramic and metallic materials, such as Ni-Cr and Co-Cr alloy serve often as a fixed dental materials of restoration in human bones, teeth and vascular stents, but they have a lot of shortcomings, such as they can result in Ni and Cr hypersusceptibility of men and ion exchange between the material and tooth, which lead the distortion and discoloration of the gingival edge and affect also its appearance. Hydroxyapatite (HA) is a main inorganic components in human bones and teeth, and has excellent biocompatibility, biological activity and bone conduction feature[1-6]. As matter of fact, the bone is a kind of flexible and toughening polymer composed of hydroxyapatite-based composites. The composition and structure of artificial-hydroxyapatite are very similar to inorganic components in human bone tissues[4-15], it has a non-toxicity and non-irritant property, and is also non-allergenic, non-mutagenic and carcinogenic, and can generate a chemical reaction with bone to change bone conduction[16-19]. Therefore, nano-hydroxyapatites have widely applications in biological hard tissues, such as human bones, teeth and vascular stents, as repaired and replacement materials, such as in oral implantology for increasing dental spine, ear bone or spine replacement, etc., allowing better results compared to those using metals and polymers. However, the biological effects of nanohydroxyapatites and its toxicity have been not studied systematically as yet . Therefore, it is very necessary to investigate their biological effects and toxicity for its wide applications in biology. This paper will describe a study of the problems by a novel method using light spectrum technique. It is well known that the crystalline hydroxyapatite belongs to hexagonal system, has a L6PC symmetry and / m space group, its structure is hexagonal prism, with the surface of hexagon which is perpendicular to c-axis, angle between a and b-axes is 120°, its parameters of crystalline cell are a0 = b0 = 0.943 ~ 0.938 nm, c0 = 0.688 ~ 0.686 nm, the unit cell contains 10 Ca2+, 6 PO43- and 2OH-. OH- in the cell is in the four corners, 10 Ca2+ occupy two kinds of location, respectively, in which four Ca2+ occupy the Ca (I) positions at z = 0 and z = 1/ 2, respectively, the locations of 6 Ca2+ are in the Ca (II) positions at z = 1 / 4, and z = 3 / 4, respectively, the three ligand center is composed of three 03 and 6PO43- ligands, which are located at z = 1 / 4, and z = 3 / 4 on a plane. Therefore, HA has a good stability due to the tetrahedral structure of PO43-. Its structure is shown in Figure 1.
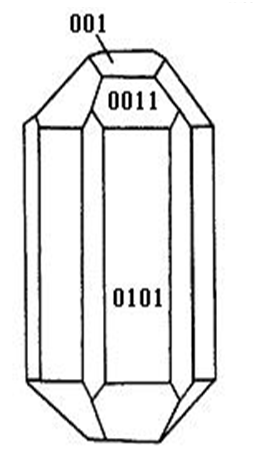
Figure 1: The space structure of hydroxyapatite.
There are many methods in the preparations of nano-HA material[7-15], which can be, in general, divided into wet and dry methods. The wet method includes the precipitation method, hydrothermal method, sol-gel method, ultrasonic synthesis, micro-emulsion method and ultrasonic synthesis method, and so on. The solid-state reaction method then belongs to the dry method. The sol-gel method is a new method for preparations of nano-HAs in recent years. We here use the sol–gel method to prepare nano-HA materials, of which the physical features and biological functions to cell and protein molecules are inspected by the electrophoresis method, infrared spectrum of absorption analysis and MTT and ALP method, respectively.
Materials and Methods
Materials
Materials used in this research, including the magnetic stirrer (Sanyo, JPN), enzymatic immunoassay instrument and spectrophotometer (GFL, Germany), 670-FT- IR spectrometer (Nicolet Nexus, USA), electrophoresis instrument (CBS, USA), constant temperature bath (Shanghai, CN), controlled device of sinter (Shanghai, CN), 708-type high-temperature silicon carbide oven (Shanghai, CN) and pH meter (Shanghai, CN) are as follows: calcium nitrate (Sigma, USA), urea (Sigma, USA), diammonium hydrogen phosphate (Sigma, USA), human serum albumin (Amresco, USA), fetal calf serum (Shanghai, CN) Osteoblast cells (MG63) (Shanghai, CN), MTT, 3-(4,5-dimethylthiazol 2-yl)-2,5 diphenyltetrazolium bromide (MTT) (Sigma, USA), dimethylsulfoxide (Sigma, USA), alkaline phosphatase (Amresco, USA), sodium dodecyl sulfate (Sigma, USA), polyacrylamide (Sigma, USA), Oxalic acids (Shanghai, CN) and crystalline CrO2 (Xian, CN).
Methods
The sol-gel method synthesizing the nano-HA materials
In the method the chemical reagents of diammonium hydrogen phosphate, calcium nitrate and urea are utilized, where 6.6 g (0.05 moL) diammonium hydrogen phosphate are added into pure water to prepare a 150 mL solution, in which 19.72 g (0.08352 moL) calcium nitrates are again added according to the molar ratio of Ca / P = 1.67. The complex solution is stirred and uniformed by a magnetic stirrer. After aging of 3 hours, the urea is added into the complex solution to remove NO3-, thus the sol state of the complex solution is formed through regulating its pH value to 9 in the condition of alkaline environment. After aging of two days, the sol becomes a white jelly-like gel which is again placed into the microwave oven to dry for about 10 – 20 min. After this the prepared gel materials are repeatedly washed to remove NH4NO3 in them. Residual materials are again sintered at 1100°C for about 2 hours. Thus the pure nano-HA materials are obtained in this method. In the research process the experiment device used is consist of a constant temperature bath, sinter, controlled device of sinter, semi-circular at the end of formwork table, precision pH meter, flat-bottomed beaker, 708- type high-temperature silicon carbide oven and reaction solution composition.
The preparation of the nano-CrO2 using the total-precipitated method
In this method the Oxalic acids, which are served as a precipitant, are added into the solution containing Cr ions and crystalline CrO2 which are served as a seed, then the CrO2 can be precipitated by adjusting the temperature and pH value of the solution., thus we can obtained the nano-CrO2 through extracting from the solution, washing by pure water and drying by heating way.
The MTT colorimetric method inspecting the cell toxicity of the nanomaterials
In the MTT colorimetric method[20], the coloration substance used is MTT(3-(4,5-dimethylthiazol 2-yl)-2,5 diphenyltetrazolium bromide) (made American), which can accept the hydrogen atoms. When the externally applied yellow tetrazolium salt MTT is taken up by the mitochondria in cell, it will be reduced to a blue insoluble crystalline matter through a reaction with an amber acid dehydrogenase, which will be deposited in the live cells, but not in the dead cells. These depositions can also be dissolved by injecting Dimethylsulfoxide (DMSO), where the amount of dissolution is proportional to the number of cell participating the reaction. Thus the number of cell participating the process can be obtained by measuring the strength of absorption of light with the wavelength of 490 nm using an enzymatic immunoassay instrument and spectrophotometer. Osteoblast cells (MG63) are here chosen to study the toxic effect of the nano-HAs on the proliferation of the cells in our experiment. The advantages of this method are that it is convenient, highly accurate, and has a high sensitivity of measurement and very good reproducibility. The experimental process in our study is described as follows.
(A) The culture of cells.
The MG63 cells are grown in a 5% CO2 enriched incubator at the temperature 25°C in RPMI1640 media (Hyclone, American) supplemented with 5% fetal calf serum (FCS, Biological Industries, BaiAn, China)[20]. The states of proliferation of MG63 cells are inspected by the microscope. The results show that there are no contaminating cells in the third passage of cell culture.
(B) The experimental process.
In all experiments, 4 × 10⁵ cells per well, which are determined by a microscope, were seeded into 60-well micro-plates and allowed to grow continually under the conditions described above. The 100 μL/well foster liquids containing the fetal calf serum and 1 mL/250 mL insulin liquid are added into each well, which are again separated into experimental and controlled groups. A total of 2 mg of nano-HAs is added into the experimental group in a volume of 1 mL to prepare as a solution with concentration of 2 mg/mL. Subsequently, the experimental and controlled groups are placed simultaneously into the CO2 enriched incubator at 37°C for 24 hours. When these biological samples are extracted from the enriched incubator we can inspect and compare the state and extent of proliferation of the cells between the experimental and controlled groups, thus we can determine the influences of nano-HAs on the states of proliferation of the MG63 cells.
(C) Determination of the extent of proliferation of the MG63 cells.
The extent of the proliferation of the MG63 cells is inspected using the MTT colorimetric method, in which the changes in the mitochondrial dehydrogenase activity with increasing number of cells are first inspected. A volume of 100 μL/well of MTT solution is prepared in PBS (5 mg/mL) and further diluted (10%) in RPMI 1640. The cell growth medium is aspirated and 100 μL of the MTT solution is added into each well. The MG63 cells are further incubated for 4 h at 37°C. The excess MTT solution is removed and 100 μL/well DMSO was added to dissolve the blue crystalline matter that had been formed in the cells.
(D) Determination of influence of nano-HAs on proliferation of cell.
The Optic Densities (OD) of the DMSO solutions in each well in the controlled and experimental groups is measured spectro-photometrically at 490 nm by a DG3022 enzymatic-immunoassay instrument. Thus the influence of nano-HAs on proliferation of the MG63 cells can be obtained from difference of OD values between the experimental and controlled groups in the MTT method.
Detection influence of nano-materials on proliferaction of cell using cell alkaline phosphatase (ALP) method
In this experiment we first added 2 mg of nano-HAs into the fetal calf serum of concentration of 10% to prepare the cell culture solution with concentration of 10 mg/mL. They and osteoblast cells (MG63) are together joined in 96 wells in the culture plate, which are saved again in thermostatic box at 37°C to proliferate. After 1 day, 3 days and 5 days we join 100 μL, 0.2% Triton-X100 and standard ALP solution of 100 μL into each well in the culture plat to train further at 4°C. After 30 minutes we use 1 mol/L NaOH to cease the proliferation reaction and to inspect further their Optic Density (OD) using the DG3022 enzymatic-immunoassay instrument.
The sodium dodecyl sulfate -polyacrylamide gel electrophoresis method determining changes of molecular weight of HAS under influence of nano-HAs
In the sodium dodecyl sulfate (SDS)-polyacrylamide gel electrophoresis (PAGE) method, the SDS used here is a kind of anionic detergent, the polypropylene is made by a co-polymerization of acrylamide, which is a white crystal with N, N′- methylene bis acrylamide, the latter is generated by the excitations of tetramethylethylenediamine (TEMED) and Ammonium Persulfate (AP). In the co-polymerizating process the activated and un-activated monomers are all extended along the polyphosphate chains, which can further be connected randomly to form a double acrylamide. Thus, the three-dimensional mesh-structures are obtained through the cross-coupling of these polyphosphate chains. These mesh-structures further combine together to become into a gelatinous chain-polymerization, which can eventually form enrichment glue (gel). In this experiment the component of HSA and its change of molecular weight are measured by a discrete system containing the upper layer, which is composed of enrichment glue, and down layer, which is composed of separated glue. The enrichment glue layer (its pH value is 6.7, but its diameter of hole is larger) is used to concentrate the glues into some narrow-strips for improving their effect of separation before the glues come not in the separated layer. The separated layer (its pH value is 8.9, but its diameter of hole is small) is used to separate the components from the glue in the light of sequence of size of molecular weight and charges by the sieve and sample charged effect. In our experiment, the measured system is consisted of 15% separated glue and 4% enrichment glue, where the certain quantities of SDS with a big negative charge must be added into the measured system to form the complex of SDS and proteins with a large number of charges balance out the original charges of different proteins, which can make these proteins have all same charges. When the SDSPAGE system is used to separate HAS and its complexes we can obtain a clear spectrum band in accordance with distribution of molecular weight, instead of distribution of molecular charge. Thus we can determine the existences of HAS and complexes of HAS and nano-HAs as well as their features.
The inspections of feature of HAS and its complex with nano-HAs using the infrared spectrum of absorption
The nano-HA materials prepared are added into a human serum albumin (HSA) solution to form a supernatant solution. Next we measure the properties of the supernatant solutions, in which the composition and structure of HSA and their changes under influence of nano-HAs are analyzed and inspected by the infrared spectrum of absorption and electrophoresis method.
Results and Discussion
The sizes of nano-HAs were measured using a JSM-6490LV- Scanning Electron Microscope (SEM). The result is shown in Figure 2. This figure manifests that the sizes of nano-HAs are in the range of 80 - 100 nm, with most of them in the range of 80 - 90 nm, and with non-uniform granularity of the corpuscle.
The influence of nanohydroxyapatite on proliferation of cell and its toxicity
The MTT method is used to inspect the toxicity of MG63 cells of nano-HAs, in which the Optic Densities (OD) of the DMSO solutions are measured by DG3022 enzymatic- immunoassay instrument. The OD values of the biological samples in the experimental and controlled groups are shown in Table 1. Thus, the Cell Proliferation Rate (CPR) of the MG63 cells after treatment with the nano-HAs can be determined according to the formula:
CPR = [(Dexp – Dcon) / Dcon] X 100%
Where, Dexp is the value of optical density of the experimental group, and Dcon is the value of optical density of the control group. The values of relative cell proliferation rate (RCPR or P (%) value) of the MG63 cells are obtained using the formula:
RCPR = (Dexp/Dcon) X 100%
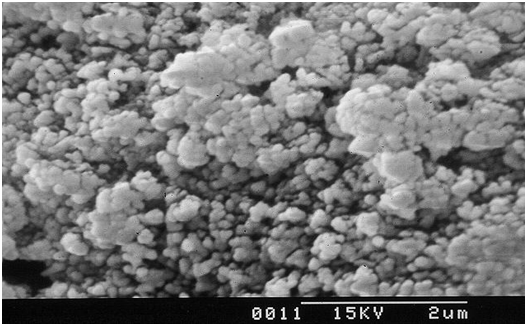
Figure 2: The image of pure nano-HA powders.
The results are also shown in Table 1. We see clearly from Table 1 that there are differences in the parameters between the experimental and controlled groups. This manifests that both the nano-HAs and complex of nano-HAs + nanoCrO2 (HA+CrOS2, where the ratio between HA and CrO2 is 1:1) can always restrain the proliferation of cells, but their toxicities are all first degree or minor. Meanwhile, we find that the relative cell proliferation rate of MG63 cells decreases with increasing time of growth under the influence of the nano-HAs and complex of nan-HA+ CrO2), but the influence of the complex of nano-HA+CrO2) on the proliferation of growth of cells are minor compared to that with nano-HAs. This is a new and interesting result.
In the meanwhile, we further inspect the influences of nano-HAs on the states of proliferation of the MG63 cells using method of cell alkaline phosphatase. We obtain the proliferation rates (CPR) of MG63 cells by the above formulae and determine further the toxicity of the nano-HAs to the MG63 cells. These results with those of controlled group are together shown in Table 2 and Figure 3, respectively, where we gave also the corresponding results of nano-fluorine-hydroxyapatites (FHA). From Table 2 and Figure 3 we see clearly that the influence of the complex of nano-HAs on the proliferation of cells are minor, which is same with the above result obtained by MTT method, but the nano-FHA can affect obviously the proliferation of cell and has higher toxicity relative to that of the nano-HAs.
Table 1: The optical density and relative generation rate (P) of MG63 cells under influences of HAs and complex of nano-HA+nanoCrO2 with the same concentration of 5 mg/mL at different proliferation days, respectively.
| HA P (%) | HA(OD) | HA+CrO2 P (%) | HA+CrO2(OD) | cControl P(%) | Control(OD) | |
|---|---|---|---|---|---|---|
| 1d | 98.6 | 0.246 ± 0.0596 | 99.4 | 0.260 ± 0.0505 | 100 | 0.275 ± 0.0513 |
| 3d | 94.9 | 0.290 ± 0.0519** | 97.5 | 0.435 ± 0.0415 | 100 | 0.500 ± 0.540 |
| 5d | 93.7 | 0.299 ± 0.0236** | 95.9 | 0.539 ± 0.2732 | 100 | 0.619 ± 0.258 |
| 7d | 92.6 | 0.312 ± 0.0230** | 93.6 | 0.661 ± 0.0715** | 100 | 1.002 ± 0.460 |
Notice: ** P < 0.01, vs. Control.
Table 2: The optical density and relative generation rate of MG63 cells under influences of nano-HAs and nano-FHA with the same concentration of 5 mg/mL at different days in ALP method.
| HA P (%) | HA(OD) | FHA P (%) | FHA(OD) | Control P (%) | Control(OD) | |
|---|---|---|---|---|---|---|
| 1d | 118.4 | 0.303 ± 0.0596 | 108 | 0.270 ± 0.0505 | 100 | 0.256 ± 0.0593 |
| 3d | 104 | 0.475 ± 0.0515 | 91 | 0.420 ± 0.0529 | 100 | 0.458 ± 0.1541 |
| 5d | 95.7 | 0.599 ± 0.1732 | 78 | 0.493 ± 0.0536* | 100 | 0.626 ± 0.1238 |
Notice: *P < 0.05, vs. Control.
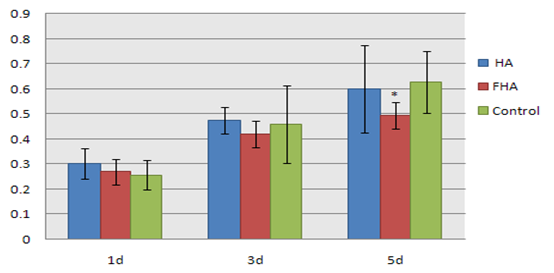
Figure 3: The comparison of sizes of proliferation of MG63 cells under influences of nano-HAs and nano-FHA with the same concentration of 5 mg/mL at different days in ALP method, where *P < 0.05, vs. Control.
The changes of structure and properties of human serum albumin arising from the nano-hydroxyapatites
(1) The features of infrared absorption of complex of nano-HA and human serum albumin (HAS).
Figures 4~8 show the infrared spectra of absorption of pure nano-HAs, HSA and their complex solutions, which have the Mole ratios of concentration of 1/3, 1/13 and 1/130, respectively, obtaining by the Nicolet Nexus 670-FT- IR spectrometer in the range of 400 - 4000 cm-1. The infrared spectrum of absorption of pure nano-HAs is shown in Figure 4, which indicates that the peak at 3571.33 cm-1 corresponds to the vibration of OH group in water molecules, the peaks at 1043 cm-1 and 963.62 cm-1 are the characteristic peaks of and, the peak at 626.24 cm-1 is characteristic peak of, the peak at 1090.63 cm-1 is the infrared absorption spectrum of HOH group, the peaks at 602.43 cm-1 and 574.04 cm-1 correspond to the vibrations of . Figure 5 shows the infrared spectrum of absorption of HSA, in which there are many peaks, where the peak at 3435.76 cm-1 corresponds to the vibration of OH-group in water molecules, the peaks at 2915.23 cm-1 and 2843 cm-1 are the stretching vibrations of NH and CH groups, respectively, the peak at 2362.91 cm-1 corresponds to the defect vibration of NH-group, the peaks at 1651.66 cm-1, 1536.42 cm-1, 1385.43 cm-1 and 606.62 cm-1 corresponds to the eigen vibrations of amide –I. -II, -III and -VI (stretching vibration of C=O in -helix structure), respectively, the peak at 1242.38 cm-1 is the amide-III mode in -fold structure. Figures 4 - 6 are the infrared spectra of the complexes of nano-HAs and HSA with different concentrations. Through comparing Figures 6 - 8 with Figures 4 - 5 we found that many peaks, such as the peaks at 2915.23 cm-1, 2843 cm-1 , 2362.91 cm-1, 1536.42 cm-1, 1385.43 cm-1, 606.62 cm-1, 1242.38 cm-1, 602.43 cm-1, 626.24 cm-1, 1043 cm-1, 963.62 cm-1 and 1090.63 cm-1 in the nano-HAs and HBA are all disappeared, but a new peak at 2096.69 cm-1 or 2080.79 cm-1 occurs in their complexes, meanwhile, the peaks at 3435.76 cm-1, 1651.66 cm-1 and 574.04 cm-1 in the nano-HA and HSA are also displaced to 3451.66 cm-1 or 3463.58 cm-1, 1631.79 cm-1, or 1635.7 cm-1, or 1639.74 cm-1 and 566.89 cm-1 or 682.78 cm-1 or 578.81 cm-1 in these complexes, respectively. These results indicate clearly that the nano-HAs are combined into HSA, thus molecular structures of both nano-HA and HSA are changed. Obviously, their combination is due to the interactions of in the nano-HAs with charged amino acid residues or COOH groups in HSA. However, we also cannot repulse that there is the interactions of in the nano-HAs with charged amino acid residues or NH2 groups in HSA in this combined process.
Meanwhile, we see from Figures 6 - 8 that the features of infrared spectra, including the positions and strengths of peaks, in the complex solutions with the Mole ratios of concentration of 1/3, 1/13 and 1/130 between the nano-HA and HSA are different each other, and changed with varying the ratio of concentration. This means that the nano-HAs can change the molecular structure of HSA.
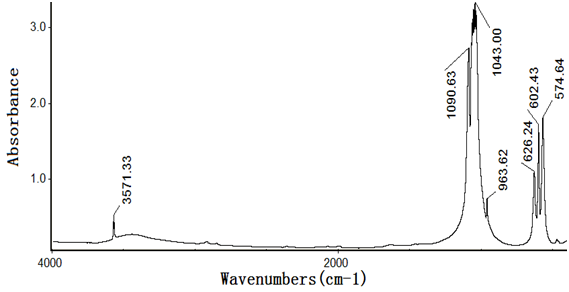
Figure 4: The infrared spectrum of absorption of the nano- hydroxyapatite.
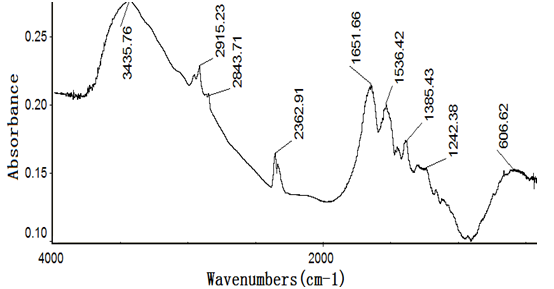
Figure 5: The infrared spectrum of HSA.
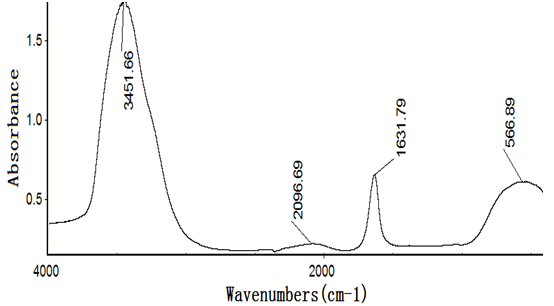
Figure 6: The infrared spectrum of complex solution with Mole ratios of concentration of 1/3 for the nano-HA vs. HSA.
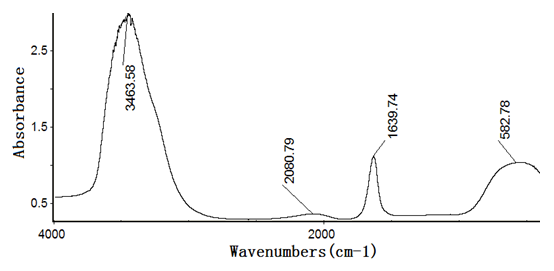
Figure 7: The infrared spectrum of complex solution with Mole ratios of concentration of 1/13 for the nano-HA relative to HSA.
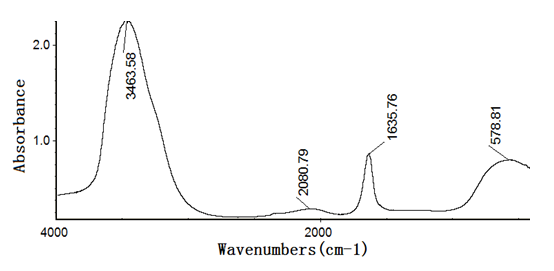
Figure 8: The infrared spectrum of complex solution with Mole ratios of concentration of 1/130 for the nano-HA relative to HSA.
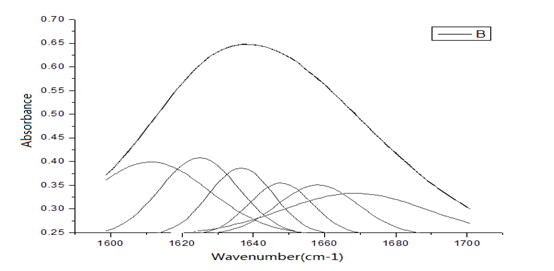
Figure 9: The second-order derivative spectrum of infrared absorption for HSA in the region of 1600 - 1700 cm-1 and their Gaussian fitting spectrum.
(2) Change of second structure of protein molecules arising from the nano-HAs.
We study further the changed characteristics of molecular structure of HSA arising from the nano-HAs. Figures 9 - 10 show the second-order derivative spectrum of infrared absorption for HSA and the complex of HSA and HA as well as their Gaussian fitting spectrum in the region of 1600 - 1700 cm-1, respectively, which represent the infrared spectra of amide-I, or the stretching vibrations of C=O group and its coupling with bending vibration of NH group and stretching vibration of CH group in second structure of -helix, -fold and corner and random bending in the protein molecules. Therefore, the properties and changes of amide-I mode, or speaking, the infrared spectra in the region of 1600 - 1700 cm-1 can indicate the features of the second structure of HSA molecules. Through the comparison between Figure 9 and Figure 10 we find that second-order derivative spectrum of infrared absorption for the complex of HSA and HA is different from that of pure HSA, where the vibrational frequency of -helix is red-shifted, but the vibrational frequency of -fold is blue-shifted, at the same time, the weight of component in the region of higher frequency is increased after the nano-HAs are combined into HSA. Through analyzing the features of these infrared spectra and fitting Gaussian curves and utilizing further Jackson et al., methods[21-25] we can obtain that the nano-HAs change the second structure of HSA molecules through the variations of structure of -helix, -fold and corner and random bending, which can make the components of -helix structure increased, but of -fold decreased in HSA.
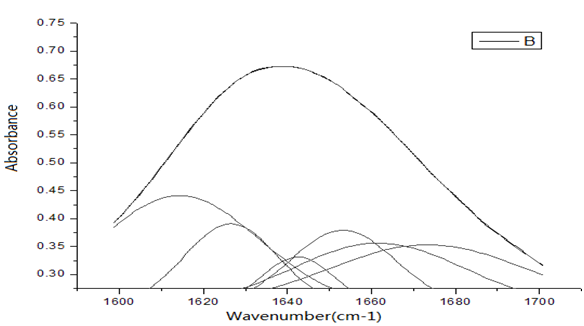
Figure 10: The second-order derivative spectrum of infrared absorption for complex of HAS and HA in the region of 1600 - 1700 cm-1 and their Gaussian fitting spectrum.
(3) Measurement of changes of molecular weight of HSA under influence of nano-HAs by the electrophoresis method.
We use the SDS-PAGE method to separate the components of HSA and to measure further its changes of molecular weight after the addition of nano-HAs. The electrophoresis stripes we obtained from this experiment are shown in Figures 11. The figures exhibit clearly a spectrum band, which is composed of HAs and HSA+nano-HAs. This indicates that HSA can combine with nano-HAs. This demonstrates again that the above conclusion is correct. At the same time, we find also that the changes of molecular weight of HAS are increased with increasing the quality of nano-HAs, although the molecular weight of HSA is large than that of HA. In the meanwhile, we exhibit also the corresponding results of the electrophoresis stripes and changes of molecular weight of HSA under influences of different nano-fluorine-hydroxyapatites (FHA) in Figures 11. The results obtained from the nano-FHA are same with those of the nano-HA.
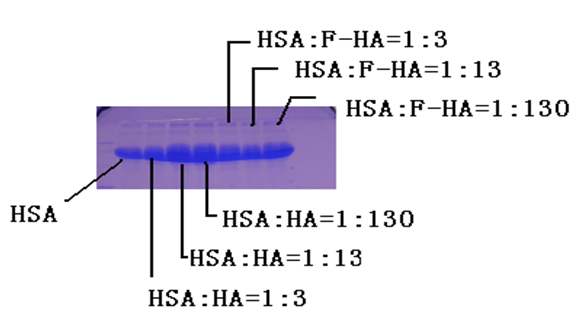
Figure 11: The analytic result of components of HAS under influence of different HAs through its electrophoresis stripes.
Conclusion
In this paper we investigated the biological effects of nanohydroxyapatites and its cell toxicity using the MTT and ALP method, infrared spectrum of absorption and electrophoresis method, respectively. The nanohydroxyapatites we here used in this experiment are prepared and made by Sol-gel method, in which the parameters of process and reaction are controlled as PH > 9, Ca / P = 1.67, sintering temperature of 1100°C and sintering time 2 hours. From this investigation we can conclude the following results.
1) The nanohydroxyapatites and complex of nano-HAs + nano- CrO2 can all restrain the proliferation of cells, but their toxicities are still first degree or minor. Meanwhile, we find that the restrained effect of the complex is smaller than that of pure nanohydroxyapatites, although they can decrease the relative proliferation rate of cells. This shows clearly that the incorporation of the nanohydroxyapatites with nano-CrO2 changes the biological activity of the former. This is a new and interesting result.
(2) The nanohydroxyapatites can interact with human serum albumin and change its second structure and weight of molecules.
Acknowledge:
We acknowledge the financial supports of the National Key Program for Developing Basic Research of China(“973”Program) ( Grant No. 2007CB936103).
References
- 1. Liu, R.R., Mao, X., Yu, Q.C., et al. Preparation of Bioactive Nanohydroxya-Patite Coating for Artificial Cornea. (2007) Current applied Physics 7(1): 85-89.
Pubmed || Crossref || Others - 2. Wu, Z.J., He, L.P., Chen, Z.Z. Fabrication and characterization of hydroxyapatite/Al2O3 biocomposite coating on titanium. (2006) Trans Nonferrous Met Soc China 16(2): 259-266.
Pubmed || Crossref || Others - 3. Chai, C.S., Besim, B.N. Bioactive nanocrystalline sol-gel hydroxyapatite coatings. (1999) J Mater Sci Mater Med 10(8): 465-469.
Pubmed || Crossref || Others - 4. Yu, F.L., Zhou, Y.Q., Zhang, W.K., et al. Prep-aration and Development Prospects of Research of Hydroxyapatite Biomaterials. (2006) ceramics 23(2): 6-11.
Pubmed || Crossref || Others - 5. Bennick, A., Cannon, M., Madapallimattam, G. The nature of the hydroxyapatite-binding site in salivary acidic proline-rich proteins. (1979) Biochem J 183(1): 115-126.
Pubmed || Crossref || Others - 6. Ye, Q., Hu, R., Lin, Z.Y. et al. (2006) Chemical Journal 26: 946.
Pubmed || Crossref || Others - 7. Zeng, S., Fu, S.Z., Guo, G., et al. Preparation and Characterization of Nano-Hydroxyapatite/Poly (vinyl alcohol) Composite Membranes for Guided Bone Regeneration. (2011) J Biomed Nanotechnol 7(4): 549-557(9).
Pubmed || Crossref || Others - 8. Cabrera, J.L., Castillo, R.V., Mu-oz, E.M.R. Synthesis of hydroxyapatite nanostructures using microwave heating. (2011) J Nanosci Nanotechnol 11(6): 5555-5561.
Pubmed || Crossref || Others - 9. Shuai, C., Gao, C.D., Nie, Y., et al. Structural design and experimental analysis of a selective laser sintering system with nano-hydroxyapatite powder. (2010) J Biomed Nanotechnol 6(4): 370-374.
Pubmed || Crossref || Others - 10. Sahithi, K., Swetha, M., Prabaharan, M., et al. Synthesis and characterization of nanoscale-hydroxyapatite-copper for antimicrobial activity towards bone tissue engineering applications. (2010) J Biomed Nanotechnol 6(4): 333-339.
Pubmed || Crossref || Others - 11. Sadjadi, M.A.S., Meskinfam, M., Sadeghi, B., et al. In situ biomimetic synthesis and characterization of nano hydroxyapatite in gelatin matrix. (2011) J Biomed Nanotechnol 7(3): 450-454.
Pubmed || Crossref || Others - 12. Manocha, L.M., Disher, I.A., Manocha, S. Sorption of Cadmium Ions on (AB-type) Carbonated Hydroxyapatite Nanoparticles. (2011) Adv Sci Lett 4(1): 44-50(7).
Pubmed || Crossref || Others - 13. Ivashchenko, O.A., Uvarova, I.V., Bahley, N.M., et al. Kinetics of Rifampicin Release In Vitro from Iron(III) Oxide and Hydroxyapatite Nanopowders (2010) Adv Sci Lett 3(2): 168-173(6).
Pubmed || Crossref || Others - 14. Ma, G.B., Liu, X.Y., Wang, M. Growth and mechanisms of enamel-like hierarchical nanostructures on single crystalline hydroxyapatite micro-ribbons. (2011) J Nanosci Nanotechnol 11(6): 5199-5206.
Pubmed || Crossref || Others - 15. Forati, T., Behnamghader, A., Rashidi, A., et al. Effect of functionalized carbon nanotubes on the synthesis of hydroxyapatite nanoparticles. (2011) J Nanosci Nanotechnol 11(6): 5423-5428.
Pubmed || Crossref || Others - 16. Nirmala, R., Park, H.M., Kalpana, D., et al. Bactericidal activity and in vitro cytotoxicity assessment of hydroxyapatite containing gold nanoparticles. (2011) J Biomed Nanotechnol 7(3): 342-350.
Pubmed || Crossref || Others - 17. Meskinfam, M., Sadjadi, M.A.S., Jazdarreh, H., et al. Biocompatibility Evaluation of Nano Hydroxyapatite-Starch Biocomposites. (2011) J Biomed Nanotechnol 7(3): 455-459.
Pubmed || Crossref || Others - 18. Kalmodia, S., Sharma, V., Pandey, A.K., et al. Cytotoxicity and genotoxicity property of hydroxyapatite-mullite eluates. (2011) J Biomed Nanotechnol 7(1): 74-75.
Pubmed || Crossref || Others - 19. Sylvie, J., Sylvie, T.D., Pascal, P.M., et al. Effect of hydroxyapatite and beta-tricalcium phosphate nanoparticles on promonocytic U937 cells. (2010) J Biomed Nanotechnol 6(2): 158-165.
Pubmed || Crossref || Others - 20. Situ, Z.Q., Wu, J.Z. Cluture of Cell. (1996) World book publishing Co. Beijing. 186-187.
Pubmed || Crossref || Others - 21. Jackson, M., Haris, P.I., Chapman, D. Fourier transform infrared spectroscopic studies of lipids, polypeptides and proteins. (1989) J Mol Struct 214: 329-355.
Pubmed || Crossref || Others - 22. Hollosi, M., Majer, Z.S., Rónai, A.Z., et al. CD and Fourier transform is spectroscopic studies of peptides. II. Detection of beta-turns in linear peptides. (1994) Biopolymers 34(2): 177-185.
Pubmed || Crossref || Others - 23. Jackson, M., Haris, P.I., Chapman, D. Fourier transform infrared spectroscopic studies of calcium-binding proteins. (1991) Biochem 30(40): 9681-9686.
Pubmed || Crossref || Others - 24. Surewicz, W.K., Mantsch, H.H. New insight into protein secondary structure from resolution-enhanced infrared spectra. (1988) Biochem Biophys Acta 952(2): 115-130.
Pubmed || Crossref || Others - 25. Shen, Y.H., Yang, Z.L., Wu, J.G. (1999) Acta Phys Chem Sinica 15:1064.
Pubmed || Crossref || Others


