
Low Dose Oral Iron as a Safe and Effective Iron Administration for Anemia Treatment in Hemodialysis Patients
Shoichiro Daimon
Affiliation
Department of Nephrology, Daimon Clinic for Internal Medicine, Nephrology and Dialysis, Nonoichi, Japan
Corresponding Author
Shoichiro Daimon, Department of Nephrology, Daimon Clinic for Internal Medicine, Nephrology and Dialysis, Oshino 1-400, Nonoichi, Japan 921-8802, Tel: +81 762 294 0077; Fax: +81 762 294 2330; E-mail: dai-clinic@m2.spacelan.ne.jp
Citation
Shoichiro Daimon. Low Dose Oral Iron as a Safe and Effective Iron Administration for Anemia Treatment in Hemodialysis Patients. (2018) Int J Hematol Ther 4(1): 25- 30.
Copy rights
© 2018 Shoichiro Daimon. This is an Open access article distributed under the terms of Creative Commons Attribution 4.0 International License.
Keywords
Hemodialysis; Anemia; Iron; Ferritin; Ferric citrate; Sodium ferrous citrate
Abstract
Background: Oral Ferric Citrate (FC) is an effective iron therapy in hemodialysis patients. We investigated the effect of oral iron on anemia in hemodialysis patients focusing on different effects between sodium ferrous citrate (SF) and FC and dose effect of SF.
Methods: Study 1; FC was administered (1500 mg/day) either as a de novo iron administration (Group D) or after a switch from SF (50 mg/day) (Group S). Dose of erythropoietin stimulating agent (ESA), serum hemoglobin levels, ESA/hemoglobin ratio and iron states were investigated for 64 weeks retrospectively. Study 2; 23 stable hemodialysis patients with long-term 50 mg/day of SF were randomly divided to two groups; dose was increased to 150 mg/day (Group 150) and unchanged in the rest (Group 50). Without changing the dose of ESA, hemoglobin levels and iron states were compared for 40 weeks prospectively.
Results: Study 1; data were obtained from 28 patients. FC administration increased ferritin levels in both groups (median; Group D; 0W: 49.3, 56W: 214.0, Group S; 0W: 120.0, 56W: 217.0 ng/mL), but hemoglobin levels increased and ESA dose and ESA/hemoglobin ratio decreased only in Group D (0W vs. 12W: p < 0.05). Study 2; 17 patients completed the study. Although higher dose of SF resulted in increased ferritin and hepcidin-25 levels in Group 150 (p < 0.05 and < 0.01, respectively), hemoglobin levels did not change in either group.
Conclusions: Instable hemodialysis patients, 50 mg/day of SF have a comparable effect on anemia to that of 1500 mg/day of FC or 150 mg/day of SF with less increase in serum ferritin levels.
Introduction
Anemia is common in hemodialysis patients, with a relative deficiency of erythropoietin (EPO) being the predominant cause[1]. Anemia management in hemodialysis patients was revolutionized by the introduction of erythropoietin stimulating agents (ESAs) in the late 1980s, and has become the mainstay of anemia treatment[2]. With the introduction of ESAs, iron deficiency has become an important component of anemia in hemodialysis patients[3]. Although oral iron supplementation is supposed to be more physiologic than that by the intravenous (IV) route, several studies have found IV iron superior to oral iron in hemodialysis patients[4,5], and IV administration is widely recommended[6-8].
Recently, the phosphate binder, ferric citrate (FC), has been reported to be a promising oral iron supplier in patients with chronic kidney disease[9-12]. Especially, Umanath et al demonstrated a reduction in IV iron and ESA use with the administration of FC in hemodialysis patients with mean serum ferritin levels of 594 ng/ml[9]. Considering that little oral iron absorption has been reported to occur when serum ferritin levels exceed 300 ng/ml[13], this is surprising. After the appearance of FC not only IV iron, but also oral iron has also been accepted for iron administration in hemodialysis patients in Japan, and as a dose of oral iron 100 to 200 mg/day is recommended (not graded)[14]. But the dose effect of oral iron, effect of differences in the chemical composition (e.g. FC or not) and appropriate dose of oral iron have not been established.
This prompted us to compare the effect on iron store status and anemia in hemodialysis patients regarding different effects between FC and sodium ferrous citrate (SF) which is popular oral iron in Japan, and dose effect of SF (50 mg and 150 mg/day).
Materials and Methods
In our clinic, iron has been administered orally (50 mg/day of SF) as a rule since 2012. Patients who had received blood transfusions or IV iron within six months were excluded from the current study. Although FC is a phosphate binder, not an oral iron supplier, we never used FC, SF or other oral and IV iron concomitantly.
In Study 1, for the treatment of hyper phosphatemia, 1500 mg/day of FC was administered to hemodialysis patients either as a de novo iron administration (Group D) or a switch from 50 mg/day of SF (Group S). Data from the patients with stable hemoglobin (Hb) levels with the same dose of ESAs for more than 12 weeks at FC administration were collected. Dose of ESAs, serum Hb levels, ESA/Hb ratio and serum ferritin levels during FC administration were investigated for 64 weeks retrospectively.
In Study 2, to investigate the dose effect of SF on anemia and iron store status, 23 stable hemodialysis patients with 50 mg/day of SF were divided into two groups at random, 50 mg/day of SF was continued in ten patients (Group 50) and the dose was increased to 150 mg/day in the rest (Group 150). Without changing the ESA dose, serum ferritin, hepcidin-25, transferrin saturation (TSAT) and Hb levels were compared for 40 weeks prospectively.
As ESAs, we used continuous erythropoietin receptor activator (C.E.R.A.) (administered every two weeks) or darbepoetin alfa (every week). Serum levels of hepcidin-25 were measured using a liquid chromatography-tandem mass spectrometric method[15].
Statistical analysis
Data were expressed as mean ± standard deviation. Differences in quantitative variables were compared by Student’s t-test for parametric and Wilcoxon rank sum test for nonparametric data. Intergroup statistical significance is defined as p less than 0.05.
Results
In Study 1, data were obtained from 28 patients (Group D: 17 patients, Group S: 11 patients) (Table 1). In Group S, 50 mg/day of SF had been administered for more than 88 weeks at the switch to FC. As shown in Table 2, as a whole, after the administration of FC, Hb increased, while ESA dose and ESA/Hb ratio decreased and were maintained thereafter. These changes were seen in Group D, but not in Group S (Table 2, Figure. 1). At the start of FC administration, serum ferritin levels were higher in Group S than Group D (median; Group S: 120.0, Group D: 49.3 ng/mL, p < 0.01) which was supposed to have received SF before the switch to FC, but serum ferritin levels in both groups increased and did not differ significantly thereafter (Figure 2). To clarify whether patients in Group S are non-responders to oral iron therapy, we investigated the changes in these parameters after the initiation of SF therapy. In eight of eleven patients (in three patients SF was already being administered at transfer to our clinic) we could obtain the relevant data. As shown in Figure. 3, 50 mg/day of SF resulted in increased serum Hb levels and decreased ESA dose and ESA/Hb ratio. Serum ferritin levels were lower during SF treatment (median; 0W: 42.7, 28W: 151.1, 76W: 133.1 ng/mL) than those during the switch to FC (median; 0W: 120.0, 28W: 158.0, 76W: 236.0, 100W: 342.5 ng/mL). Although the former treatment by SF was effective for anemia, after the switch to FC, despite the higher serum ferritin levels than those during SF treatment, serum Hb levels, ESA dose and ESA/Hb ratio did not change.
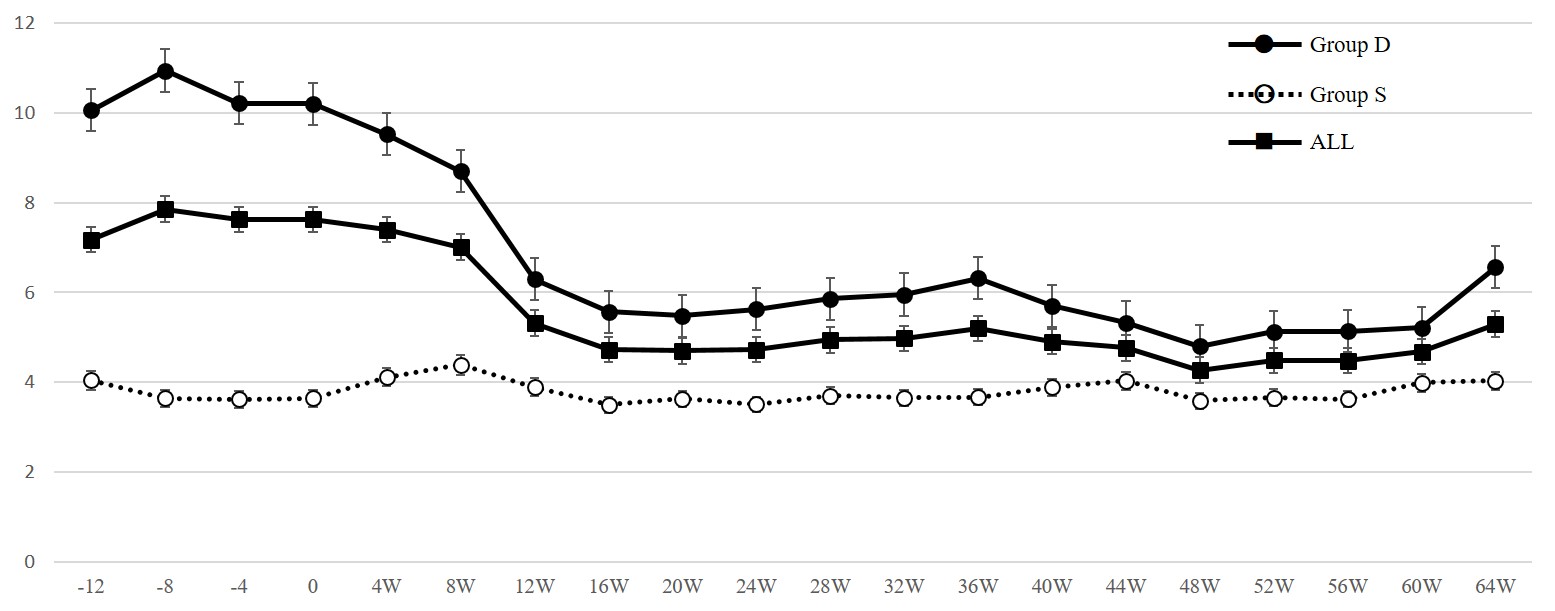
Figure 1: ESA/hemoglobin ratio during ferric citrate administration (Study 1).
Solid lines and black circles indicate data of patients receiving de novo administration of ferric citrate hydrate. Dotted lines and open circles indicate data of patients switched from sodium ferrous citrate and solid lines and black squares indicate data of all patients.
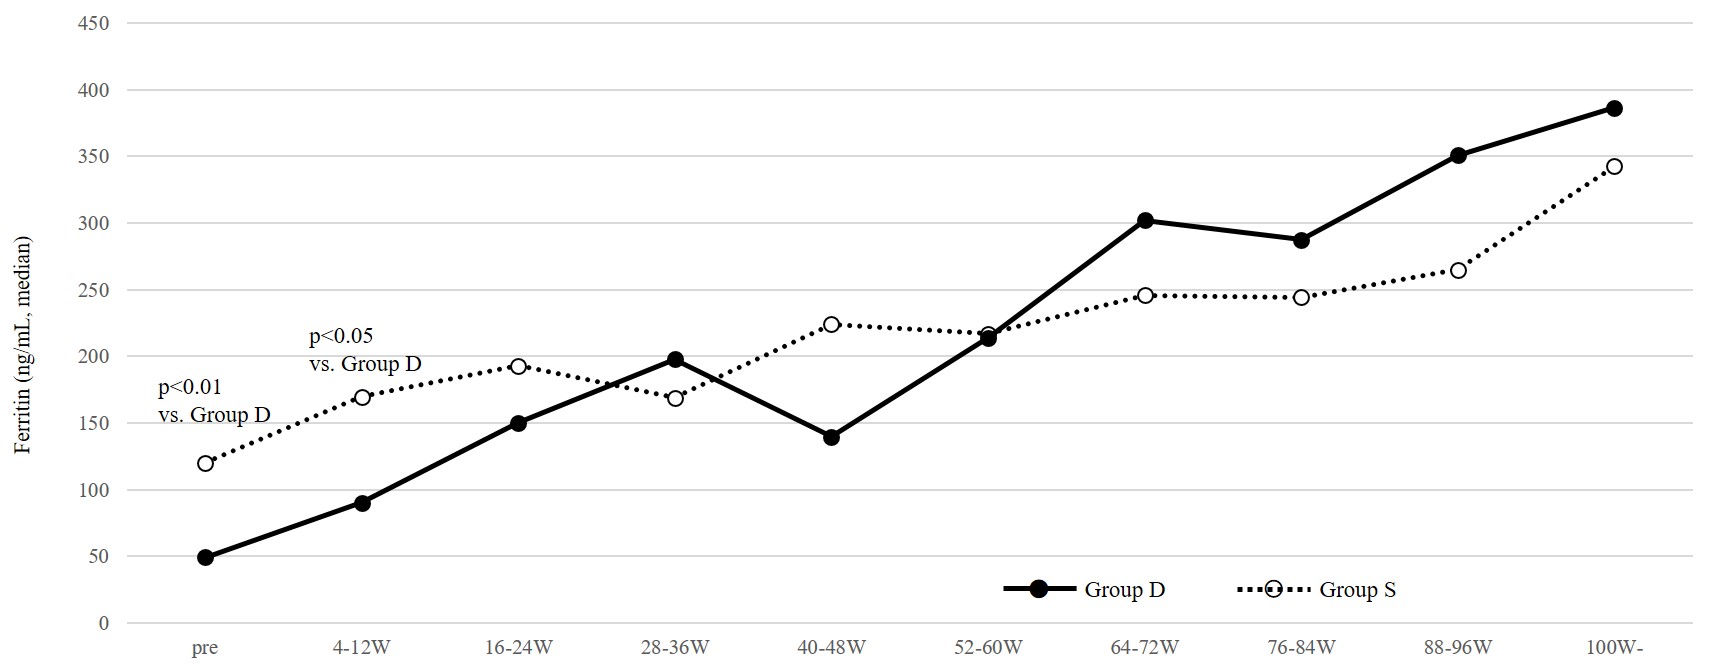
Figure 2: Serum ferritin levels during de novo ferric citrate administration and switch from sodium ferrous citrate (Study 1).
Solid lines and black circles indicate data of patients receiving de novo administration of ferric citrate hydrate and dotted lines and open circles indicate data of patients switched from sodium ferrous citrate.
Table 1: Characteristics of patients receiving ferric citrate hydrate therapy (Study 1)
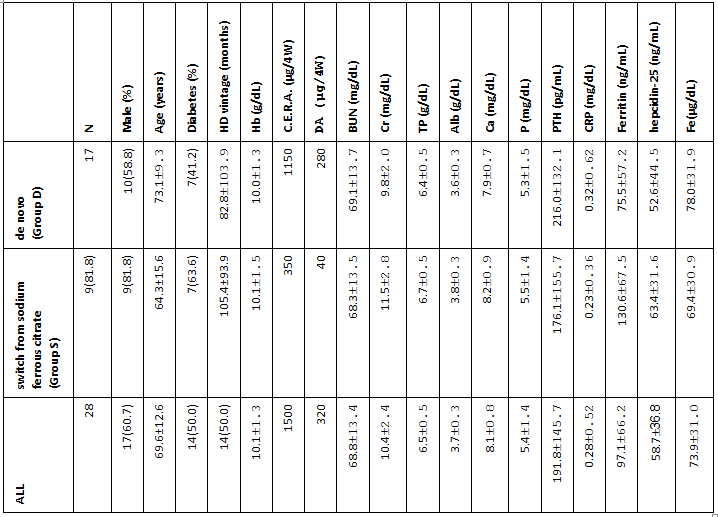
Variables are represented as mean ± standard deviation. HD, hemodialysis; Hb, hemoglobin; C.E.R.A., continuous erythropoietin receptor activator; DA, darbepoetin alfa; BUN, blood urea nitrogen; Cr, creatinine; TP, total protein; Alb, albumin; Ca, calcium; P, phosphate; PTH, parathyroid hormone; CRP, C-reactive protein; Fe, iron.
Table 2: Characteristics of patients administered different doses of sodium ferrous citrate (Study 2)
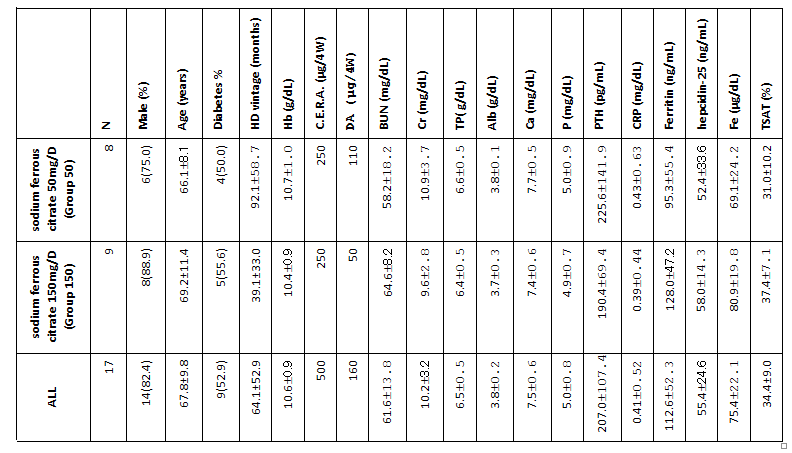
Variables are represented as mean ± standard deviation. HD, hemodialysis; Hb, hemoglobin; C.E.R.A., continuous erythropoietin receptor activator; DA, darbepoetin alfa; BUN, blood urea nitrogen; Cr, creatinine; TP, total protein; Alb, albumin; Ca, calcium; P, phosphate; PTH, parathyroid hormone; CRP, C-reactive protein; Fe, iron; TSAT, transferrin saturation
Table 3:Changes in serum hemoglobin levels, ESA dose and ESA/hemoglobin ratio during the administration of ferric citrate hydrate (Study 1)
| Column1 | Column2 | 0W | 4W | 8W | 12W | 16w | 20W | 24W | 28W | 32W | 36W | 40W | 44W | 48W | 52W | 56W | 60W | 64W |
| Hb (g/dL) | Group D | 10.0 | 10.6 | 11.3 | 11.6 | 11.4 | 11.1 | 10.6 | 10.4 | 10.6 | 11.0 | 11.0 | 11.0 | 10.9 | 10.6 | 10.7 | 10.5 | 10.7 |
| Group S | 10.1 | 10.3 | 10.4 | 10.6 | 10.6 | 10.7 | 10.6 | 10.4 | 10.3 | 10.7 | 11.0 | 11.2 | 11.2 | 10.9 | 10.8 | 10.5 | 10.8 | |
| ALL | 10.1 | 10.5 | 11.0 | 11.2 | 11.0 | 10.9 | 10.6 | 10.4 | 10.5 | 10.9 | 11.0 | 11.0 | 11.1 | 10.8 | 10.8 | 10.5 | 10.7 | |
| ESA (μg/4W) | Group D | 98.8 | 97.1 | 96.5 | 65.3 | 57.6 | 57.5 | 55.6 | 55.6 | 58.8 | 62.5 | 56.7 | 53.6 | 47.9 | 53.1 | 53.8 | 53.8 | 68.0 |
| Group S | 35.5 | 40.0 | 41.8 | 39.1 | 34.5 | 36.4 | 34.5 | 36.4 | 36.4 | 38.2 | 40.9 | 40.0 | 35.5 | 35.5 | 35.5 | 37.3 | 37.3 | |
| All | 73.9 | 74.6 | 75.0 | 55.0 | 48.6 | 48.9 | 47.0 | 47.8 | 49.6 | 52.6 | 50.0 | 47.6 | 42.4 | 45.0 | 45.4 | 46.3 | 51.9 | |
| ESA/Hb | Group D | 10.2 | 9.5 | 8.7 | 5.9 | 5.2 | 5.1 | 5.3 | 5.5 | 5.6 | 5.9 | 5.3 | 4.9 | 4.5 | 5.1 | 5.1 | 5.2 | 6.6 |
| Group S | 3.6 | 4.1 | 4.4 | 3.9 | 3.5 | 3.6 | 3.5 | 3.7 | 3.7 | 3.7 | 3.9 | 3.7 | 3.3 | 3.4 | 3.4 | 3.4 | 3.7 | |
| All | 7.3 | 7.1 | 6.7 | 5.0 | 4.6 | 4.5 | 4.6 | 4.8 | 4.8 | 5.0 | 4.7 | 4.4 | 4.0 | 4.3 | 4.3 | 4.5 | 5.1 |
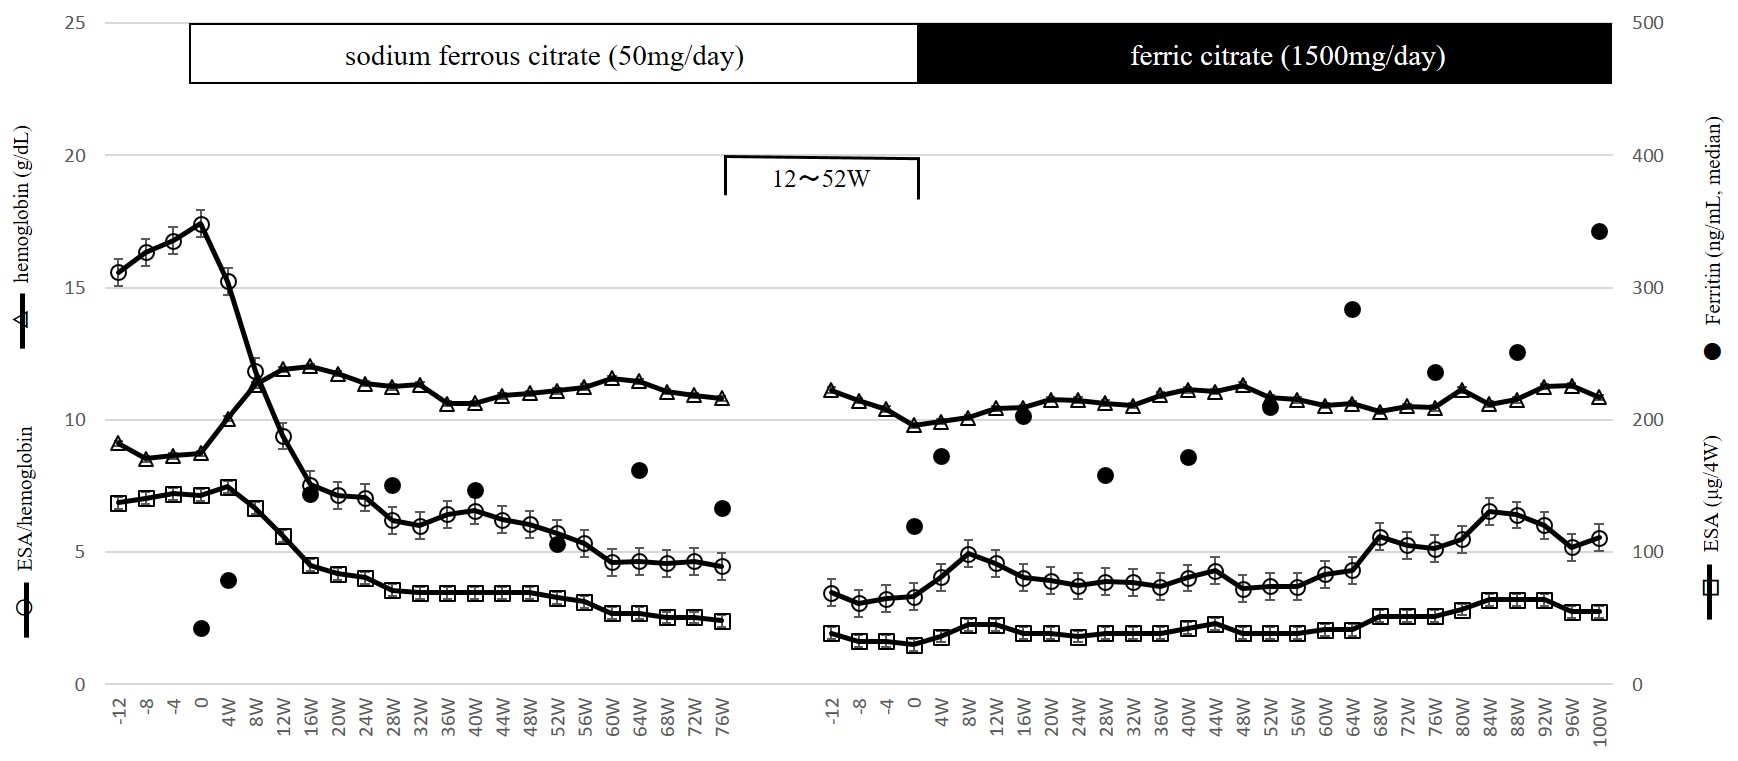
Figure 3: Dose of ESAs, serum hemoglobin levels, ESA/hemoglobin ratio and serum ferritin levels during sodium ferrous citrate administration and after switch to ferric citrate in eight patients of Group S (Study 1).
In Study 2, two and four patients in Group 50 and 150 dropped out, respectively because of admission to another hospital, and eight of Group 50 and nine of Group 150 completed the study (Table 3). Before the analysis of data in Group 50 and 150, the response of hematopoiesis to de novo oral iron (50 mg/day of SF or 105 mg/day of ferrous sulfate hydrate) in these 17 patients was investigated (Figure. 4). De novo oral iron was started 14 ~ 239 weeks before Study 2 was initiated. At the initiation of oral iron, serum ferritin levels were 23.5 ~ 162.7 (median; 74.9 ng/mL). After the initiation of oral iron, Hb increased and ESA dose decreased significantly and reached a plateau at around 18 weeks, demonstrating that these patients were responsive to oral iron and that the supply of iron at the start of Study 2 was sufficient. Then these 17 patients and six patients who dropped out later during Study 2 were divided into Group 50 and 150 randomly. As shown in Figure.5, at 0, 12, 24 and 40 weeks, serum ferritin and hepcidin-25 levels did not change in Group 50 (ferritin; 95.3 ± 55.4, 87.5 ± 34.8, 100.1 ± 24.4 and 86.6 ± 29.4 ng/ml, respectively, hepcidin-25; 52.4 ± 33.6, 40.0 ± 26.1, 45.0 ± 27.4 and 55.9 ± 34.2 ng/ml, respectively). On the other hand, in Group 150, serum ferritin and hepcidin-25 levels increased with time (0, 12, 24 and 40 weeks, ferritin; 128.0 ± 47.2, 143.8 ± 39.0, 179.0 ± 54.7 and 213.6 ± 70.9 ng/ml, respectively, 0W vs 24W, 40W p < 0.05, hepcidin-25; 58.0 ± 14.3, 71.3 ± 27.4, 81.7 ± 38.0 and 102.8 ± 46.9 ng/ml, respectively, 0W vs 40W p < 0.01). Despite the changes in iron store status in Group 150, Hb levels and TSAT did not change like in Group 50.
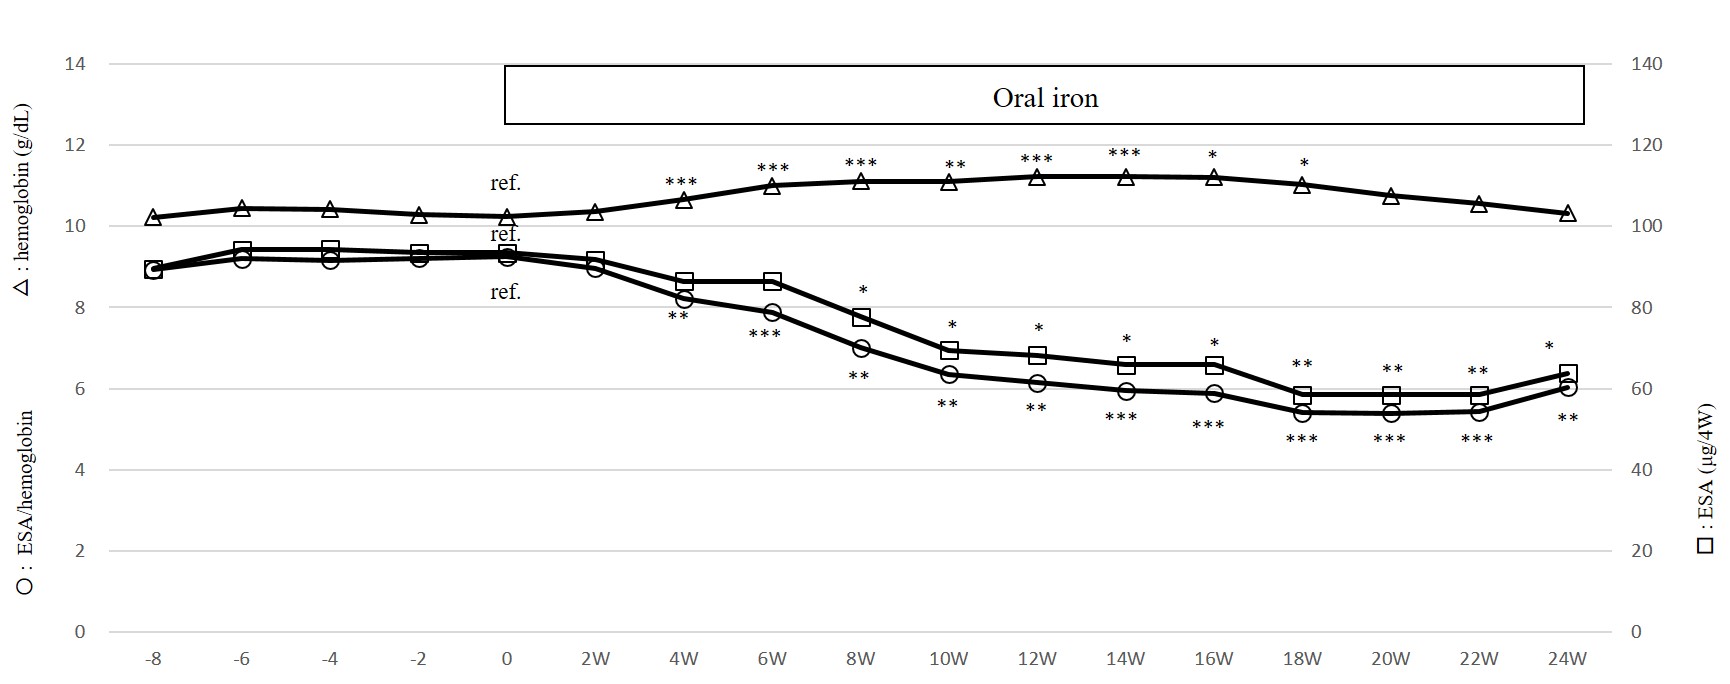
Figure 4: Dose of ESAs, serum hemoglobin levels and ESA/hemoglobin ratio before and during de novo oral iron administration in patients who completed Study 2
Student t test, *: p < 0.05, **: p < 0.01, ***: p < 0.005
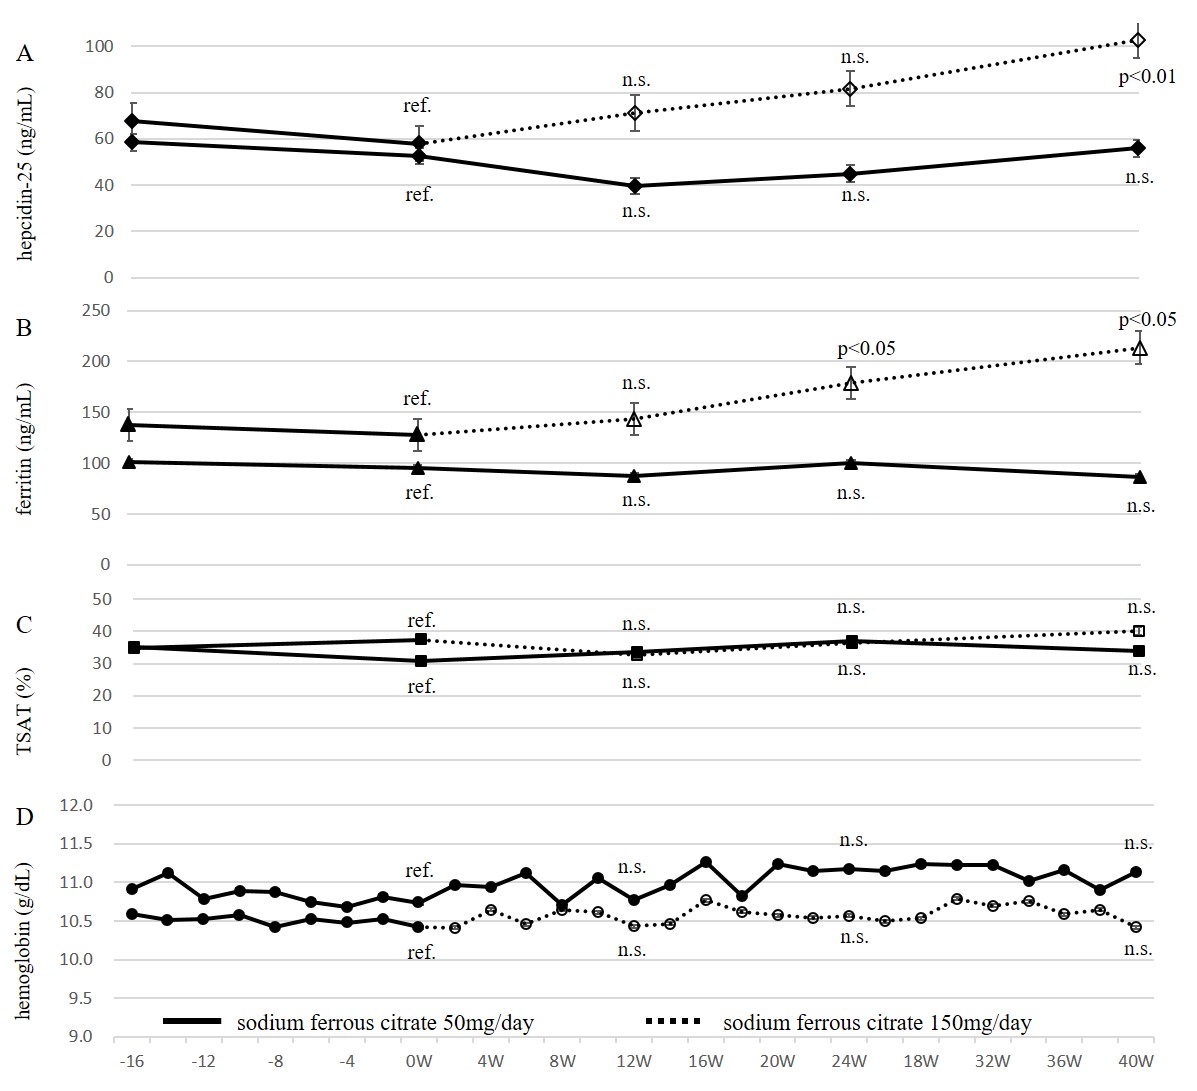
Figure 5: Serum hepcidin-25 (A), ferritin (B), TSAT (C) and hemoglobin (D) levels during sodium ferrous citrate administration (Study 2)
Solid lines and black symbols indicate data during 50 mg/day of sodium ferrous citrate. Dotted lines and open symbols indicate data during 150 mg/day.
Discussion
Since the introduction of ESAs for the treatment of anemia in hemodialysis patients, iron deficiency has become an important underlying component of anemia in hemodialysis patients[3]. Although oral iron supplementation is supposed to be more physiologic than the IV one, oral iron absorption is appreciable when serum ferritin concentration is less than 70 to 100 ng/ml and decreases when this exceeds 300 ng/ml[13], and IV iron administration has been recommended[6-8]. Recently, the phosphate binder FC has been reported to be a promising oral iron supplier in patients with chronic kidney disease[9-12]. After the appearance of FC not only IV iron, but also oral iron has also been accepted for iron administration in hemodialysis patients in Japan[14].
The serum ferritin level at the time of oral iron administration seems to be an important factor influencing the effectiveness of oral iron for anemia. Our previous report demonstrated the effectiveness of oral iron (FC or SF) in hemodialysis patients with serum ferritin levels less than 100 ng/ml at administration but not in those with levels higher than 100 ng/ml without iron therapy for more than three months[16]. Also, in a recent report that demonstrated the effectiveness of FC for anemia in patients with chronic kidney disease, the mean serum ferritin level was 85.9 ng/ml[12]. In contrast, the mean serum ferritin levels in patients receiving oral ferrous sulfate or iron polysaccharide reported by Fishbane et al[4] and MacDougall et al[5] were higher, 178.9 and 309 ng/ml, respectively. These results suggest that not only the chemical composition (FC or not) or dose of oral iron therapy, but also the background at iron administration (e.g. preexisting iron load or inflammation) affects the effectiveness of oral iron treatment.
Serum ferritin levels in hemodialysis patients are highly variable between countries and lower in Japan than those in western countries. Causes of this include smaller IV iron dose[17] and lower C-reactive protein levels[18] in Japanese hemodialysis patients than in those in western countries. Targets of serum ferritin levels in hemodialysis patients are also widely different between countries. IV iron administration is recommended when serum ferritin levels are less than 100 ng/ml in Japan[7,14], 300 ng/ml in the European Best Practice (ERBP) group[19] and 500 ng/ml in the Kidney Disease: Improving Global Outcomes (KDIGO)[20].
IV iron has advantages over oral iron in hemodialysis patients targeted at high serum ferritin levels because it bypasses regulation of iron absorption in the duodenum and intestine, but if a high dose of IV iron is given rapidly, the binding capacity of transferrin is exceeded, which results in the generation of non-transferrin bound iron[21], which is expected to cause cellular injury[22,23] and associations between high doses of IV iron and increased risks of cardiovascular disease, infection, hospitalization and death have been reported[24,25]. Instead, oral iron is unlikely to induce the generation of non-transferrin bound iron because enteral absorbed iron is rapidly bound to transferrin. Moreover, iron load induces hepcidin synthesis and limits further enteral iron absorption and release of iron from iron stores[26], which implies that compared to IV iron, oral iron is unlikely to cause iron overload. Although it is reported that serum ferritin levels > 340 ng/ml in dialysis patients with IV iron were associated with iron overload[27], it is not known how high serum ferritin levels must be in patients with oral iron to be associated with harm.
While iron is indispensible for erythropoiesis, most of a rapidly given high dose of IV iron is unavailable for erythropoiesis[28]. This is also speculated to be the case for oral iron in the presence of sufficient iron stores. As shown in Study 1 and 2, increased serum ferritin levels after the administration of 1500 mg/day of FC switched from long-term 50 mg/day of SF and that after the increase of SF dose from 50 mg/day to 150 mg/day did not result in active erythropoiesis. In Study 2, dose up to 150 mg/day of SF increased serum ferritin levels but did not increase TSAT, suggesting that in stable hemodialysis patients, long-term 50 mg/day of SF can supply sufficient iron for erythropoiesis in blood while more oral iron supply just increases the iron store. Although Umanath et al demonstrated a reduction in IV iron and ESA use in hemodialysis patients with high ferritin levels by FC, reduction of IV iron was prominent and that of ESA dose was very small[9]. It is likely that, IV iron reduction was due to increased serum ferritin levels by absorption of iron from FC, the contribution of which to erythropoiesis may be small.
The current study showed that, the erythropoetic potential of 50 mg/day of SF was not inferior to that of 1500 mg/day of FC or 150 mg/day of SF, which suggests that higher serum ferritin levels induced by iron dosing do not necessarily result in higher responsiveness to ESAs. Although we use serum ferritin level as a useful marker of iron stores, it is not a perfect marker; e.g. high serum ferritin levels cannot distinguish reticulo endothelial blockade from functional iron deficiency. Ferritin is also a non-specific marker of inflammation and can increase even in the absence of an increasing iron load. Although there are various causes of high serum ferritin levels in hemodialysis patients and some causes are not treatable, high serum ferritin levels by iron overload are intentionally induced by physicians to treat anemia. It is possible that in hemodialysis patients with low serum ferritin levels (e.g. less than 100 ng/ml), sustained small-dose oral iron can prevent iron overload and hepcidin synthesis, possibly resulting in more sustained iron use for erythropoiesis and better control of serum Hb levels with less ESA use than bolus high dose IV administration.
Conclusion
We conclude that a higher dose of SF or FC increases serum ferritin levels more than a low dose of SF, without a notable effect on anemia. In stable hemodialysis patients with low serum ferritin levels, compared to higher dose of SF and FC, low dose of SF has a comparable effect on anemia with a less marked increase in serum ferritin levels.
Abbreviations
ESA: Erythropoietin Stimulating Agents; IV: Intravenous; FC: Ferric Citrate; SF: Sodium Ferrous Citrate; Hb: Hemoglobin; TSAT: Transferrin Saturation; C.E.R.A: Continuous Erythropoietin Receptor Activator
Ethics approval and consent to participate
This study was approved by the local ethics committee (issue 2017-A1 at Daimon Clinic for Internal Medicine, Nephrology and Dialysis), and was conducted in accordance with the Helsinki Declaration of 1975, as revised in 2004. Written informed consent was obtained from all patients.
Consent for publication: Not applicable.
Availability of data and materials: The datasets used and/or analysed during the current study are available from the corresponding author on reasonable request.
Conflicts of interest: The author has no conflicts of interest to declare.
Funding: There is no funding to be disclosed.
Author’s contributions: SD conceived of the study, participated in its design, wrote and approved the final manuscript.
Acknowledgments: The author thanks all staff members working at Daimon Clinic for Internal Medicine, Nephrology.
References
1. McGonigle, R.J., Walling, J.D., Shadduck, R.K., et al. Erythropoietin deficiency and inhibition of erythropoiesis in renal insufficiency. (1984) Kidney Int 25(2): 437-444.
2. Kidney Disease Improving Global Outcomes (KDIGO). Clinical Practice Guideline for Anemia in Chronic Kidney Disease. (2012) Kidney Int Suppl 2(4): 292-298.
PubMed||CrossRef||Others
3. Eschbach, J.W., Egrie, J.C., Downing, M.R., et al. Correction of the anemia of end-stage renal disease with recombinant human erythropoietin. (1987) N Engl J Med 316(2): 73-78.
4. Fishbane, S., Frei, G.L., Maesaka, J. Reduction in recombinant human erythropoietin doses by the use of chronic intravenous iron supplementation. (1995) Am J Kidney Dis 26(1): 41-46.
5. MacDougall, I.C., Tucker, B., Thompson, J., et al. A randomized controlled study of iron supplementation in patients treated with erythropoietin. (1996) Kidney Int 50(5): 1694-1699.
6. K/DOQI. K.DOQI clinical practice guidelines and clinical recommendation for Anemia in Chronic Kidney Disease. (2006) Am J Kidney Dis; 47(Suppl 3): S58-S70.
PubMed||CrossRef||Others
7. Tsubakihara, Y., Nishi, S., Akiba, T., et al. 2008 Japanese Society for Dialysis Therapy: Guidelines for Renal Anemia in Chronic Kidney Disease. (2010) Ther Apher Dial 14(3): 240-275.
8. Shepshelovich, D., Rozen-Zvi, B., Avni, U., et al. Intravenous versus oral iron supplementation for the treatment of anemia in CKD: An updated systematic review and metaanalysis. (2016) Am J Kidney Dis 68(5): 677-690.
9. Umanath, K., Jalal, D.I., Greco, B.A., et al. Ferric citrate reduces intravenous iron and erythropoiesis-stimulating agent use in ESRD. (2015) J Am Soc Nephrol 26(10): 2578-2587.
10. Nakanishi, T., Hasuike, Y., Nanami, M., et al. Novel iron-containing phosphate binders and anemia treatment in CKD: oral iron intake revisited. (2016) Nephrol Dial Transplant 31(10): 1588-1594.
11. Block, G.A. Ferric citrate in patients with chronic kidney disease. (2016) Semin Nephrol 36(2): 130-135.
12. Fishbane, S., Block, G.A., Loram, L., et al. Effects of ferric citrate in patients with nondialysis-dependent CKD and iron deficiency anemia. (2017) J Am Soc Nephrol 28(6): 1851-1858.
13. Eschbach, J.W., Cook, J.D., Scribner, B.H., et al. Iron balance in hemodialysis patients. (1977) Ann Intern Med 87(6): 710-713.
14. Yamamoto, H., Nishi, S., Tomo, T., et al. 2015 Japanese Society for Dialysis Therapy: guidelines for renal anemia in chronic kidney disease. (2017) Renal Replacement Therapy 3: 36.
15. Itkonen, O., Parkkinen, J., Stenman, U.H., et al. Preanalytical factors and reference intervals for serum hepcidin LC-MS/MS method. (2012) Clin Chim Acta 413(7-8): 696–701.
16. Daimon, S., Mizushima, I. Effect of oral and intravenous iron therapy on hemoglobin levels in hemodialysis patients according to serum ferritin level. (2016) Renal Replacement Therapy 2: 63.
17. Bailie, G.R., Larkina, M., Goodkin, D.A., et al. Variation in intravenous iron use internationally and over time: the Dialysis Outcomes and Practice Pattern Study (DOPPS). (2013) Nephrol Dial Transplant 28(10): 2570-2579.
18. Bazeley, J., Bieber, B., Li, Y., et al. C-reactive protein and prediction of 1-year mortality in prevalent hemodialysis patients. (2011) Clin J Am Soc Nephrol 6(10): 2452-2461.
19. Locatelli, F., Bárány, P., Covic, A., et al. Kidney disease: Improving Global Outcomes guidelines on anaemia management in chronic kidney disease: a European Renal Best Practice position statement. (2013) Nephrol Dial Transplant 28(6): 1346-1359.
20. Kidney Disease Improving Global Outcomes: KDIGO Clinical Practice Guideline for Anemia in Chronic Kidney Disease: Summary of recommendation statements. (2012) Kidney Int Suppl 2: 283-287.
PubMed||CrossRef||Others
21. Rooyakker, T.M., Stroes, E.S., Kooistra, M.P., et al. Ferric saccharate induces oxygen radical stress and endothelial dysfunction in vivo. (2002) Eur J Clin Invest 32(Suppl 1): 9-16.
22. Slotki, I., Cabantchik, Z.I. The labile side of iron supplementation in CKD. (2015) J Am Soc Nephrol 26(11): 2612-2619.
23. Lim, C.S., Vaziri, N.D. The effects of iron dextran on the oxidative stress in cardiovascular tissues of rats with chronic renal failure. (2004) Kidney Int 65(5): 1802-1809.
24. Kuragano, T., Matsumura, O., Matsuda, A., et al. Association between hemoglobin variability, serum ferritin levels, and adverse events/mortality in maintenance hemodialysis patients. (2014) Kidney Int 86(4): 845-854.
25. Bailie, G.R., Larkina, M., Goodkin, D.A., et al. Data from the Dialysis Outcomes and Practice Pattern Study validate an association between high intravenous iron doses and mortality. (2015) Kidney Int 87(1): 162-168.
26. Young, B., Zaritsky, J. Hepcidin for clinicians. (2009) Clin J Am Soc Nephrol 4: 1384-1387.
27. Canavese, C., Bergamo, D., Ciccione, G., et al. Validation of serum ferritin values by magnetic susceptometry in predicting iron overload in dialysis patients. (2004) Kidney Int 65(3): 1091-1098.
28. Gaweda, A.E., Ginzburg, Y.Z., Chait, Y., et al. Iron dosing in kidney disease: inconsistency of evidence and clinical practice. (2015) Nephrol Dial Transplant 30(2): 187-196.


