
Nutritional Status Assessment of Women from Different Occupations in Urban and Semi-Urban Regions of Gujarat
Pinal A. Patel1,2*, Prerna P. Patel1,2, Bhrugu Yagnik4, Khevna Vora5, Anshika Verma5, Ashish D. Patel1, Shashi A. Chiplonkar3, Anuradha V. Khadilkar3
Affiliation
- 1Department of Biotechnology, Hemchandracharya North Gujarat University, Patan-384265, Gujarat, India
- 2Department of Biochemistry and Biotechnology, Khyati Institute of Science, Khyati Foundation, Ahmedabad-380058, Gujarat, India
- 3Hirabai Cowasji Jehangir Medical Research Institute, Jehangir Hospital, 32, Sassoon Road, Pune-411001, Maharashtra, India
- 4Department of Biochemistry, The Maharaja Sayajirao University of Baroda, Vadodara-390002, Gujarat, India
- 5Department of Biochemistry, M G. Science Institute, Ahmedabad-380009, Gujarat, India
Corresponding Author
Pinal Patel, Department of Biotechnology, Hemchandracharya North Gujarat University, Patan -384265, Gujarat, India, Tel: +91-9427800219; E-mail: pinalmails@yahoo.co.in
Citation
Patel, P.A., et al. Nutritional status assessment of women from different occupations in urban and semi-urban regions of Gujarat. (2016) Int J Food Nutr Sci 3(2): 381-384.
Copy rights
© 2016 Patel, P.A. This is an Open access article distributed under the terms of Creative Commons Attribution 4.0 International License.
Abstract
Objective: To assess the nutritional status of women in urban and semi-urban regions of Gujarat.
Methodology: A cross-sectional study on 605 women (aged 18 - 50 years) from urban and semi urban region was conducted in Gujarat, Western India. The parameters analyzed were anthropometry and body composition. Assessment of nutritional status was performed using BMI to evaluate percentage underweight, overweight and obesity. The analysis was stratified for the regions (urban or semi-urban) and type of occupation (students, housewives, working women). Chi square test was used to estimate percentage prevalence of underweight, overweight and obesity amongst different groups of women.
Results: Students from urban region had higher mean BMI (21.4 ± 3.7 kg/m2) and PBF (29.5 ± 5.9%) as compared to students of semi urban region (BMI: 19.8 ± 3.7 kg/m²; PBF: 26.0 ± 6.1%) (p < 0.05). Homemakers of urban region showed significantly lower BMI (24.7 ± 4.3 kg/m²) and PBF (34.8 ± 6.2%) as compared to homemakers of semi-urban region (BMI: 26.0 ± 4.8 kg/m² PBF: 36.6 ± 6.2%) (p < 0.05). Working women group in both regions did not differ significantly for their BMI and PBF (p > 0.05). Students of semi-urban region showed high percentage of underweight (43.60%) as compared to students of urban region (19%) (p < 0.05). While in homemakers of semi-urban region 41% overweight and 19% obesity was observed whereas, in urban region it was 31% and 12% respectively (p < 0.05). Percentage of underweight, overweight and obesity was not significantly different in working women amongst two regions (p > 0.05).
Conclusion: The study indicated coexistence of obesity and under-nutrition in semi-urban region of Gujarat. These dual nutritional health problems are developing specially in urbanizing areas of our country.
Introduction
Nutritional status of the Indian population changes significantly with changing regions. In the 21st century, prevalence of overweight and obesity has increased by many folds in Asian countries. The prevalence of overweight and obesity is developing as a serious health problem in the urban population; at the same time the problem of under-nutrition continues to be a major issue in rural population[1]. Body Mass Index (BMI) is most widely used practical marker to measure nutritional status and body composition and further categorize underweight, overweight, and obesity in adults[2-4].
Factors like the imbalanced energy consumption, physical activity, socioeconomic[5-7] differences and environmental conditions significantly influence obesity. Data suggest that women as compared to men are more vulnerable to develop nutritional complications like overweight/obesity; at the same time women of reproductive age are also severely affected by malnutrition (deficiencies like iron, zinc and iodine)[1]. Prevalence of under nutrition is more in rural areas whereas overweight/obesity is higher in urban areas. Whereas, in urbanizing rural (semi-urban) population occurrence of overweight/obesity is expected to be lower as compared to urban population, however, increasing trend of obesity is also affecting such regions. Reports suggest that the living conditions in semi urban and rural areas are changing considerably with adaptation to urban lifestyle like better transport facilities, increased television watching, decreased physical activity and changing food habits (increased consumption of junk food and sweetened carbonated drinks) due to easy access to better amenities[1,8]. Hence, the present study was conducted to assess the nutritional status of women belonging to different occupations from urban and semi-urban regions of Gujarat.
Methodology
Study Population and sample size
A cross sectional study was conducted from January 2012 to June 2014 to evaluate the nutritional status of women aged 18 to 50 years (n = 605) living in urban (Ahmedabad) and surrounding semi-urban region (Patan) of Gujarat, Western India.
A total of 605 healthy women were included in the study, 305 from urban region and 300 from semi urban region were selected randomly to obtain a mixed population. The study population was further categorized into three groups, based on occupations they were involved in: (1) Students (2) Homemakers (3) Working women. The selection of women was done from different organizations and residential areas on voluntary basis from the study regions, using simple random sampling method. Participants with past history of chronic ailment early loss of ovaries, other gynaecological problems, pregnancy, lactation or any major surgery were excluded from the study. A list of eligible women was made which included 710 women and selection of participants was performed by random number generation (participation rate was 86%). A total of 605 women from different occupations, i.e. (1) Students (n = 194) (2) Homemakers (n = 207) (3) Working women (n = 204) were enrolled in the study.
Ethical approval and consent
The purpose and importance of the study was explained to all the participants and administrative authorities. An informed written consent was obtained from all participants as well as the head of each participating institute (colleges, non-governmental organizations, offices and hospitals) for the enrolment of students and working women. Ethical approval was obtained from the Ethics Committee of Gujarat Medical Education & Research Society General Hospital, Gandhinagar, Gujarat.
Data collection
Anthropometry and body composition
Height was measured to the nearest 1 mm, using a stadiometer stadiometer; without shoes (Leicester Height Meter, Child Growth Foundation, UK, range 60 – 207 cm). Weight nearest to 0.1 kg and body composition parameters [Percentage Body Fat (PBF)] measured using Bioelectrical Impedance Analysis (BIA) on a Body Composition Monitor (SC240 MA, Tanita, India) and an estimated clothing weight was subtracted. BMI was calculated as weight (kg)/height (m²). Underweight (BMI < 18.5 kg/m²), normal-weight (between 18.5 - 25 kg/m²) overweight (between 25 – 30 kg/m²) and obese (BMI > 30 kg/m²) was identified by BMI criteria recommended by World Health Organization[9]. PBF level was classified according to categories recommended by tanita validation reports[10]. In 18 - 39 years old women PBF was categorized as low (< 21%), normal (21 - 35%), increased (35 - 40%) and high ( > 40%), while in 40 - 59 years old women it was categorized as low ( < 22%), normal (22 - 36%), increased (36 - 41%) and high ( > 41%).
Statistical analysis
Mean ± standard deviations were computed for anthropometric measures, body composition and physical activity in women belonging to different occupations in both the region. Student’s T test was used to calculate the difference in anthropometric and body composition parameters for all three groups between urban and semi-urban regions. One way ANOVA followed by pair wise comparisons using Tukey’s multiple comparison method was used to test the differences in characteristics of participants. Chi square test was used to estimate percentage prevalence of underweight, overweight and obesity amongst different groups of women. The analysis was stratified for the regions (i.e. urban or semi-urban) and type of occupation (i.e. students, homemakers, working women). All analysis were performed using SPSS version 18.0 and the statistical significance level was set at p < 0.05.
Results
A total of 605 women with the mean age of 31 years were studied. Table 1 summarizes the descriptive characteristics (Mean ± standard deviation) of the women living in urban and semi-urban regions; no significant difference was observed for anthropometric (weight, height and BMI) and body composition parameters amongst the two regions (Table 1). The study population was further stratified by occupation and each group were compared for anthropometric and body composition characteristics amongst the two study regions. Table 2 displays the descriptive characteristics; the students and homemakers of both regions showed significant difference in their BMI and body composition. Students from urban region had higher BMI (21.4 ± 3.7 kg/m²) and PBF (29.5 ± 5.9%) as compared to students of semi urban region (BMI: 19.8 ± 3.7 kg/m²; PBF: 26.0 ± 6.1%) (p < 0.05). The homemakers of urban region showed significantly lower BMI (24.7 ± 4.3 kg/m2) and PBF (34.8 ± 6.2%) as compared² to homemakers of semi-urban region (BMI: 26.0 ± 4.8 kg/m²; PBF: 36.6 ± 6.2%) (p < 0.05). Working women group in both the regions did not differ significantly for their BMI and PBF (p > 0.05).
Table 1: Descriptive characteristics of women belonging to urban region and semi-urban regions.
| Regions | ||
|---|---|---|
| Urban (n = 305) | Semi-urban (n = 300) | |
| Age(years) | 30.5 ± 8.4 | 31.4 ± 9.7 |
| Height(cm) | 155.4 ± 5.7 | 155.1 ± 5.5 |
| Weight(kg) | 56.3 ± 11.0 | 55.8 ± 12.3 |
| BMI (kg/m²) | 23.3 ± 4.3 | 23.2 ± 4.9 |
| PBF | 32.64 | 32.25 |
No significance difference was observed (p < 0.05)
Table 2: General characteristic of women from two regions stratified according to their occupations.
| Students | Homemakers | Working Women | ||||
|---|---|---|---|---|---|---|
| Urban region (n = 100) | Semi-urban region (n = 94) | Urban region (n = 100) | Semi-urban region (n = 107) | Urban region (n = 105) | Semi-urban region (n = 99) | |
| Age | 21.9 ± 2.7* | 20.0 ± 1.6 | 35.6 ± 5.7 | 36.4 ± 6.7 | 33.68 ± 8.1 | 36.8 ± 7.5 |
| Height(cm) | 155.9 ± 5.7 | 154.7 ± 6.0 | 155.2 ± 5.8 | 155.02 ± 5.2 | 155.0 ± 5.5 | 155.5 ± 5.2 |
| Weight(kg) | 52.1 ± 9.1* | 47.6 ± 9.9 | 59.8 ± 11.6 | 62.5 ± 11.9 | 57.0 ± 10.8 | 56.5 ± 10.0 |
| BMI (kg/m²) | 21.4 ± 3.7* | 19.8 ± 3.7 | 24.7 ± 4.3* | 26.0 ± 4.8 | 23.7 ± 4.2 | 23.3 ± 3.9 |
| PBF | 29.5 ± 5.9* | 26.0 ± 6.1 | 34.8 ± 6.2* | 36.6 ± 6.2 | 33.4 ± 6.0 | 33.3 ± 6.0 |
* Significance difference (p < 0.05) of variables between the groups.
The overall prevalence of overweight and obesity was 26% and 8% in our study population. The percentage of obesity was marginally higher in semi-urban region than urban region. In urban region the percentage of overweight and obesity was 26% and 6% respectively, whereas, in semi-urban region women overweight and obesity were 26% and 10% respectively (p = 0.05).
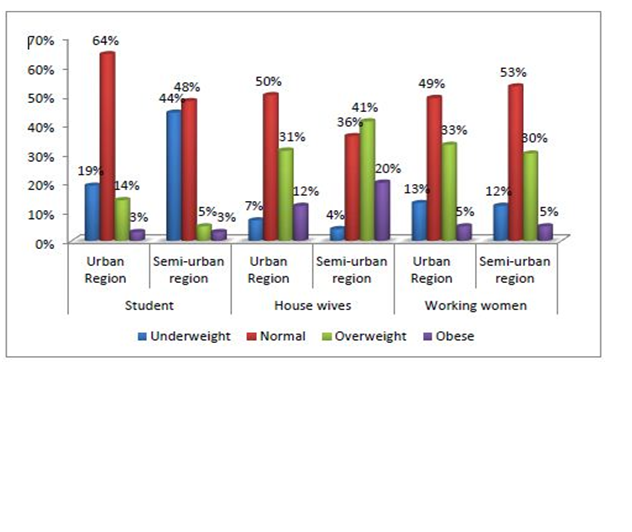
Figure 1: Percentage prevalence of underweight, overweight and obesity in women from two regions stratified according to their occupations.
Figure 1 shows percentage of obesity in study population further stratified according to occupation in two different regions. The students of semi-urban region showed very high percentage of underweight (44%) as compared to students of urban region (19%) (p < 0.05) while students of urban region showed high percentage of overweight (14%) as compared to semi-urban region students (5%). Homemakers showed completely different scenario; 41% overweight and 19% obesity was observed in homemakers of semi-urban region showed whereas, 31% over weight and 12% obesity was seen in urban region homemakers (p < 0.05). The working women did not show any significant difference in percentage of underweight, overweight and obesity amongst the two study regions (p > 0.05).
When the study population was compared for PBF levels in same occupation in two regions; significant difference was observed in students and homemaker groups. In urban region students 9% had low, 74% had normal, 13% had increased and 4% had high PBF, while in semi-urban region students 24%, 69% , 3% and 4% had low, normal, increased and high PBF respectively.
Homemakers of semi-urban region showed increased percentage of high PBF as compared to urban region homemakers. Amongst urban homemakers 1% showed low, 50% showed normal, 27% showed increased and 22% showed high PBF whereas in semi-urban none of homemakers had low PBF, 38% had normal, 34% had increased and 28% had high PBF. In working women PBF did not differ significantly; in urban working women 4% had low, 55% normal PBF, 30% had increased and 11% had high PBF while in semi-urban working women 4%, 54%, 34% and 9% showed low, normal, increased and high PBF respectively.
Discussion
Our study results indicated that anthropometry and body composition of women did not vary significantly amongst urban and semi urban regions. However, when the study population was stratified according to the occupation i.e. students, homemakers and working women, there was significant difference in anthropometry and body composition parameters amongst the occupational groups of two regions. The prevalence of obesity was marginally different amongst the two regions; semi-urban region was more affected for obesity as well as underweight.
Nevertheless, it differed significantly amongst same occupations in both regions. The homemakers of semi-urban region showed high percentage of obesity whereas students showed more of underweight. Our results go well with the previous studies that have reported the coexistence of obesity and underweight in Indian population[1]. Ramachandran et al., have reported that the countries passing through the nutritional transition still face severe contradiction in families where children are underweight and the adults are overweight[8].
In our study we found higher prevalence for obesity in semi urban population, our results are in line with previous review that illustrated the changing scenario in semi-urban and urbanizing rural population where increasing trend in obesity has been reported[8]. Considerable improvement in living conditions in rural and semi urban areas, where life style has changed dramatically, eventually leading to significant increase in obesity[1,8]. At the same time, in our study the prevalence of underweight still remains the maximum in the semi-urban region as compared to urban population[11]. This result reconfirms the existence of high prevalence of underweight/under nutrition in the population adopting urbanization due to socioeconomic and nutritional transition and less awareness about the health[1,8,12]. Along with regional differences, age, socio-culture lifestyle differences and marital status are believed to be the majorly associated factors for prevalence of obesity amongst homemakers and underweight in students of the same region[13]. Other past studies have mostly focused the differences between rural and urban populations. The strength of the study is that we have focused the population from developing region (semi urban region) that is adopting urbanization and not the rural region. One of the study limitations is that our study is cross sectional, however, ours is one of the very few studies that have assessed the prevalence of obesity in women involved in different occupations from different regions.
Conclusion
The study indicated coexistence of obesity as well as under-nutrition in semi-urban region of Gujarat. These dual nutritional health problems are developing specially in urbanizing areas of our country, thus detailed studies are required for better understanding of the causative factors like behavioural, socio-cultural and environmental which influence these conditions.
References
- 1. Kalra, S., Unnikrishnan, A. Obesity in India: The weight of the nation. (2012) J Med Nutr Nutraceuticals 1(1): 37-41.
- 2. Rush, E.C., Freitas, I., Plank, L.D. Body size, body composition and fat distribution: comparative analysis of European, Maori, Pacific Island and Asian Indian adults. (2009) Br J Nutr 102(4): 632–641.
- 3. Ross, A.C. Eff Br mindfulness Interv acute pain Exp An Exam Individ Differ. (2015) Modern Nutrition, In Health and Disease.
- 4. “Clinical guidelines on the identification, evaluation, and treatment of overweight and obesity in adults”. (1998) NIH Publ.
- 5. Rohrer, J.E., Pierce, J.R., Blackburn, C. Lifestyle and mental health. (2005) Prev Med 40(4): 438–443.
- 6. Guilbert, J.J. The world health report 2002 - reducing risks, promoting healthy life. (2003) Educ Health (Abingdon) 16(2): 230.
- 7. Physical Activity Fundamental to Preventing Disease. (2002) U.S Dep Heal Hum Serv.
- 8. Ramachandran, A., Snehalatha, C. Rising burden of obesity in Asia. (2010) J Obes.
- 9. Nutrition Landscape Information System (NLiS). WHO (2010) 38.
- 10. Anjos, L.A., Teixeira Fda, C., Wahrlich, V., et al. Body fat percentage and body mass index in a probability sample of an adult urban population in Brazil. (2013) Cad Saude Publica 29(1): 73–81.
- 11. Rohrer, J.E., Borders, T.F., Blanton, J. Rural residence is not a risk factor for frequent mental distress: a behavioral risk factor surveillance survey. (2005) BMC Public Health 5: 46.
- 12. Griffiths, P.L., Bentley, M.E. The nutrition transition is underway in India. (2001) J Nutr 131(10): 2692–2700.
- 13. Saboo, B., Shah, S., Talaviya, P., et al. Prevalence of obesity and overweight in housewives and its relation with household activities and socio-economical status. (2014) J Obes Metab Res 1(1): 20-24.


