
Osteogenic Differentiation Of Human Adipose-Derived Stem Cells (hASC): Role Of FAK and Ras-MAPK Signaling
Andrea Deiwick1,
Affiliation
- 1Laser Zentrum Hannover e.V., Department of Nanotechnology, Hollerithallee 8, 30419 Hannover, Germany
- 2Institute of Quantum Optics, Leibniz University Hannover, Welfengarten 1, 30167 Hannover, Germany
Corresponding Author
Dr. Schlie-Wolter, S. Laser Zentrum Hannover e.V., Department of Nanotechnology, Hollerithallee 8, 30419 Hannover, Germany; Tel: +49511/2788-303; E-mail: s.schlie@lzh.de
Citation
Schlie-Wolter, S., et al. Osteogenic Differentiation of Human Adipose- Derived Stem Cells (hASC): Role of FAK and Ras-MAPK Signaling. (2016) J Stem Cell Regen Bio 2(1): 52- 70.
Copy rights
© 2016 Schlie-Wolter, S. This is an Open access article distributed under the terms of Creative Commons Attribution 4.0 International License.
Keywords
Adipose-derived stem cells; Osteogenic differentiation; ERK; JNK; FAK; Ras
Abstract
Human adipose-derived stem cells (hASCs) are an attractive cell source for stem cell research and regenerative medicine. Being capable to undergo osteogenic differentiation,however, the involved molecular pathways are poorly understood. Here, we focused on lineage commitment in dependence of different hASC donors via inhibiting the mitogen-activated protein kinases ERK and JNK, and their regulators FAK and Ras. Differentiation was analyzed under control, osteogenic, and solvent DMSO conditions with respect to cell morphology, focal adhesion formation, extracellular matrix production, expression of the transcription factors Runx2 and osterix, BMP-2- Smad and ERK signaling, and osteogenic markers (alkaline phosphatase activity, calcium mineralization, osteocalcin/osteopontin expression). Under control conditions, no osteogenic differentiation occurred. After inhibition the extent of each parameter varied with the hASC donor; the solvent had no remarkable impact on osteogenic markers compared with the osteogenic differentiation. The inhibitors of FAK and JNK cross talked with ERK and reduced the investigated parameters the strongest. Inactivation of ERK caused a moderate and marker specific inhibition. Blocked Ras promoted the cell responses in an ERK-independent way. All pathways depend on Runx2 and osterix. A correlation between the interplay with BMP-2-Smad pathway, and cell elongation with osteogenic differentiation could not be determined, while focal adhesion formation was essential.
Introduction
Knowledge of stem cell differentiation finds various applications in basic cell biology research and translational fields such as disease models and regenerative medicine. In this connection, osteogenic differentiation of mesenchymal stem cells (MSCs) has been widely studied. Several external parameters have an impact on this lineage specification. Matrix elasticity in form of stiff environments, growth factors like bone morphogenic proteins (BMP), and large cell shapes were shown to favor osteogenesis[1]. Last is analyzed via typical osteogenic markers such as alkaline phosphatase (ALP) activity, collagen type I expression, calcium mineralization, and osteogenic proteins like osteocalcin, osteopontin, and bone sialoprotein.
Each marker refers to genes (for instance Spp1, Col1a1, Bglap), which are activated by the transcription factors Runt-related transcription factor 2 (Runx2) and osterix. The differentiation of progenitor cells strongly correlates with Runx2, but in the absence of osterix these progenitor cells follow chondrogenic instead of osteogenic differentiation[2]. First the presence of osterix abolishes Sox9 expression as the key for chondrogenesis and enables osteogenesis, especially observed in osteoblast maturation. It is concluded, that the full osteogenic transcriptional functionality depends on a complex of both Runx2 and osterix at the promotor regions of the genes[2]. Their cooperation is mediated by their enhancer regions and cofactors having a stimulative or inhibitive effect. Additionally, phosphorylation is required: the higher, the higher the transcriptional activity. The question is how Runx2 and osterix become activated. In this connection, different signaling pathways and interplays are involved.
A dominant role is attributed to the pathway of mitogen-activated protein kinases (MAPK), which belong to the family of serine/threonine specific kinases. Beside their regulative role in survival and proliferation, effects on osteogenic differentiation were documented. They directly phosphorylate Runx2 and osterix followed by an increase of osteogenic markers. MAPK impact depends on their own phosphorylation mediated by MAPK kinases, which are in turn activated via MAPKK kinases[3]. This cascade is initiated by external signals. On the one hand growth factors stimulate activation of the MAPK extracellular-signal-regulated kinase 1/2 (ERK), on the other hand stress and cytokines the MAPKs (also called stress-activated protein kinases) p38 and c-Jun-N-terminal kinase (JNK)[4]. Binding to the extracellular matrix (ECM) can further stimulate MAPK activation.
Two candidates, which regulate the MAPK cascade, are focal adhesion kinase (FAK) and Ras. FAK gets autophosphorylated after the integrin-mediated attachment to the ECM within the formed focal adhesion complex. P-FAK can then activate ERK[5]. Ras is either linked to the focal adhesion complex – in other words cell anchorage to the matrix – or to growth factors. In both cases mobilization of Ras is dependent on the formation of a complex consisting of signaling molecules with Src homology 2 (SH2) domains, the adapter Grb2, and Son of Sevenless (SOS). Ras then stimulates the JNK and ERK pathways using different MAPKK/Ks[6]. Additionally, a BMP-Smad pathway has been described. After BMP binding to the BMP receptor, a phosphorylated complex of R-Smads (Smad 1, 5) and Co-Smad (Smad 4) translocates to the nucleus to promote as a cofactor the osteogenic transcription factors[7]. This pathway is linked to the MAPK cascade: BMP-2 can activate JNK, p38, and ERK, while BMP-9 stimulates osteogenesis in a p38- and inhibits it in an ERK-dependent manner[8]. ERK further enhances the transcriptional activity of Smads[9].
To get an insight in these signaling events, involved molecules are specifically blocked by inhibitors and the impact on osteogenic differentiation is studied afterwards. However, the obtained results are difficult to compare, since the external stimuli, applied inhibitor dose and cell types vary. Schindeler et al.[10] stated that the Ras-MAPK signaling is a source of great controversy. Nobody knows whether these discrepancies correlate with variations of the applied methods or are simply related to origin specific differences.
To our knowledge, the molecular osteogenic pathways of human adipose-derived stem cells (hASCs) have not been investigated so far. They undergo lineage commitment similar to MSCs from the bone marrow (bMSC). Due to the big advantage that hASCs are easier available with a higher cell density[11], they became an attractive cell source for stem cell research and regenerative medicine in the recent past. It is mandatory to analyze their differentiation progressions in order to utilize their full potential in translational fields.
Our aim was to identify the role of FAK and Ras-MAPK signaling by comparing hASCs of different donors under control, osteogenic, and dimethylsulfoxide (DMSO) solvent conditions. FAK was blocked via PF573228, Ras via FTS (farnesylthiosalicylic acid), JNK via SP600125, and ERK via U0126. We focused on signaling impacts on cell morphology, ECM production of fibronectin and collagen type I, BMP-2-Smad and ERK signaling, expression of Runx2 and osterix, and osteogenic markers (ALP activity, calcium mineralization, osteocalcin/osteopontin expression).
Materials and Methods
hASC donors and signaling inhibitors
Four different donors of hASCs were used for comparison. hASC I and II were purchased from Lonza (Basel, Switzerland) with the Lot numbers 0000399065 and 0000407088, respectively. hASC III and IV were established from two different anonym patients prepared by a working group of the Medical Highschool of Hannover, Germany. The isolation protocol can be found elsewhere[12]. Cells from passage 4-5 were used for the experiments.
Following final concentrations [μM] for each inhibitor were used: FAK (PF573228, Santa Cruz Biotechnology, Heidelberg, Germany) 10, Ras (FTS, Santa Cruz Biotechnology) 10, JNK (SP600125, Santa Cruz Biotechnology) 30, and ERK (U0126, Biomol, Hamburg, Germany) 20. Since it was prepared in dimethylsulfoxide (DMSO), DMSO with a concentration of 0.04 % v/v was applied as a solvent control. All the other chemicals were purchased from Sigma-Aldrich (Deisenhofen, Germany) unless otherwise noted.
Antibody sources and dilutions are listed in Supplementary Table 1.
Supplementary Table 1: List of antibodies used for immunostaining and western blotting.
| Antibody | Host | Company | Cat. No | Dilution Immunostaining | Dilution Western Blotting |
|---|---|---|---|---|---|
| BMP2 | rabbit | Proteintech | 18933-I-AP | 1:200 | 1:2000 |
| Collagen | mouse | Sigma/Aldrich | C2456 | 1:500 | |
| ERK 1/2 | rabbit | Cell Signaling | 4695 | 1:100 | |
| phospho ERK 1/2 | rabbit | Cell Signaling | 4370 | 1:200 | |
| FAK | rabbit | Cell Signaling | 3285 | 1:1000 | |
| phospho FAK | rabbit | Cell Signaling | 8556 | 1:1000 | |
| phospho FAK | rabbit | Sigma/Aldrich | F7926 | 1:700 | |
| Fibronectin | rabbit | Sigma/Aldrich | F3648 | 1:500 | 1:50000 |
| GAPDH-HRP | mouse | Sigma/Aldrich | G9295 | 1:50000 | |
| Osteocalcin | mouse | Santa Cruz | sc-74495 | 1:50 | |
| Osteopontin | rabbit | ABCAM | ab8448 | 1:400 | |
| Osterix (OSX) | rabbit | Santa Cruz | sc-133871 | 1:50 | |
| Osterix (OSX) | rabbit | Bioss | bs-111OR | 1:1000 | |
| RUNX2 | rabbit | Cell Signaling | 12556 | 1:1500 | 1:1000 |
| phospho RUNX2 | rabbit | Bioss | bs-5685R | 1:100 | |
| phospho SMAD 1/5/9 | rabbit | Cell Signaling | 9511 | 1:200 | 1:1000 |
| anti-mouse HRP | goat | Cell Signaling | 7074 | 1:2000 | |
| anti-rabbit HRP | goat | Cell Signaling | 7076 | 1:2000 | |
| anti-rabbit Alexa 488 | goat | Dianova | 111-545-144 | 1:400 | |
| anti-rabbit Alexa 555 | goat | Life Technologies | A21429 | 1:400 | |
| anti-mouse Alexa 488 | goat | Dianova | 115-545-146 | 1:400 | |
| anti-mouse HRP | goat | Dianova | 115-035-062 | 1:100 |
Cell culture
Control medium consisted of Dulbecco’s modified Eagle’s medium (Lonza, Basel, Switzerland) supplemented with 10 % foetal bovine serum (Biochrom AG, Berlin, Germany), 100 U/ml penicillin, and 100 μg/ml streptomycin. To induce osteogenic differentiation, the control medium was additionally supplemented with 0.1 μM dexamethasone, 10 mM β-glycerolphosphate, and 50 μM ascorbate-2-phosphate. The prepared solvent control and inhibitor solutions were separately added to the osteogenic culture media. The media were changed every third day.
Proliferation and ALP activity were quantified after 3, 7, 14, and 21 days cultivation time, calcium mineralization after 7, 14, and 21 days. For this purpose, 2 x 10⁴ cells of hASC I-IV were seeded out into 48-well plates, filled with 0.3 ml culture media (control, osteogenic, DMSO, and inhibitor solution). Immunostaining was performed with hASC I after three days. Staining of osteocalcin, osteopontin, and alizarin red was undertaken with hASC I after 21 days. For both staining procedures 2 x 10⁴ cells were seeded out. The detailed study design taking into account the culture conditions, cultivation times, and analysis can be found in Supplementary Figure 1.
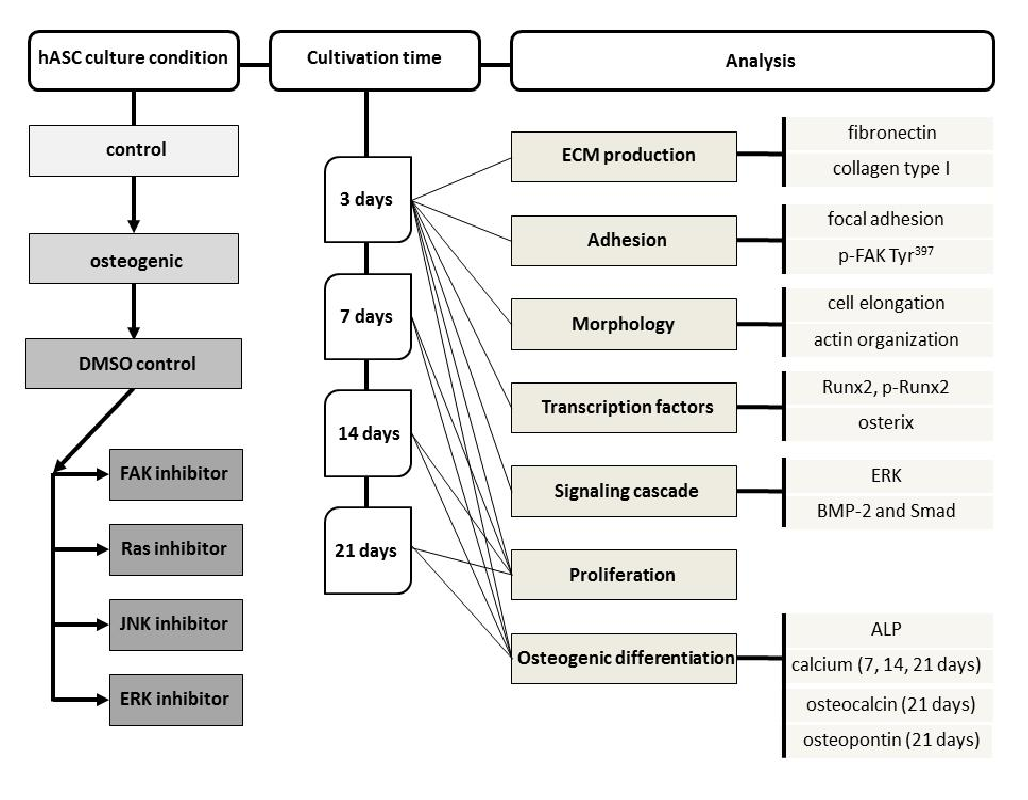
Supplementary Figure 1: Flow chart representing the study design.
Immunostaining
Via staining, inhibitor impacts on actin filaments, p-FAK Tyr397, ECM production (fibronectin, collagen type I), BMP-2-p-Smad-signaling, ERK, p-ERK, Runx2, p-Runx2, and osterix were analyzed. Immunofluorescence staining was performed by a two-step indirect method. Briefly, the cells were fixed in 4 % paraformaldehyde for 20 min and permeabilized with 0.3 % Triton X-100/phosphate buffer saline (PBS). To prevent nonspecific antibody binding, a 2 % bovine serum albumin/PBS solution was applied at 37°C for 2 h. After blocking, the cells were incubated with primary antibodies optimal diluted in 0.3 % Triton X-100/PBS overnight at 4°C. After several washing steps, the cells were incubated with a fluorescence-conjugated secondary antibody at an appropriate dilution (Alexa Fluor® 488 conjugated Goat anti-rabbit IgG (H+L)/(Alexa Fluor® 555 conjugated Goat anti-rabbit IgG (H+L), Dianova, Hamburg, Germany; Alexa Fluor® 488 conjugated Goat anti-mouse IgG (H+L), Life Technologies) for 1 h at 37°C. Cell nuclei were stained with Hoechst 33342. Actin filaments were stained with phalloidin-Atto 550 for 20 min. Finally, the samples were washed three times and stored in PBS before imaging using confocal microscope (Nikon Eclipse TE 2000-E, Nikon, Düsseldorf, Germany). The images were taken with the same picture recordings.
Immunoperoxidase staining for osteocalcin and osteopontin was performed by a two-step indirect method, as stated above for the immunofluorescence staining. Briefly, a horseradish peroxidase-conjugated Goat anti-mouse IgG (H+L)/Goat anti-rabbit IgG (H+L) secondary antibody (Dianova) was incubated for at 37°C for 1 h. After several washing steps, immunostaining with peroxidase was developed by incubation with 3-amino-9-ethyl-carbazole substrate in sodium acetate buffer (0.1 mol/l, pH 5.2) containing hydrogen peroxide. Calcium deposits were detected by staining with 2 % alizarin red S (pH 4.2). The samples were analyzed by microscopy using an AxioImager A1.m microscope (Carl Zeiss, Oberkochen, Germany) equipped with AxioCam ICc1 camera and AxioVision Rel. 4.8 software.
Quantification of immunostaining With the help of Image J software (http://rsbweb.nih.gov/ij/) cell elongation and fluorescence intensity of the immunofluorescence staining were quantified, following the description in[13]. Shortly, a straight line was placed on each cell body lengthwise and breadthwise and measured automatically. The quotient of length and width enabled calculation of cell elongation. For Runx2, osterix, and p-Smad 1/5/8 a rectangle of 2.5 x 103 pixel was placed on the nuclei, for the other staining a rectangle of 10 x 103 pixel was placed on the entire cell body. Thereafter, the single RGB colour channels were estimated and given as mean after subtracting the background single of the corresponding rectangle size for each image. Per treatment 50 cells for cell elongation and 100 cells for relative fluorescence intensity studies were analyzed.
Proliferation and quantification of osteogenic differentiation
After washing with PBS, cell lyses were obtained with 1 % Triton X-100 solved in PBS. After centrifugation at 12000 g for 10 min the supernatants were used to quantify the cell density via lactat dehydrogenase assay (LDH) and ALP activity, whereas the pellet and bottom of the well plate were utilized to estimate calcium. All values were quantified at defined absorbance wavelength using a microplate reader (Tecan Infinitive M200Pro and Tecan i-controlTM software, Crailsheim, Germany).
After subtracting the blank, the osteogenic markers were correlated with standard curves, and normalized on the LDH-estimated cell number. The results were obtained of three independent measurements and given as average ± SEM. Following the online protocol of OPS Diagnostics (Lebanon, USA), LDH activity was detected at 492 nm. The measured LDH activity was correlated with the cell number from a cell standard curve prepared under the same conditions. The cell density was given as cell number/cm².
Measuring ALP at 405 nm wavelength, the activity was correlated with a standard curve prepared from p-nitrophenol (10 mmol/L) dilutions and given as nmol of p-nitrophenol/min/cm². The amount of calcium was raised from the cell lysis pellet and bottom of the corresponding well plate, which obtained values were summated in the end. Both were extracted in 0.5 N HCl at 4°C overnight. Accordingly to the manufacturer’s instructions (liquicolor assays, Human Diagnostics, Wiesbaden,Germany), calcium was measured at 570 nm wavelength. The total calcium content was calculated from a standard curve prepared in parallel from a stocking solution of 8 mg/dL calcium. The results were expressed as μg/cm².
Ethical declaration
ASC I and II were purchased from Lonza (Basel, Switzerland). The certificate of analysis reveals that ASC I with the Lot number 0000399065 were checked on 08-Feb-2014; ASC II with the Lot number 0000407088 on 25-Mar-2014, respectively. ASC III and IV were received from a working group of Hannover Medical High school. The Ethic Committee of the Medical High school did not specifically approve this study. According to the requirements (https://www.mh-hannover.de/index.php?id=16578&L=1 ) no permit on endogenous materials is necessary as long as the data are anonymized and no conclusion to the corresponding patients can be made. The cells were prepared from de-identified human adipose tissue after elective plastic surgery. Patients written informed consent for their tissue used for research purposes were obtained.
Statistical analysis
Proliferation and quantification of osteogenic differentiation were obtained from three independent measurements. The results for cell elongation given as cell quotient were obtained from 50 cells per treatment; the results for the fluorescence intensities were raised from 100 cells per treatment. Generally, the results were given as average ± SEM. These data were calculated with Microsoft Excel 2010 software. Additional statistical analysis and diagram preparation were performed with the software Origin 9.1G. To analyze statistical differences between the osteogenic and other culture conditions, an unpaired two-sample Student’s-t-test was applied with significant levels of p < 0.05 (*), p < 0.01 (**), and p < 0.001 (***).
Results
Influence on cell morphology and focal adhesion formation
Cell elongation was quantified via the cell quotient (Figure 1 B). The bigger the ratio, the more elongated were the cells[13]. Application of Ras, FAK, and ERK inhibitors did not change cell elongation in comparison to the osteogenic treatment. Under control, DMSO, and JNK inhibitor conditions the cell ratios were significantly larger. The highest elongation occurred with the JNK inhibitor.
Staining of actin filaments revealed that except for the FAK inhibitor all treatments resulted in a well-organized actin cytoskeleton with defined stress fibers. For FAK, actin was not normally formed within the cell body. (Figure 1 A) p-FAK Tyr397 was co-localized at the end of the stress fibers indicating well established focal adhesions according to integrin anchorage to the surface (Figure 1 A). Only the FAK inhibitor resulted in not well-defined stained dots. Shown in (Figure 1 C), quantification of p-FAK did not demonstrate differences between the control, osteogenic, and ERK-inhibition treatments. DMSO and Ras inhibitor caused a significant increase, JNK and especially the FAK inhibitors a significant reduction of p-FAK compared to the osteogenic setup.
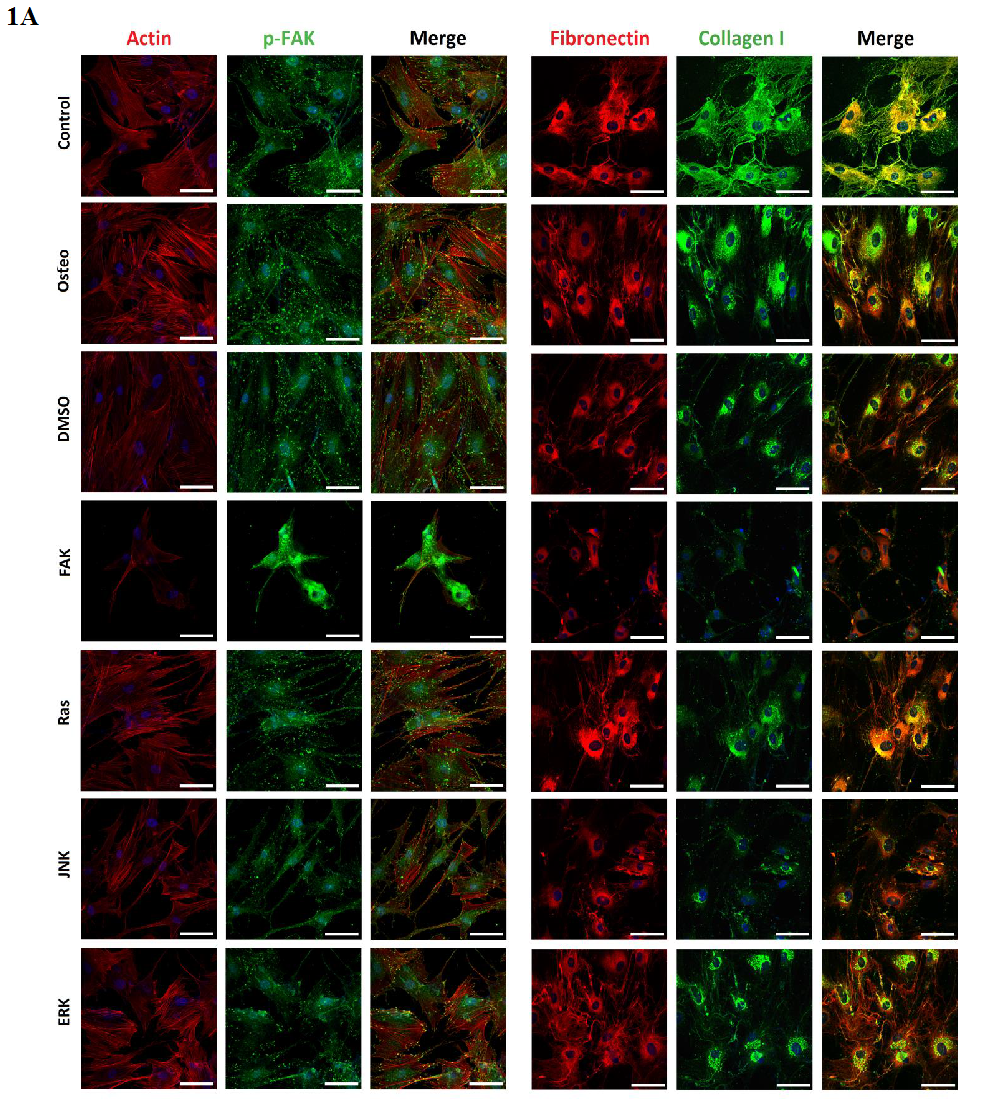
Figure 1A:
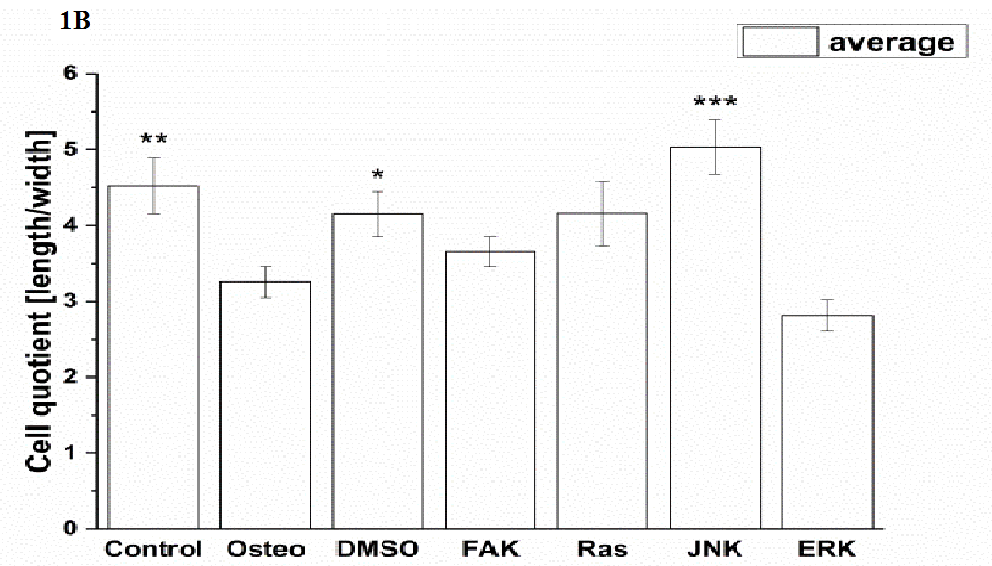
Figure 1B:
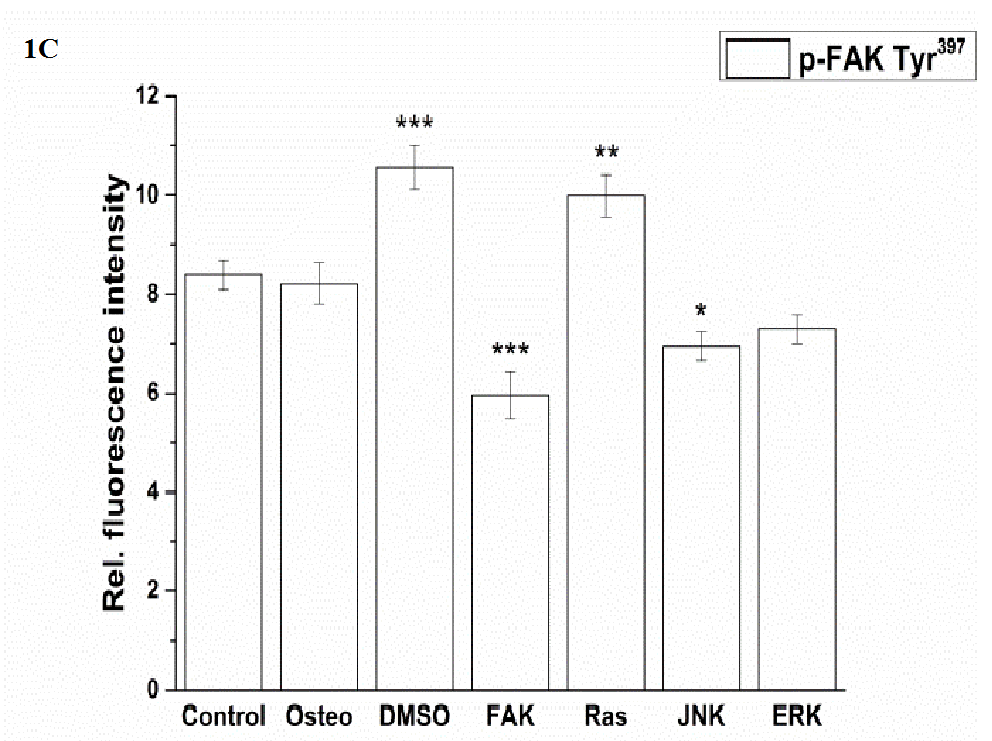
Figure 1C:
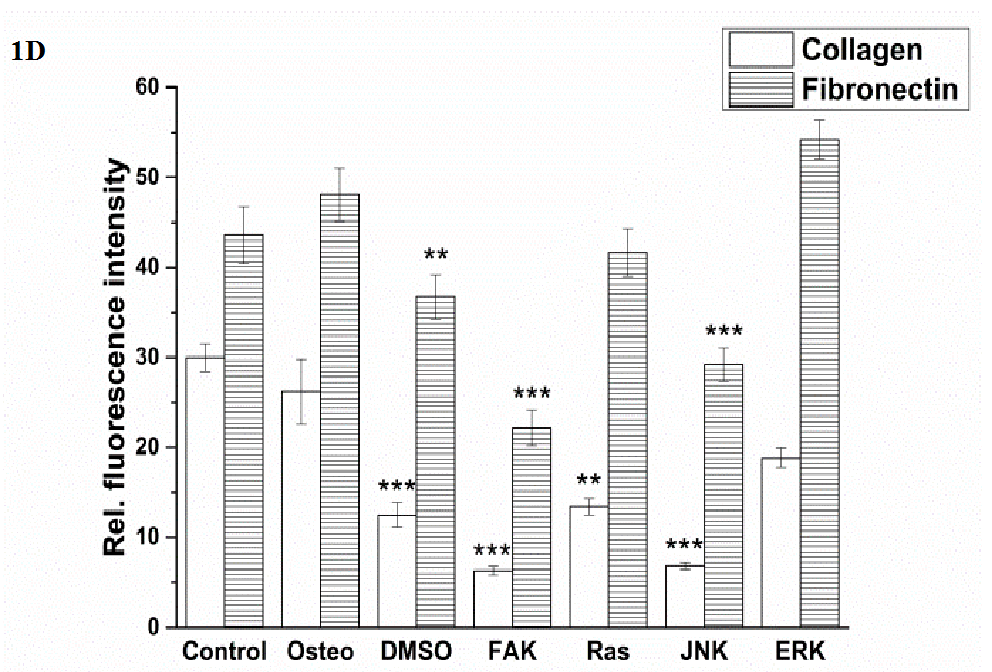
Figure 1D:
Figure 1: Analysis of morphology, focal adhesion complex, and ECM production after three days cultivation time: (A) fluorescence images of actin filaments (red), p-FAK Tyr397 (green), fibronectin (red), collagen type I (green), nuclei (blue); with scale bars = 50 μm. (B) Quantification of cell elongation given as the cell quotient of 50 cells per treatment; (C) of p-FAK Tyr397, (D) extent of fibronectin and collagen type I of 100 cells per treatment. The results are given as average ± SEM. Student’s-t-test was applied with p < 0.05 (*), p < 0.01 (**), p < 0.001 (***) to quantify significant differences between the osteogenic and other treatment conditions.
Impact on ECM production
For this purpose, fibronectin and collagen type I were stained (Figure 1 A) and quantified (Figure 1 D). Control cells located fibronectin within the cell periphery around the nuclei, whereas collagen could also be detected within the cellular extensions. For all the other treatments this observation was opposite. Generally, the amount of fibronectin was higher than of collagen. Concerning fibronectin, no significant differences occurred between the osteogenic, control, Ras and ERK inhibitor conditions, even though the value for ERK was slightly higher. The presence of DMSO, FAK, and JNK inhibitors significantly reduced the amount. It was the lowest after FAK inhibitor application (Figure 1 D)
Under control conditions hASCs formed the highest extent of collagen, but not significantly. It was followed by osteogenic and ERK inhibitor, which was slightly but also not significantly reduced. A significant reduction of collagen occurred after DMSO, Ras, FAK, and JNK inhibitor treatments. The lowest values were detected in the presence of FAK and JNK inhibitors.
Changes in BMP-2, p-SMAD 1/5/8, ERK, and p-ERK expressions
BMP-2 and ERK were located over the entire cell bodies, while p-Smad was present within the nuclei. P-ERK was found nearby and within the nuclei (Figure 2 A).
JNK and especially FAK inhibitors significantly reduced the amount of BMP-2, while the values of all other treatments were comparable (Figure 2 B). With respect to p-Smad expression, no differences between the osteogenic, DMSO, and FAK inhibitor condition occurred (Figure 2 C). Under control, Ras, JNK, and ERK inhibitor conditions p-Smad was significantly reduced. The highest reduction occurred in the presence of JNK and under control conditions.
Generally, the expression of ERK was higher than of p-ERK (Figure 2 D). In comparison to the osteogenic culture condition, all the other treatments caused significant differences in ERK expression: the control, DMSO, FAK, and JNK inhibitor reduced it, Ras and ERK inhibitor increased it. The lowest values were found for FAK and JNK inhibitors. P-ERK was significantly reduced by all treatments, less for the control, but stronger and similar for the others, when compared with the osteogenic setup.
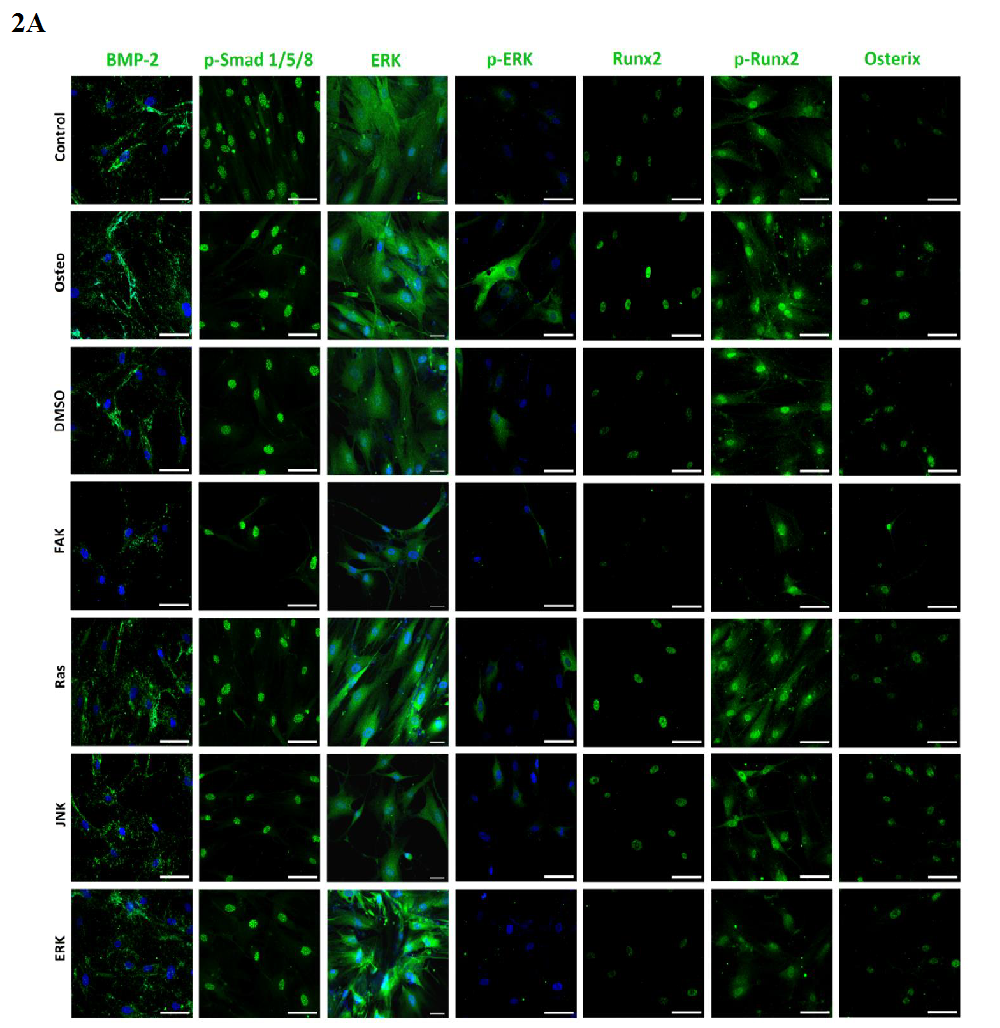
Figure 2A:
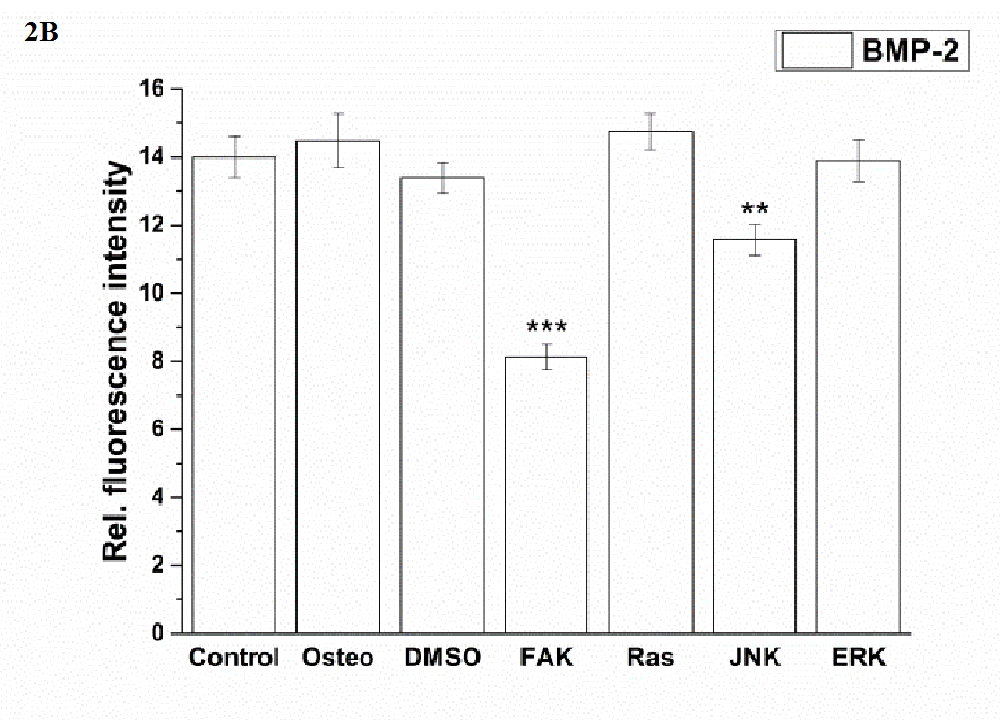
Figure 2B:
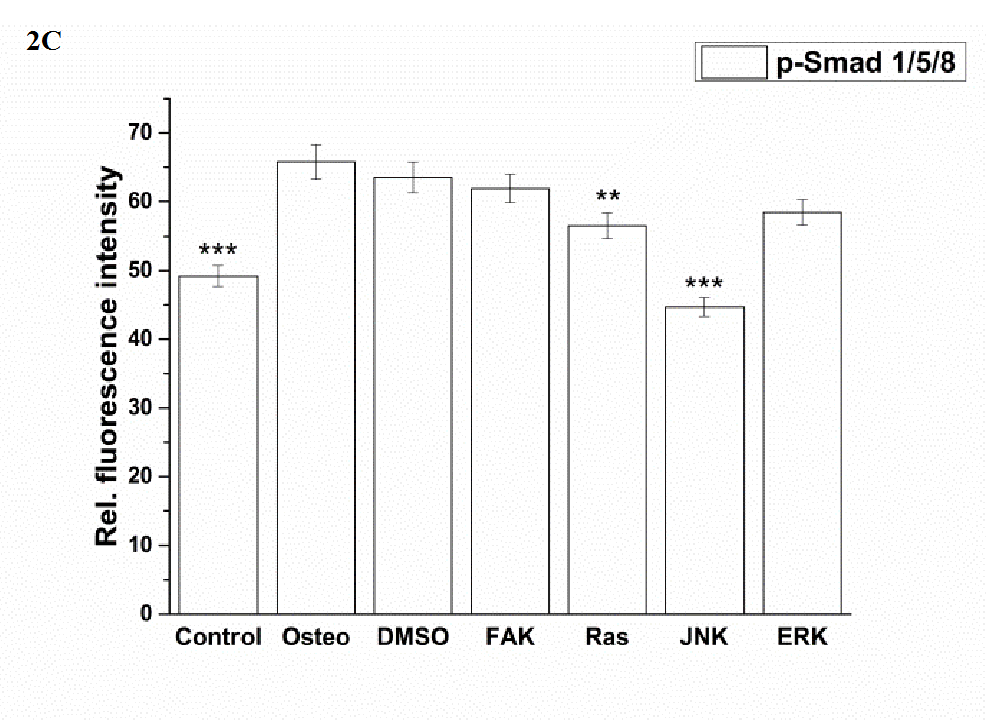
Figure 2C:
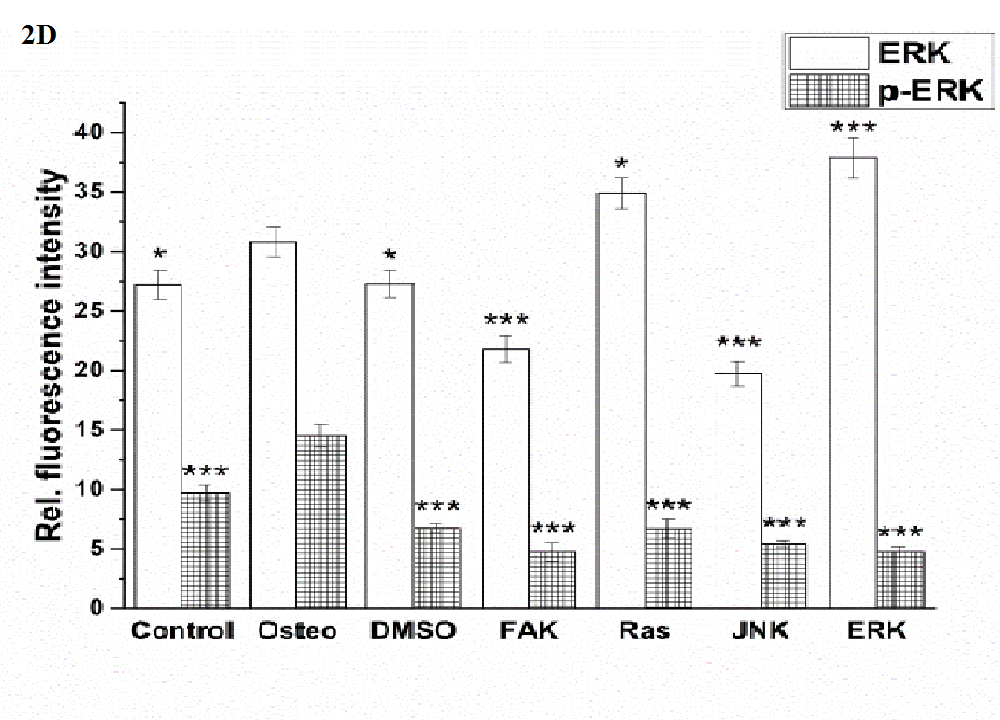
Figure 2D:
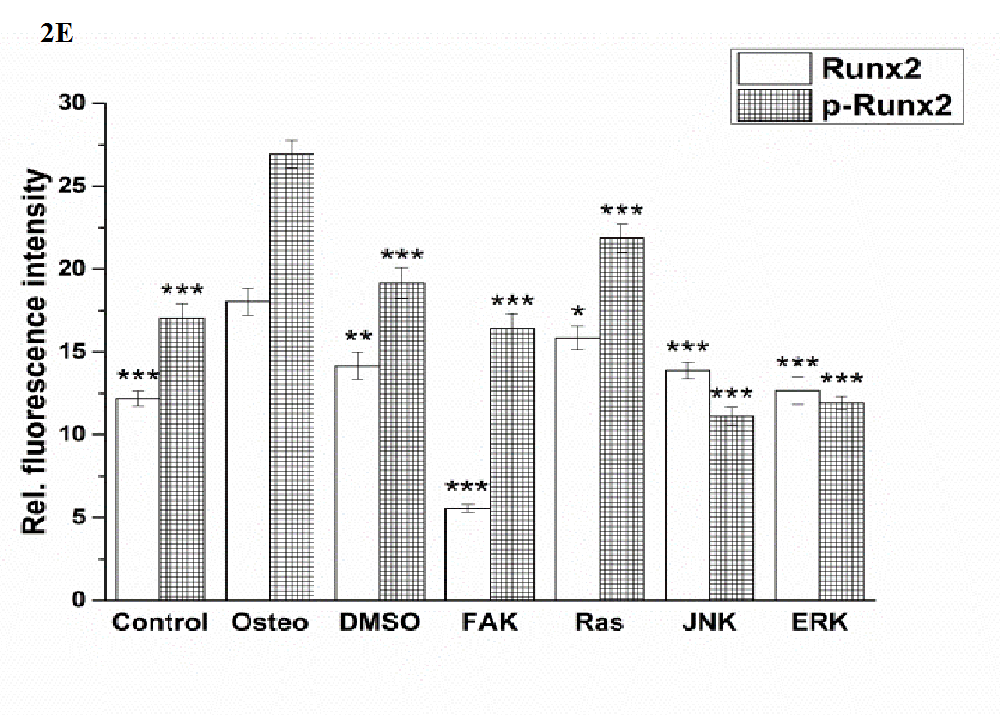
Figure 2E:
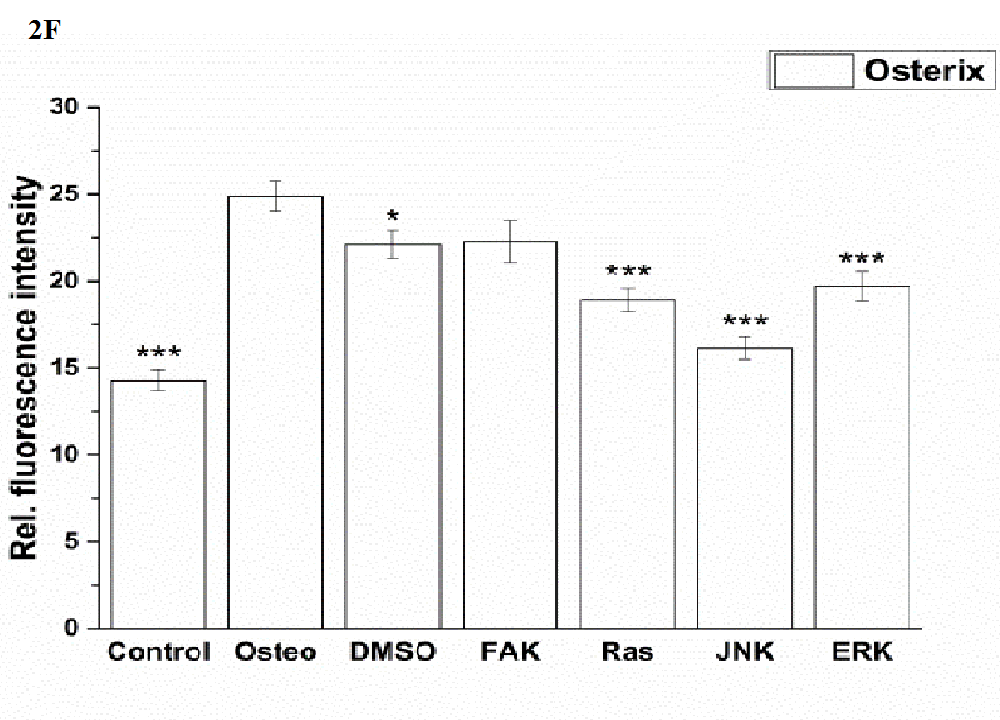
Figure 2F:
Figure 2: Analysis of the signaling cascades and transcription factors after three days cultivation time: (A) fluorescence images of BMP-2, p-Smad 1/5/8, ERK, p-ERK, Runx 2, p-Runx2, osterix (all stained in green), and nuclei (blue) with scale bars = 50 μm; (B-F) quantification of the fluorescence intensities obtained from 100 cells per treatment, given as average ± SEM. (B) BMP-2, (C) p-Smad, (D) ERK and p-ERK, (E) Runx2 and p-Runx2, (F) osterix. Student’s-t-test was applied with p < 0.05 (*), p < 0.01 (**), p < 0.001 (***) to quantify significant differences between the osteogenic and other treatment conditions.
Impact on the transcription factors Runx2, p-Runx2, and osterix
Runx2 and osterix were located within the nuclei, while p-Runx 2 was further presented nearby (Figure 2 A). Only for the ERK inhibitor it was found that the amount of Runx2 and p-Runx2 was almost identical; for the other investigations p-ERK was higher expressed than ERK (Figure 2 D and E). All treatments significantly reduced the amount of Runx2, especially FAK inhibitor, when compared with the osteogenic treatment. This was also the case for p-ERK, but here the lowest values were detected for the JNK and ERK inhibitors.
Shown in (Figure 2 F), no significant differences between of the osterix expression between the osteogenic culture and FAK inhibitor could be measured. The other treatments reduced osterix significantly. The lowest values were obtained under control and JNK inhibitor conditions.
Analysis of cell proliferation
Cell proliferation was estimated via LDH and compared between hASC I-IV (Figure 3). Even though all experiments were started with the same cell density, variations in the achieved cell number were obtained. The highest proliferative activity was reached by hASC II up to 1.4 x 10⁵ cells/cm² (Figure 3 B), while it was comparable between the other origins up to 8 x 10⁴ cells/cm².
Independently from the cell donor, under control, osteogenic, DMSO, Ras, and ERK inhibitor an increase in the cell number was observed. In this connection, significant differences were obtained. The presence of DMSO and Ras inhibitor significantly increased proliferation of hASC III and IV at different time points when compared with the osteogenic setup (Figure 3 C and D). But it was significantly reduced by Ras inhibitor of hASC I and II after 14 and three days, respectively (Figure 3 A and B). DMSO also caused a significant reduction of hASC II after three days. Under control conditions, hASC II proliferated significantly less after 14 and 21 days, the other hASC origins significantly more at different time points, but not at all time points. The ERK inhibitor, which enabled cell growth generally, caused a significant reduction of the cell densities in comparison to the osteogenic treatment. For hASC III after 14 days, for hASC I after seven and 14 days, for hASC IV after 14 and 21 days, and for hASC II at all four measured time points. Comparing the inhibitors Ras with ERK, the growth curve looked similar for hASCs I, III and IV (independently from the significant differences when compared with the osteogenic culture condition). hASC II, however, proliferated a lot better in the presence of Ras inhibitor than in the presence of ERK inhibitor.
Independently from the hASC donors, the inhibitors FAK and JNK did not enable cell proliferation at all. Therefore, the here achieved cell densities were significantly lower at all time points. Concerning JNK the seeded cell density of 4x10⁴ cells was divided in half (hASC I) or less and kept then constant over the entire cultivation time. For FAK this was different. Here, the cell density was continuously reduced from measured day to day.
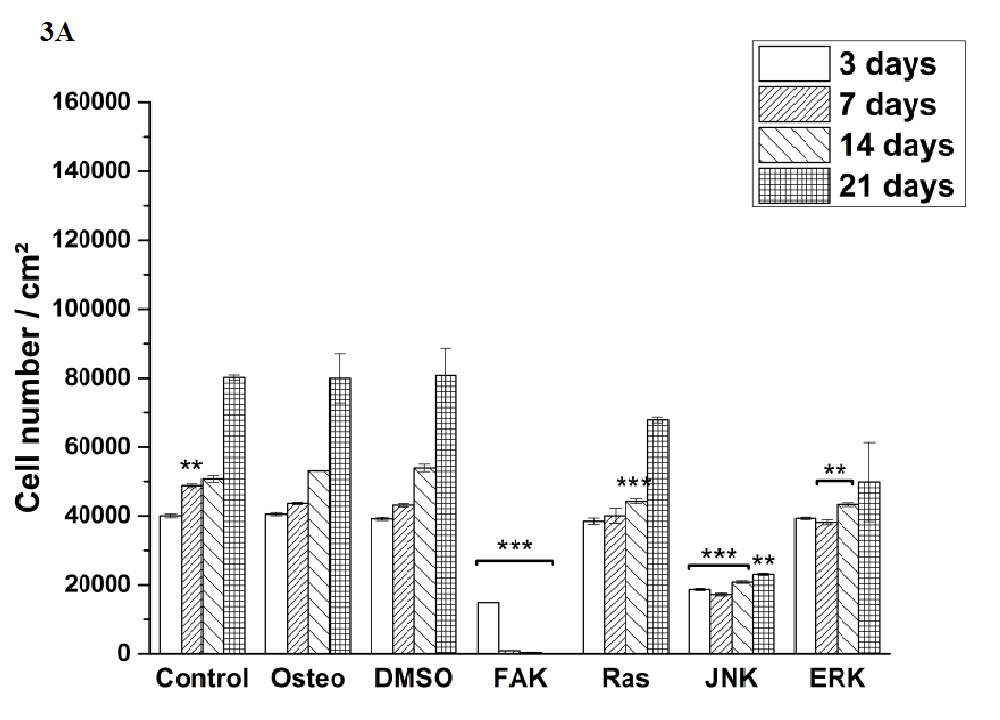
Figure 3A:
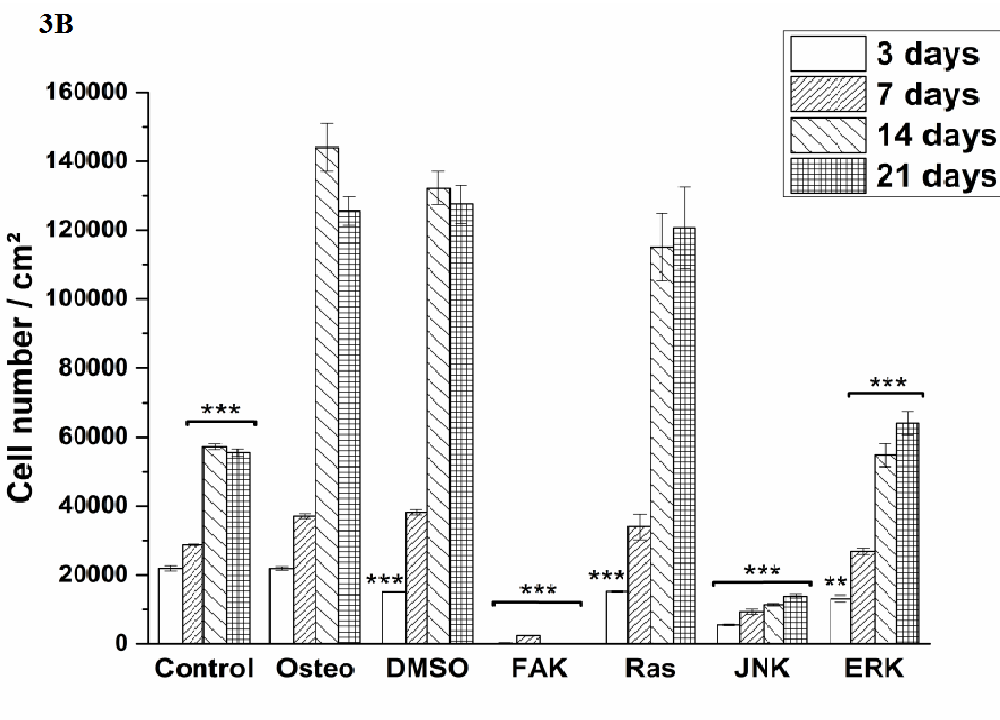
Figure 3B:
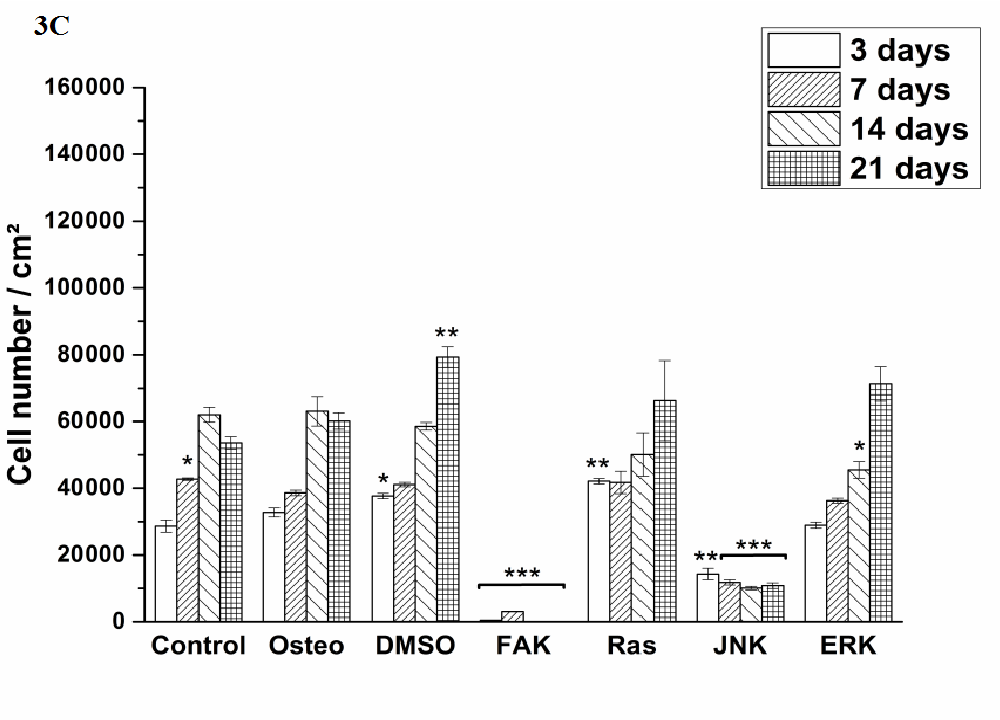
Figure 3C:
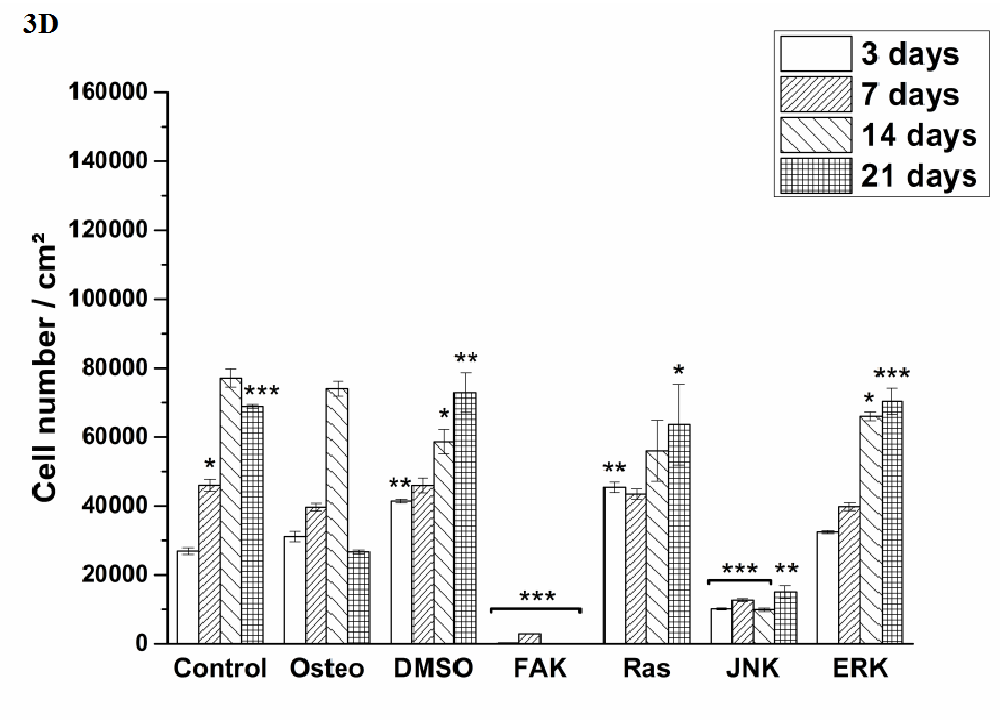
Figure 3D:
Figure 3: Quantification of cell proliferation via LDH assay. The results are expressed as average [cell number /cm²] ± SEM obtained from three measurements. (A) hASC I, (B) hASC II, (C) hASC III, (D) hASC IV. Student’s-t-test was applied with p < 0.05 (*), p < 0.01 (**), p < 0.001 (***) to quantify significant differences between the osteogenic and other treatment conditions.
Influence on osteogenic differentiation
Osteogenic differentiation was characterized via the markers ALP activity (Figure 4) and calcium mineralization (Figure 5) with respect to hASCs I-IV. For a better comparison between the treatments, the results were normalized on the surface area [cm²] (Figure 3). Additionally, staining of alizarin red for calcium detection, osteocalcin, and osteopontin were performed with hASC I after 21 days cultivation time (Figure 6). Generally, the highest extent of ALP activity and calcium mineralization was achieved by hASC II. Then it followed the order hASC I > hASC IV > hASC III. Under control, FAK, and JNK inhibitor conditions, both osteogenic markers were not evidently produced. The only exception referred to the detectable ALP activity of hASC I (Figure 4 A), but significantly less than under the osteogenic conditions.
Typical of ALP activity is an increase up to a maximum followed by a decrease. For hASC I, III, and IV his maximum occurred after 14 days, for hASC II after 21 days. Regardless the results of the control, FAK, and JNK inhibitor conditions, the other treatments followed this observation. But two exceptions were measured: DMSO of hASC III (Figure 4 C) presented this maximum after 21 days; the Ras inhibitor of hASC I (Figure 4 A) already after seven days. Here, the ALP activities were significantly higher when compared with the osteogenic setup.
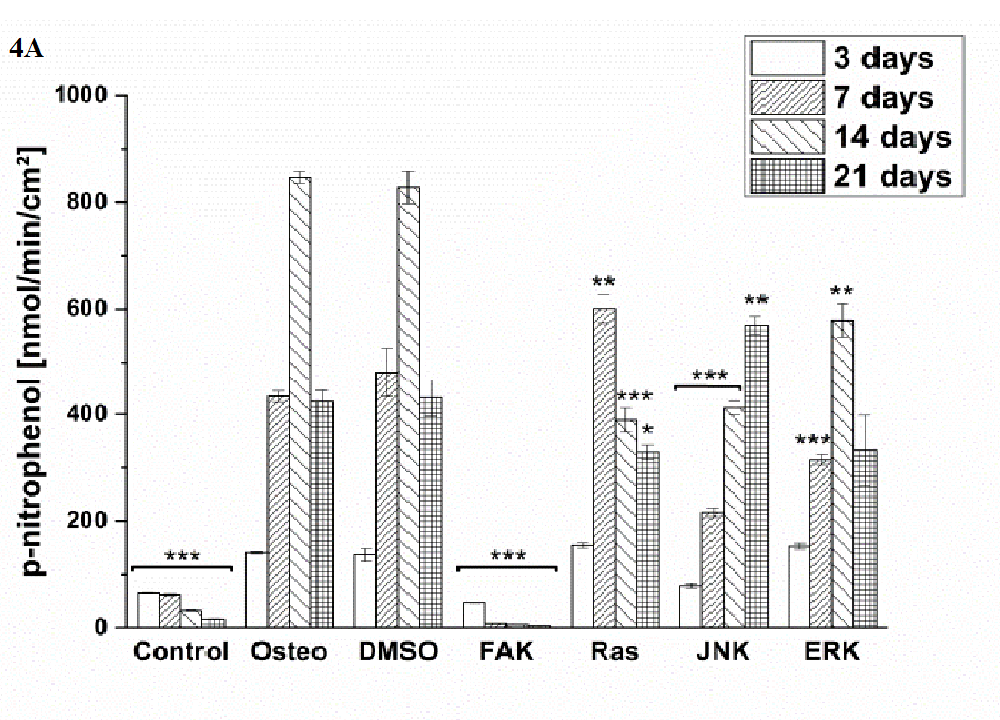
Figure 4A:
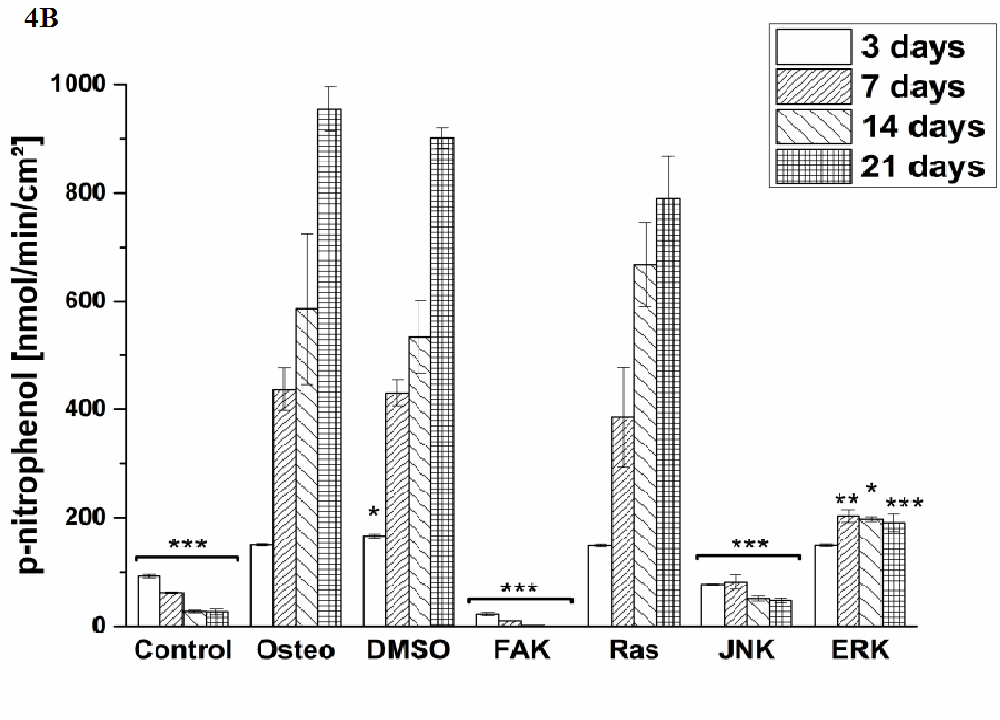
Figure 4B:
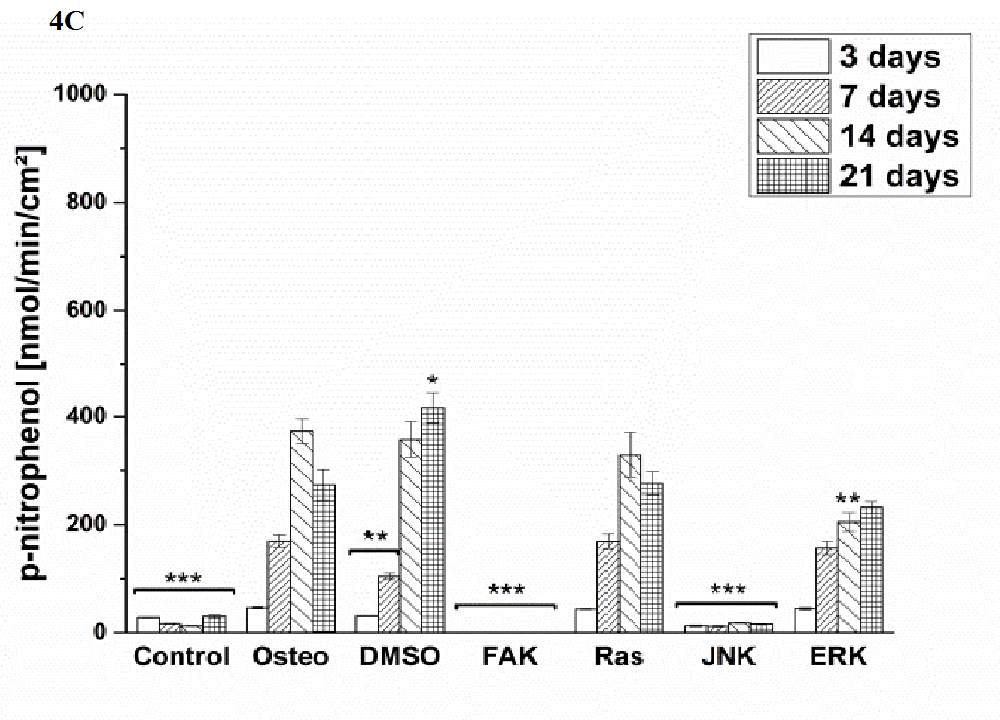
Figure 4C:
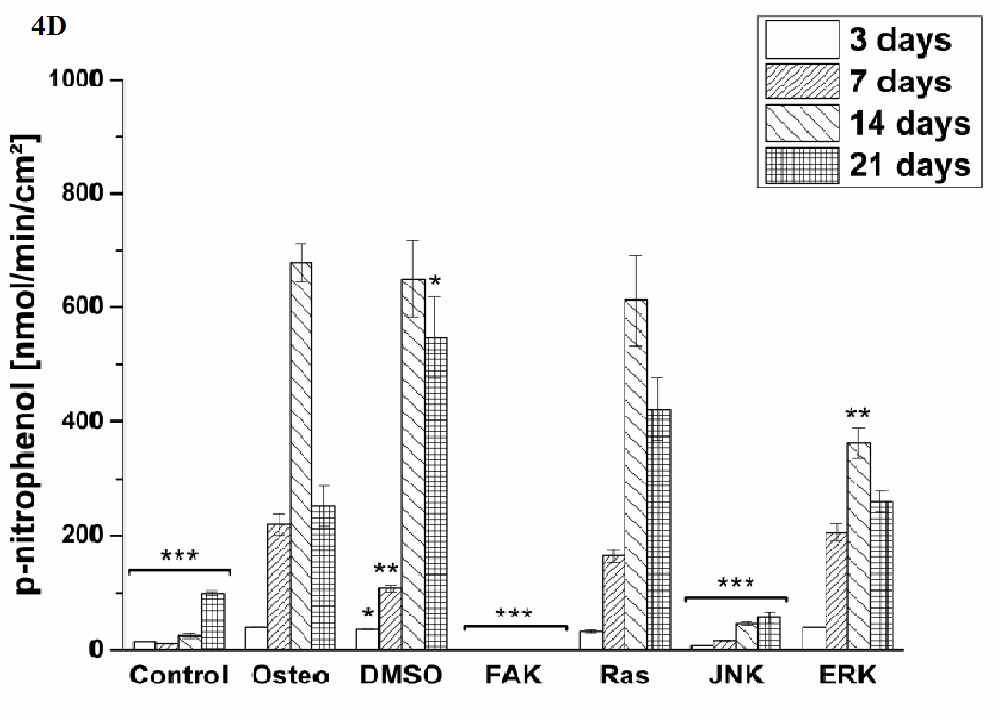
Figure 4D:
Figure 4: Quantification of ALP activity. The results are given as p-nitrophenol/min/cm² ± SEM obtained from three measurements. (A) hASC I, (B) hASC II, (C) hASC III, (D) hASC IV. Student’s-t-test was applied with p < 0.05 (*), p < 0.01 (**), p < 0.001 (***) to quantify significant differences between the osteogenic and other treatment conditions.
Generally, the trend of ALP activity was similar between DMSO and osteogenic conditions. Significantly less ALP could be detected for DMSO after three and seven days hASC III, IV, (Figure 4 C and D), significantly more after three days for hASC II (Figure 4 B). Concerning Ras inhibitor, no significant differences were demonstrated for hASC II-IV with respect to the osteogenic treatment. As mentioned, hASC I switched their ALP maximum forward, afterwards, the values were significantly smaller (Figure 4 A). In addition with the ERK inhibitor, the ALP activity of hASC I and IV followed the same trend like the osteogenic setup. However, it was significantly reduced after seven and 14 days (hASC I), and after 14 days, respectively (hASC IV). Last occurred for hASC III as well; with the disparity that the ERK inhibitor further increased the ALP activity after 21 days. In this connection, however, the value was comparable with the osteogenic treatment. For hASC II it was found that the ERK inhibitor did not cause a maximum of ALP activity. The value was constant and thereby, significantly reduced after seven, 14, and 21 days (Figure 4 C). Calcium mineralization started after 14 days in culture, while the highest extent was obtained after 21 days (Figure 5). Comparing with the osteogenic setup, the results for DMSO and Ras treatments were similar. Two significant decreases in the presence of DMSO occurred: after 21 days for hASC III, after 14 days for hASC II. The Ras inhibitor caused a significant increase in calcium mineralization after 14 days (hASC I, Figure 5 A). The ERK inhibitor significantly reduced it for all hASC donors and time points, except for hASC IV after 21 days (Figure 5 D). Alizarin red staining of calcium confirmed these results (Figure 6). No staining was visible under control, FAK, and JNK inhibitor conditions; the extent was higher in the presence of ERK inhibitor, but the highest after Ras inhibitor, DMSO, and osteogenic treatments.
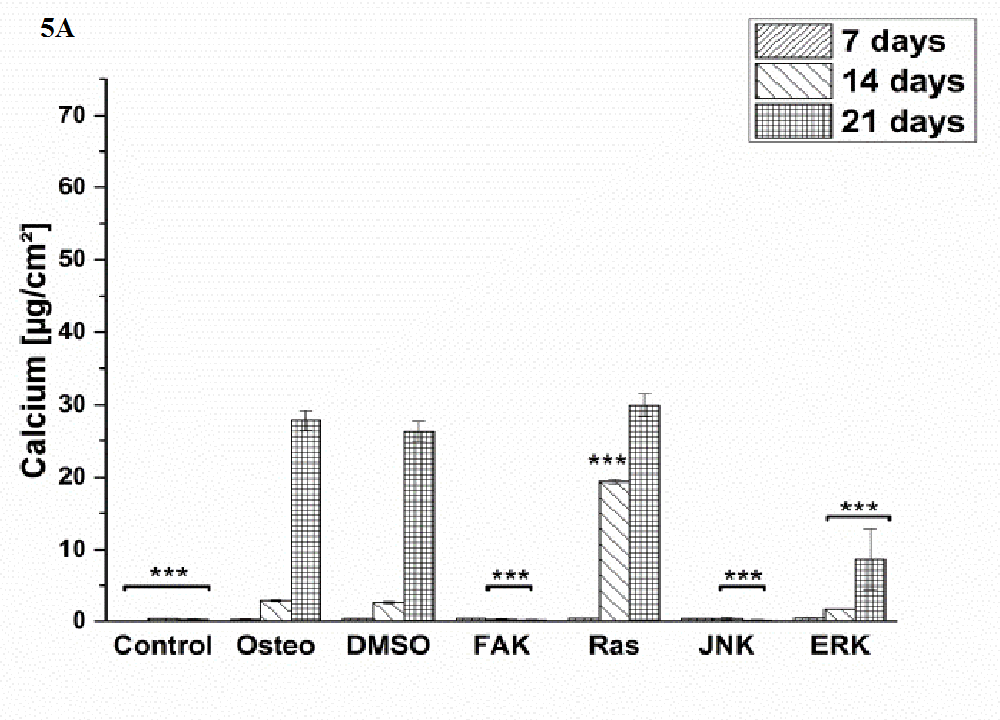
Figure 5A:
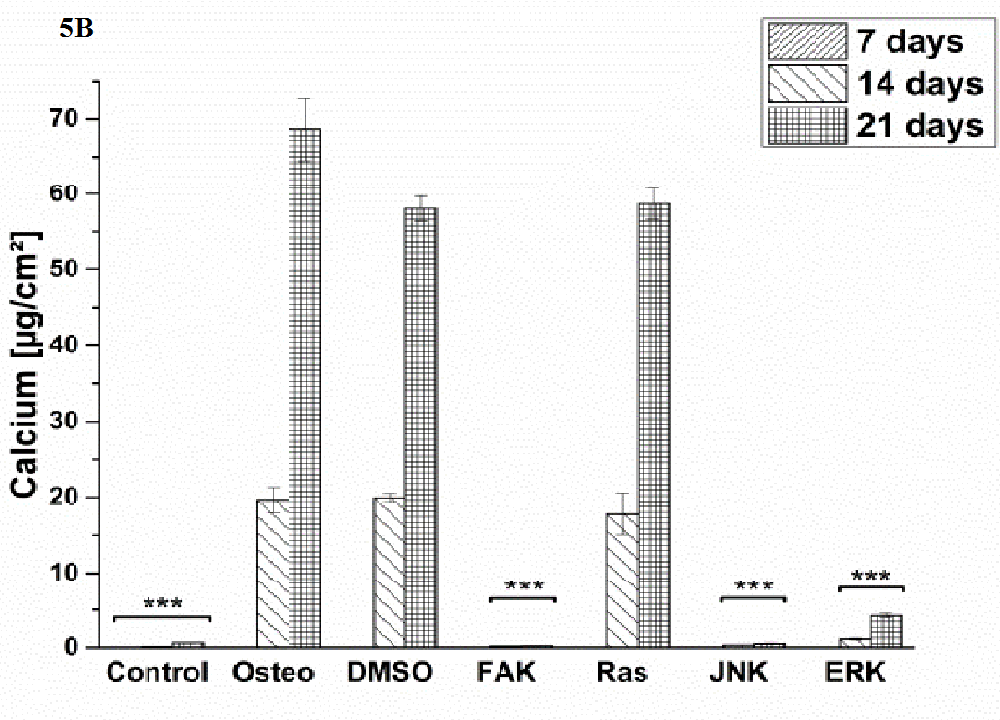
Figure 5B:
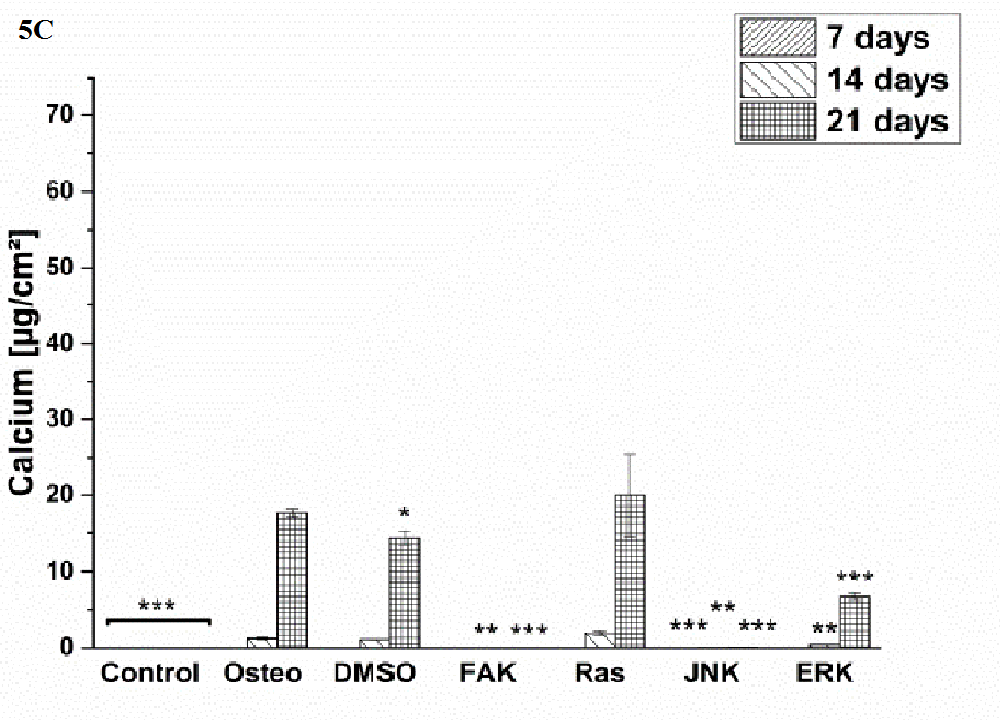
Figure 5C:
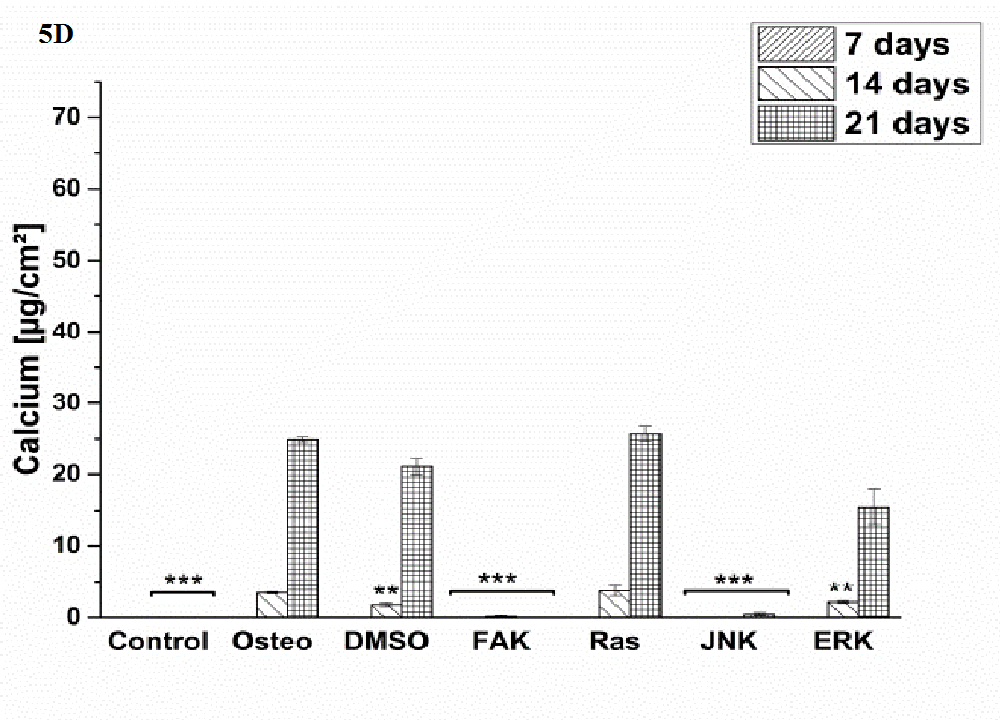
Figure 5D:
Figure 5: Quantification of calcium mineralization in [μg/cm²] as average ± SEM obtained from three measurements. (A) hASC I, (B) hASC II, (C) hASC III, (D) hASC IV. Student’s-t-test was applied with p < 0.05 (*), p < 0.01 (**), p < 0.001 (***) to quantify significant differences between the osteogenic and other treatment conditions.
Furthermore, (Figure 6) demonstrates the results of osteocalcin and osteopontin staining. Both markers were not presented over the entire surface under control, JNK, and FAK inhibitor conditions. However, single cells showed a high degree of both markers after treatment with FAK inhibitor. The ERK inhibitor and DMSO solvent did not negatively affect both markers; but the extent looked slightly less when compared with the Ras inhibitor and osteogenic setup.
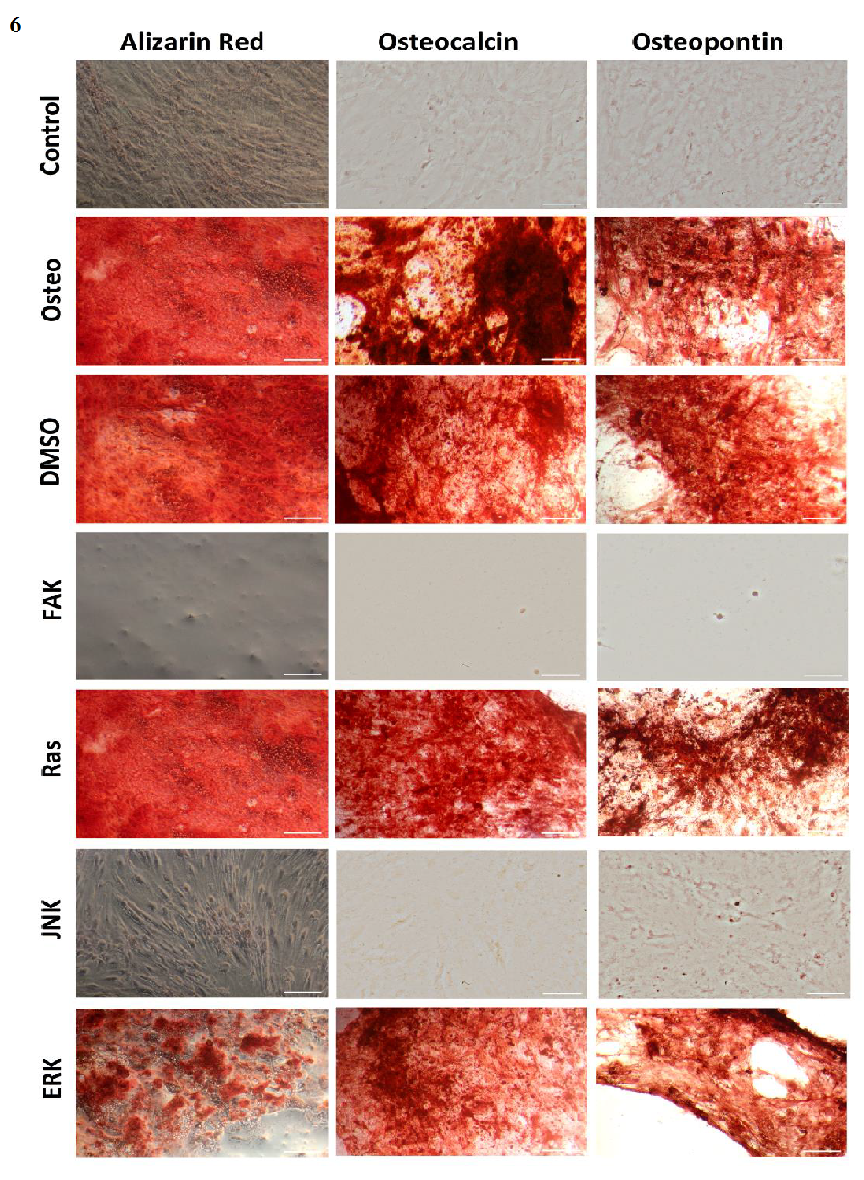
Figure 6: Staining images of alizarin red, osteocalcin, and osteopontin after 21 days cultivation time. Scale bars = 100 μm
Discussion
The capabilities of self-renewal and multilineage differentiations make MSCs very attractive for applications in stem cell research and regenerative medicine. These cells are isolated from various adult tissues; basically, cells from the bone marrow (bMSC) are used. Beside the morbidity risk for the donor, the main drawback of isolated bMSC population refers to the low number of progenitor cells. Additionally, phenotypically different cells of the isolated heterogeneous population have to be purified; otherwise self-renewal and differentiation will decline. Therefore, new MSC sources are emerging. Among these sources, hASCs are the most promising ones in terms of the abundant supply after routine liposuction, immunosuppressive properties, and differentiation efficiency. Their osteogenic differentiation potential has been documented in vitro and in vivo[11].
In this connection, the osteogenic molecular pathways of hASCs are poorly understood. To give an insight was the aim of this study. Even though many efforts have been undertaken in this direction with other cell origins, nobody knows whether obtained discrepancies in the pathway arise from variations in the applied methods or are cell specific[10]. Therefore, this study was performed with hASCs of four different donors and different methods were used for comparison. The study design can be found in Supplementary Figure 1.
MAPK signaling and BMP-Smad pathways were both shown to play a role in osteogenesis[7,10]. Both result in activation of the transcription factors Runx2 and osterix, followed by the expression of diverse osteogenic markers[2]. Here, we focused on the impact of the MAPKs ERK and JNK, additionally the importance of cell attachment and growth factor stimulation in dependence of Ras-MAPK signaling. Beside osteogenic differentiation, we analyzed influences on cell morphology, focal adhesion formation, ECM production, and BMP-2-Smad and ERK signaling. The study was carried out by blocking FAK, Ras, JNK, and ERK with specific inhibitors (via PF573228, FTS, SP600125, and U0126, respectively), whose blocking capacities have been well documented elsewhere[4,14-16]. Without osteogenic cell culture medium, hASCs proliferated but did not undergo osteogenic differentiation (Figure 4-6). Except for BMP-2, control hASCs further reduced significantly the expression of p-Smad 1/5/8, ERK, p-ERK, Runx2, p-Runx2, and osterix (Figure 2). Therefore, the inhibitor solutions were only added to the osteogenic medium. As shown in the Supplementary Information, all applied inhibitor concentrations were not cytotoxic (Supplementary Figure 2). The solvent DMSO had no remarkable effect on proliferation and the osteogenic markers (Figure 3 - 6).
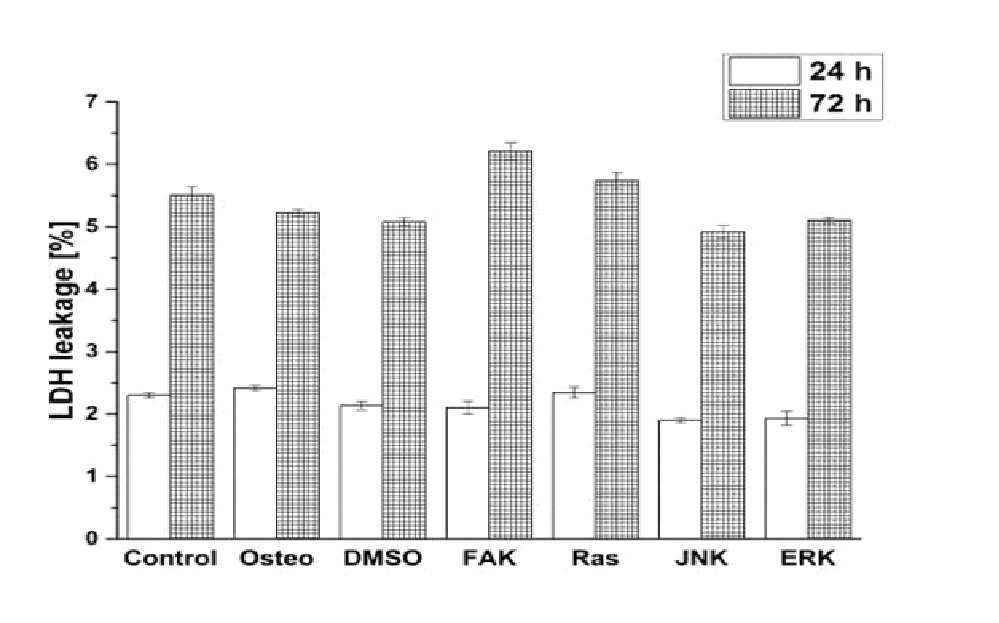
Supplementary Figure 2: Analysis of cytotoxicity via LDH leackage. The results were normalized on the positive control and given as average ± SEM.
The proliferative activity of hASCs was shown to be dependent on the donors’ age[11]. Indeed, the extent of the investigated parameters proliferation, ALP activity, and calcium mineralization varied with the hASC donor (Figure 3 - 5). This finding confirms that discrepancies cannot only be obtained by different cell types[10]; they are further a question of the cell donor. Unfortunately, since our used cell donors were received from anonym patients, we cannot dispose a correlation to the age or gender
Independently from the hASC donor, the same tendency for each inhibitor was obtained. FAK and JNK inhibitor caused a cell cycle arrest, while ERK inhibitor reduced proliferation, and Ras inhibitor did not negatively affect it in comparison to the osteogenic treatment (Figure 3). The observed effects by FAK, JNK, and ERK on proliferation confirmed the results of other studies[14,17]. Other studies reported that inactivated Ras also inhibited cell growth[15]; but especially the role of Ras seems to be very contradictory[10].
The formation of the ECM is necessary for following calcium mineralization during osteogenesis. Expect for ERK inhibitor all other treatments reduced the extent of collagen type I after three days in culture, while fibronectin was reduced by FAK and JNK inhibitor and not negatively affected by Ras and ERK inhibitors (Figure 1 A and D). On the long-term, JNK and FAK inhibitors reduced collagen I, while for Ras and ERK inhibitors it was dependent on the hASC donor – either similar or slightly reduced when compared with osteogenic treatment (data not shown). The corresponding pathways in this control remain unclear.
Concerning osteogenic differentiation, ALP activity (Figure 4) and calcium mineralization (Figure 5) were quantified. FAK and JNK inhibitors significantly reduced both markers. ERK inhibitor blocked calcium mineralization more efficiently than ALP activity. Ras inhibitor had no negative impact on both. For hASC I it was found that the Ras inhibitor brought the ALP activity maximum forward to day seven (Figure 4 A), as well as an earlier and significant increase of calcium after 14 days instead after 21 (Figure 5 A). The calcium results were confirmed by alizarin red staining (Figure 6). Expression of osteocalcin and osteopontin as further osteogenic markers were inhibited by FAK and JNK inhibitors on the entire surface, it was a moderate blocking by the ERK inhibitor, while the Ras inhibitor had no negative impact (Figure 6). Comparing our findings with other studies, similarities and differences can be pointed out. The inhibitory role of FAK and ERK inhibitors could be confirmed[9,18]. Ras was shown to have a stimulative and inhibitory effect on the osteogenic markers[10,19]. Huang et al.[20] reported that inactivation of JNK promoted osteogenesis. On the contrary, JNK inactivation inhibited calcium mineralization and osteocalcin, but not ALP activity and osteopontin[21]. However, none of the studies have been carried out with hASCs.
For further insights the impact on the protein levels of the transcription factors Runx2 and osterix were analyzed. With respect to the relative fluorescence intensity (Figure 2) it could be concluded that all inhibitors reduce the transcription factors, except for FAK concerning osterix. Via the western blot study (Supplementary Figure 3) it could be concluded that Runx2 was not affected by Ras, but affected by ERK, JNK, and FAK. Furthermore, JNK further slightly interacted with osterix, while inhibition of Ras increased it; ERK and FAK had no impact. These discrepancies between the applied methods, which we performed with the same hASC donor, confirm the criticism of Schindeler et al.[10]; therefore, an interpretation of the results is difficult and needs further analysis.
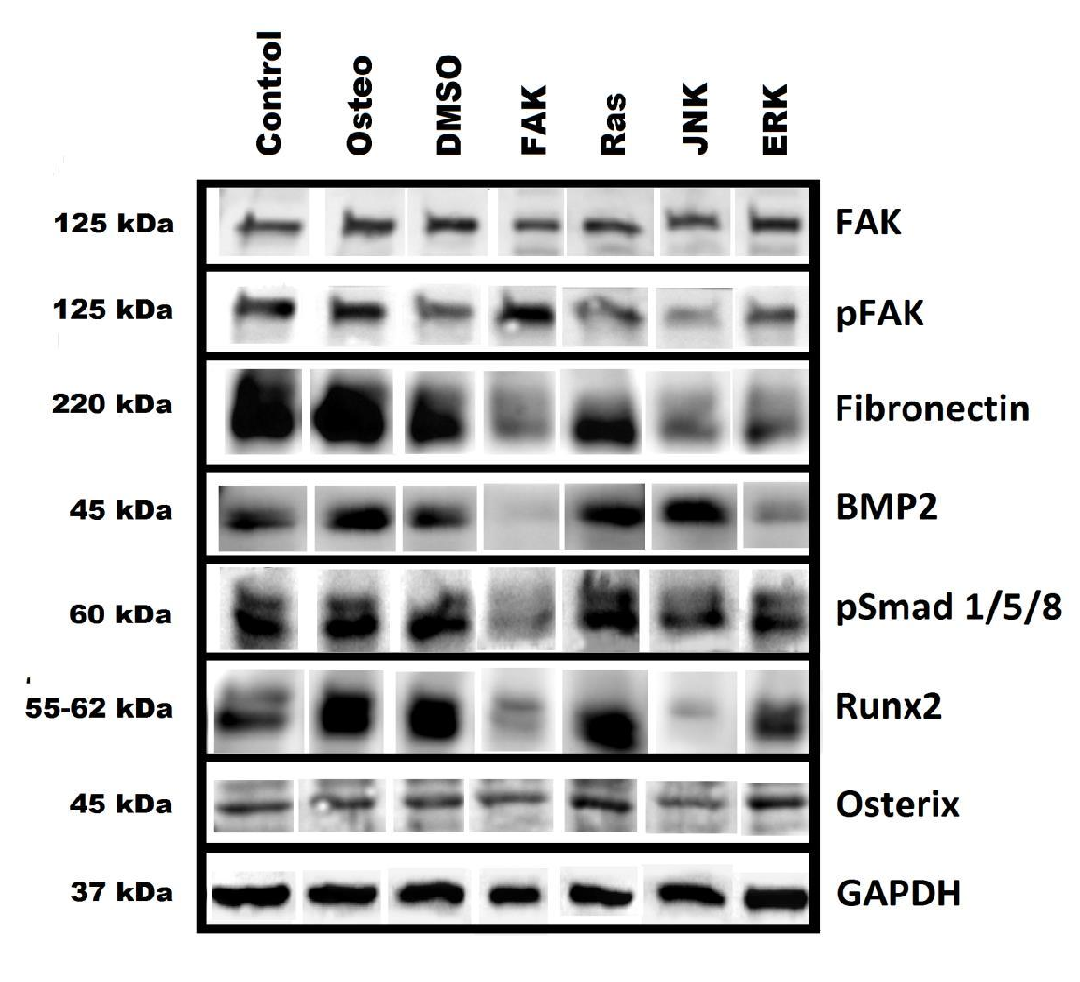
Supplementary Figure 3: the protein levels of FAK, p-FAK Tyr397, fibronectin, BMP-2, p-Smad 1/5/8, Runx2, osterix, and GAPDH via western blot.
However, the transcriptional activity depends on the phosphorylation. It was reported that MAPKs like ERK, JNK, and p38 phosphorylate Runx2 and osterix, and increase ALP activity and calcium mineralization[22,23]. Via analyzing the activation of ERK we found that FAK and Ras inhibitor increased the amount of p-Runx2; JNK and ERK inhibitors did not (Figure 2 E). But the extent of p-Runx2 was generally lower than under osteogenic conditions. It could be concluded that JNK and ERK are needed for a Runx-2 dependent osteogenic differentiation. Since the Ras inhibitor increased osterix protein level (Supplementary Figure 3) and Runx-2 phosphorylation (Figure 2 E), both transcription factors have to be involved in the sustained osteogenic differentiation quantified by the osteogenic markers (Figure 4 - 6). The FAK inhibitor reduced the levels of Runx2 and p-Runx-2 (Figure 2 E, Supplementary Figure 3), indicating that Runx2 is necessary to promote osteogenic differentiation in dependence of FAK.
However, it cannot clearly be proven that inactivation of FAK stops osteogenic differentiation. Since blocking of FAK causes a decrease of focal adhesion contacts via disorganized p-FAK dots at stress fibers (Figure 1 A and C)[14], the cells do not strongly adhere to the surface. Therefore, there is a risk that poorly attached cells can be removed by each media change during cultivation and analyzing procedures. Even though Slack-Davis et al.[14] and our study demonstrated reduced cell growth (Figure 3), the question remains open whether FAK is actually necessary for cell cycle progression or the reduction of cell density is caused by the described cell removal. All results of the osteogenic markers were normalized on the surface area. With respect to the low attached cell density in the presence of FAK inhibitor, the extents of each marker were low (Figure 4 and 5). But staining of osteocalcin and osteopontin revealed that single cells strongly expressed both of them (Figure 6). This might be related to the osterix expression (Figure 2 F, Supplementary Figure 3). To follow this thesis a modification of the experimental procedure is necessary. A setup is needed which enables inhibition of FAK in a way that the cells cannot be removed. Establishing a three-dimensional cell model, which incorporates FAK-inhibited cells within the ECM, might be a possibility to improve further studies. The JNK inhibitor also reduced the cell density and p-FAK extent, but not so dramatic like the FAK inhibitor (Figure 1 C and 3, Supplemenatary Figure 3). In this connection, a sustained osteogenic differentiation can be excluded, since no single cells were stained for osteocalcin and osteopontin after JNK inactivation (Figure 6).
After discussing the inhibitor impacts on proliferation, osteogenic markers, and transcription factors, other aspects, which are thought to play a role in osteogenic differentiation, have to be taken into account. Generally, the anchorage of cells to the surrounding matrix via integrin receptor binding is essential to stimulate cell survival, proliferation, and differentiation[13]. It was characterized via focal adhesion formation (Figure 1). As mentioned above, the FAK inhibitor reduced the amount of p-FAK via quantifying the staining; on the contrary, the western blot study resulted in an increase (Figure 3). This might be related to the fact that FAK inactivation changed the typical dot formation. In combination with actin staining it was obvious, that focal adhesions were reduced. P-FAK was rather and higher located around the nuclei (Figure 1 A). Since the entire cell body was quantified after staining and p-FAK was not located every way, this could cause the obtained decrease with this method. With both methods a reduction of p-FAK in dependence of JNK inhibitor was determined. The Ras inhibitor caused an increase or no impact, ERK inhibitor no impact or reduction (Figure 1 C and Supplementary Figure 3, respectively). However, the formation of stress fibers and focal adhesions were not negatively affected. All treatments were shown not to influence the FAK value (Supplementary Figure 3). To conclude, effects by FAK inactivation on osteogenic differentiation were related to changes in focal adhesion formations, while this phenomenon could be excluded for the other inhibitors. Therefore, focal adhesions were shown to be essential for osteogenic differentiation.
Beside cell anchorage, several studies reported about a correlation between cell shape and lineage commitment. For other cell types, not hASCs, it was demonstrated that cell elongation and a more spread cell shape improve osteogenic differentiation[1]. This involves a higher extent of actin polymerization, stress fibers, and intracellular tension due to incorporation of myosin. These aspects are related to the RhoA-Rho kinase (ROCK) signaling pathway. Both parameters were shown to be higher expressed in elongated well spread cells – and cells undergoing osteogenesis. Blocking of either RhoA or ROCK caused a reduction of ALP activity[24]. Rounded cells with a declined RhoA-Rock activity favor adipogenesis and chondrogenesis. Concerning hASCs, no clear correlation could be obtained (Figure 1 B). Control, DMSO, and JNK-inactivated cells were significantly more elongated than osteogenic cells. Following the mentioned thesis, these three treatments should have promoted osteogenic differentiation. But this was not the case (Figure 4 - 6). Under control and JNK conditions, all osteogenic markers were suppressed, while DMSO did not improve them. ERK and FAK inhibitors did not affect cell elongation, even though osteogenic differentiation was reduced. It can be assumed that hASCs do not follow the clear correlation between cell shape and osteogenesis, which emphasizes the discrepancies of various cell types[10]. Further hASC studies, for instance blocking actin polymerization and analyzing the effects on differentiation, are necessary to get more insights.
All applied inhibitors reduced the amount of p-ERK (Figure 2 D). This links directly to the reduced activation of Runx2 (Figure 2 E). Concerning the ERK inhibitor this finding was not a novelty[25]. In terms of FAK and JNK it can be concluded the both pathways have to interact with ERK signaling. It was reported that Ras activates MAPKs via phosphorylation[6]. Here, blocking of Ras resulted in blocking of ERK activity. Therefore, the sustained osteogenic differentiation after Ras inactivation has to be independent of ERK. If it was caused by JNK or p38 pathways, which can be activated by other stimuli than Ras, needs further analysis. Up to now the hASC interplay of the three MAPK pathways ERK, JNK, and p38 (which we did not investigated) remains unclear. Beside the MAPK pathway, osteogenesis is further dependent on BMP-Smad cascades. Activated Smad is a positive coactivator of Runx2; but not alone responsible for osteogenic differentiation[2,20]. Following the immunostaining (Figure 2 B and C), JNK and FAK inactivation resulted in a decrease of BMP-2 level within the cells, for Ras and ERK it was similar to the osteogenic treatment. At the same time, Ras and JNK inhibitor demonstrated a reduction of p-Smad, while FAK and ERK inhibitor had no effect. Following the western blot study (Supplementary Figure 3), BMP-2 was less expressed in the presence of FAK and ERK inhibitor, but similar in the presence of Ras and JNK. Moreover, p-Smad was less detectable after FAK and JNK inactivation, while ERK had no and Ras a promoting effect. These discrepancies make it impossible to transfer this signaling cascade to transcription factor activation and interplay with the described FAK, Ras, JNK, and ERK pathways.
In a sum, novel insights in the osteogenic pathway of hASCs were given. But there are still open questions with regard to hASC donor, applied method, signaling interplays, and their precise transcription factor activation, which needs to be answered in future studies.


