
Performance of Household Water Treatment Methods for Microbial Removal under Household Conditions in Kabale District, Uganda
Alex Saturday1,2*, George Lukoye Makokha2, Anthony Macharia2
Affiliation
- 1Department of Environment and Natural Resources, Kabale University, Uganda
- 2Department of Geography, Kenyatta University, Nairobi, Kenya
Corresponding Author
Mr. Alex Saturday, Department of Environment and Natural Resources, Kabale University, Uganda, E-mail: saturday.alex@yahoo.com
Citation
Saturday, A., et al. Performance of Household Water Treatment Methods for Microbial Removal under Household Conditions in Kabale District, Uganda. (2016) J Environ Health Sci 2(2): 1-9.
Copy rights
© 2016 Saturday, A. This is an Open access article distributed under the terms of Creative Commons Attribution 4.0 International License.
Keywords
Household water treatment; Water quality; Microbial removal
Abstract
Despite the Ugandan government efforts to improve access to safe water sources, the rate at which diseases spread as a result of unsafe drinking water is absolutely high. The purpose the study was to assess the performance of household water treatment methods (HWT) and evaluate their ability to improve the microbial quality of drinking water under household conditions in Kabale District. We randomly selected 205 households, where we collected treated and untreated water samples. We analyzed 46 paired samples (untreated and treated) of drinking water from 46 households that reported treated water available. Samples were analyzed for total coliforms and Escherichia coli, the major indicators of biological contamination of drinking water, to measure effectiveness of treatment under household conditions. All reported HWT did not significantly improve the microbial quality of drinking water. Mean log10 total coliforms removal were 0.7 log10 (40.1%) for boiling method, 0.2 log10 (23.7%) for biosand filtration method, -0.01log10(-18.1%) for let it stand and settle method and 0.1 log10 (16%) for application of aqua safe tablets. In addition, mean log10 Escherichia coli removal were 0.7 log10 (-22.6) for boiling method, 0.3log10 (37.5%) for biosand filtration method, -0.4 log10 (-200%) for let it stand and settle method and 0.6 log10 (50%) for application of aqua safe. The microbiological quality of stored treated drinking water was significantly low. The government should sensitize the local people on safe storage of drinking water.
Introduction
Approximately more than 700 million people globally lack access to improved water sources (WHO/UNICEF, 2015). Sub-Saharan Africa is most remarkably and disproportionately affected by lack of access to safe drinking water (WHO, 2010). There are approximately 327 million people without access to safe drinking water globally, who live in Sub-Saharan Africa (WHO, UNICEF. 2010, WHO, UNICEF. 2014). Therefore, one of the most important prerequisites for improving access to drinking water in developing countries is through implementation of household water treatment in communities that are in dire need of safe drinking water.
In Uganda, the governments’ commitment to improve access to safe water sources is evidenced by the marked increase in the number of people with access to safe water sources from 54% in 2001 to 76% in 2015 WHO/UNICEF, 2015. However, the rate at which diseases spread as a result of unsafe drinking water is absolutely high. The study by UBOS & ICF, 2011 reported that 23%, and 14% of 1,096 children under the age five countrywide and in southwestern part of the country respectively, had diarrhea disease before 2012 demographic health survey. Additionally the study further revealed that child mortality rate was 90 deaths per 1,000 live births. Most of these deaths were caused by diarrheal disease as a result of unsafe drinking water. Diarrheal outbreaks may be associated with the consumption of contaminated drinking water and unhygienic household practices (Mattioli, M.C., et al. 2014). Evidence-based on research suggests that HWT methods have the ability to improve microbial quality of drinking water and can reduce the risk of disease outbreak as a result of drinking contaminated water (Clase n, T., et al. 2006). In the most recent study by (Wolf, J., et al, 2014) found out that respondents relying on unimproved water supplies, household based chlorination combined with safe storage vessels was associated with a 36% (95% CI: 28 – 45%) reduction in the risk of diarrhea. Although some studies indicate that HWT methods have the potential to reduce the risk of diseases that spread as result of drinking contaminated water, little work had been done to establish different HWT methods and their microbial removal efficiency in Kabale District, western Uganda. Therefore, the documentation of HWT and their effectiveness for microbial removal under household conditions in Kabale District was necessary.
Materials and Methods
Study area characteristics Kabale District is geographically located in Southwestern Uganda. it lies between 29° 45′ 0″ E and 30° 15′ 0″ E and latitudes 0° 1′ 0″ S and 1° 29′ 0″ S (Figure 1). It covers a total area of about 1,864 Square kilometers (KDLG, 2012). It borders with the districts of Kisoro to the West, Rukungiri to the North, Ntungamo to the East and the Republic of Rwanda to the South [KDLG, 2012.]. Approximately 81% of households have access to safe drinking water sources (KDLG, 2010). The main water sources of drinking water are public-stand pipes and protected spring technologies. Rainwater harvesting is practiced though on small scale (KDLG, 2010). The study assessed the performance of household water treatment methods in reducing the total coliforms and Escherichia coli in drinking water in the study area during unannounced household visits. The map of the study area is as presented in (Figure 1).
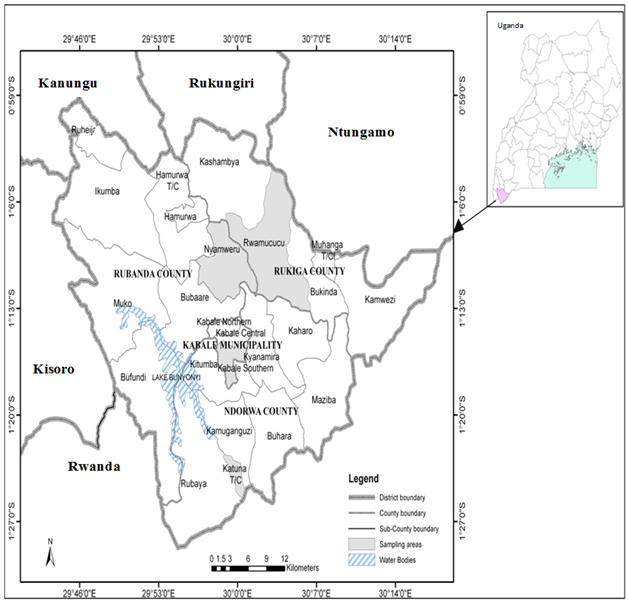
Figure 1: Map showing the study area (Kabale District) in southwestern Uganda.
Selection of participating households The formula developed by Israel(1992) was used to quantify the minimum sample size because it yields a good sample size necessary for impact evaluations (Equations 1 and 2).
n = N / (1 + N(e)2 ) -------------------------------- Equation: (1)
Where: n = required sample size, N = Population size (119,631) and e = level of precision (7% equivalent to its standard value 0.07). Substituting in equation 1 gives the following sample size;
n = (119,631 ) / (1 + 119,631 (0.07)² ) = 204 --------------------Equation: 2
Since 204 households were the minimum sample, we decided to randomly select 205 households and conducted interviews on sources of drinking water, household water treatment, and storage options.
Water sampling
For each household visited, both treated and untreated household water samples (if the household head reported them available) were collected aseptically in sterilized 500 ml bottles during unannounced visits. For purposes of quality, samples were collected in duplicates. The bottle corks were shielded with aluminum foil to avoid any form of hand contamination. We assigned identification numbers to each water sample and recorded the time of sampling, type of the sample (whether treated or untreated) and method used to treat it. The number of days the treated water had stayed up to sampling time was recorded. We transported the samples to NWSC-Kabale area water laboratory and stored at 4°C before they were analyzed.
Sample processing and analyses
We enumerated total coliforms and Escherichia coli using the membrane filtration method followed by incubation on hichrome media. Using this method, 100 ml of water were aseptically drawn from each unit of the samples and filtered through a 0.45 μm millipore filter membrane. The membrane was aseptically removed from the filtration unit by using sterile forceps and placed on the medium in the petri-dish in a rolling motion to avoid entrapment of air. Total coliforms and Escherichia coli counts were determined by incubating the membrane filter on Hichrome media at 37°C and 44°C for 24 hours respectively.
To assess microbial removal efficiency of the HWT, we compared the concentrations of total coliforms and Escherichia coli before and after treatment by HWT in the laboratory. The enumeration of total coliforms and Escherichia coli before and after treatment was done following standard methods for the examination of water and wastewater(WE Federation, 2005, Rice, E.W., et al, 2012).
Log10 bacterial reductions were calculated using the equation below and were converted to percentage reduction. The formula for calculating bacteria removal efficiency is shown in equations 1− 2(Martin, H., 2010).
LR = Log10 (B.Cb) - log10 (B.Ca) (1)
(B.Cb - B.Ca)
PLR = ------------------ x 100% (2)
(B.Cb)
Where: LR = log reduction, PLR = percentage log reduction, B.Cb = bacteria count before treatment, B.Ca = bacteria count after treatment.
Results
We randomly interviewed 205 respondents of which, 81.5% were females and 18.5% were males. Only 46 respondents reported treated water available. Thus we were able to collect 46 paired samples, which we analyzed for total coliforms and Escherichia coli.
Sources of household drinking water
The field study survey revealed that 61.5% of respondents get their drinking water from water springs, 19% from public taps, 4.4% from private taps, 8.8% from neighbors’ taps, 1.5% from shallow wells and 0.5% from boreholes (Table 1). Taps and boreholes were both privately and publicly owned. Water springs were publically owned. Shallow wells were constructed by local people faced with limited access to safe drinking water.
Table 1: Reported sources of household drinking water.
| Drinking water source | Frequency | Percent |
|---|---|---|
| Private tap | 9 | 4.4 |
| Shallow well | 3 | 1.5 |
| Public tap | 39 | 19 |
| Borehole | 1 | 0.5 |
| Water spring | 126 | 61.5 |
| More than one source | 9 | 4.4 |
| Piped water from the neighbour | 18 | 8.8 |
| Total | 205 | 100 |
Reported household water treatment methods
The study findings revealed that majority respondents were using any one of the following HWT: boiling, biosand filtration let it stand and settle method, application of Water guard tablets and application of aqua safe tablets. 24.4% were not using any HWT to purify their drinking water (Table 2). Of all HWT reported, boiling was noted the most common method of household water treatment both in rural and urban areas, and was used by both educated and uneducated people in the study area. Let it stand and settle is common in rural areas, practiced by people with low education level and the elderly. Biosand filtration method is the latest of all HWT, however; its uptake was considerably low since its inception. A reasonable number of respondents (24.4%) were not practicing water treatment because of different reasons as indicated in (Table 3).
Table 2: Household water treatment technologies.
| HWT | Frequency | Percent | Valid Percent |
|---|---|---|---|
| Boiling | 138 | 67.3 | 67.3 |
| Add aqua safe tablets | 2 | 1 | 1 |
| Let it stand and settle | 9 | 4.4 | 4.4 |
| Biosand filtration | 5 | 2.4 | 2.4 |
| Water guard tablets | 3 | 1.5 | 1.5 |
| Don’t use any HWT | 50 | 24.4 | 24.4 |
| Total | 205 | 100 | 100 |
Table 3: Reasons for not treating household drinking water.
| Frequency | Percent | Valid Percent | |
|---|---|---|---|
| It is expensive | 4 | 2 | 2 |
| Bad taste and smell of treated water | 13 | 6.3 | 6.4 |
| I believe water is safe from the source | 16 | 7.8 | 7.8 |
| We are used to drinking untreated water | 12 | 5.9 | 5.9 |
| Time consuming | 2 | 1 | 1 |
| Not applicable | 155 | 75.6 | 76 |
| Others | 2 | 1 | 1 |
| Very old and don’t have the energy to treat water | 1 | 0.5 | 0.5 |
| Total | 205 | 100 | 100 |
Reported household water storage options
Majority respondents (33.7%) were using 5-litre jerricans as they their preferred household water storage option, whereas the small proportion of respondents (2.5%) were using clay pots (Table 4).
Table 4: Household water storage options.
| Reported water storage options | Frequency | Percent | Valid percent |
|---|---|---|---|
| 5-litre jerricans | 69 | 33.7 | 33.7 |
| Plastic buckets | 28 | 13.7 | 13.7 |
| 20-litre jerricans | 27 | 13.2 | 13.2 |
| Jugs | 16 | 7.8 | 7.8 |
| Plastic bottles | 6 | 2.9 | 2.9 |
| Clay pot | 5 | 2.5 | 2.5 |
| Don’t store drinking water | 53 | 25.9 | 25.9 |
| Total | 205 | 100.0 | 100.0 |
Bacteriological quality of untreated water samples
(Figure 2) shows the concentration of total coliforms and Escherichia coli in untreated household test water samples in comparison with WHO and Uganda National Bureau of Standards (UNBS). Total coliforms ranged from 0 to 496 CFU/100 ml whereas Escherichia coli ranged from 0 to 242 CFU/100 ml. Table 5 illustrates the frequencies and percentages of household untreated test water samples falling under different risk categories; 0 CFU/100 ml (no risk/ in compliance), 1 to 10 CFU/100 ml (low risk), 11 to 100 (medium risk), 101 to 1000 (high risk) and < 1000 CFU/100 ml (Very high risk). It was revealed that only 6.5% of untreated test water samples were free of total coliforms (0 CFU/100 ml), whereas 52.2% fell within high risk category (101 to 1000). The study further revealed that 26.1% test water samples were free of Escherichia coli, whereas a small proportion of test water samples (4.3%) fell within high risk (101 to 1000).
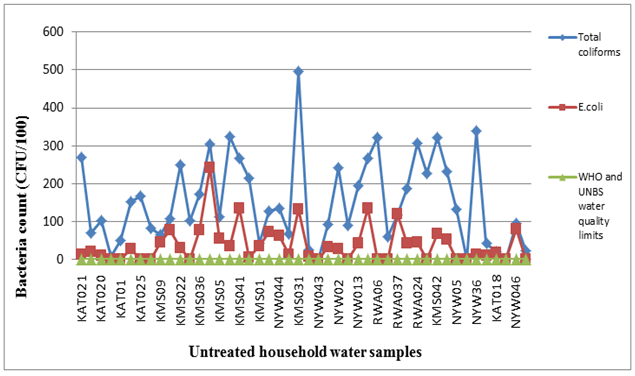
Figure 2: Concentration of bacteria in untreated household tested water samples.
Table 5: Classification of total coliforms and Escherichia coli in household treated water samples.
| Risk level category | Total coliforms | Escherichia coli | ||
|---|---|---|---|---|
| Frequency | Percent | Frequency | Percent | |
| No Detection (ND) | 3 | 6.5 | 12 | 26.1 |
| 1–10 | 2 | 4.3 | 10 | 21.7 |
| 11–100 | 17 | 37.0 | 22 | 47.8 |
| 101–1000 | 24 | 52.2 | 2 | 4.3 |
| Total | 46 | 100.0 | 46 | 100.0 |
Performance of reported HWT
In this study, the efficiency of HWT (boiling, biosand filtration, Water guard tablets, aqua safe tablets and let it stand and settle) in removing total coliforms and Escherichia coli from water was determined under household and laboratory conditions as indicated in the subsequent subsections;
In boiled water samples, log10 total coliforms reduction ranged from -0.5 log10 to 2.4 log10, which corresponded with -115.6% to 99.6% removal efficiency (Table 7 and Table 8). Log10 Escherichia coli ranged from -0.4 log10 to 2.0 log10 which corresponded with -200% to 100% removal efficiency (Table 6). The overall mean log10 total coliforms and Escherichia coli were 0.7 log10 and 0.7 log10 respectively (Table 6).
In water samples treated by biosand filters, log10 total coliforms reduction ranged from -0.1 log10 to 0.4 log10, which corresponded with -11.6% to 59.1% removal efficiency (Table 7). Log10 Escherichia coli reduction ranged from 0 log10 to 0.6 log10, which corresponded with 0 to 75% removal efficiency (Table 6). The overall mean log10 total coliforms and Escherichia coli were 0.2 log10 and 0.4 log10 respectively (Table 6).
In water samples treated by let it stand and settle method, log10 total coliforms reduction ranged from -0.5 log10 to 0.6 log10, which corresponded with -100% to 73.5% removal efficiency (Table 7 and Table 8). Log10 Escherichia coli ranged from -0.6 log10 to 0.0 log10, which corresponded with -300 to 0.0% removal efficiency (Table 6 and Table 8). The overall mean log10 total coliforms and Escherichia coli were -0.02 log10 and -0.35 log10 respectively (Table 6).
In water samples treated by aqua safe tablets, log10 total coliforms reduction ranged from 0.0 log10 to 0.2 log10 which corresponded with 0 to 32% removal efficiency (Table 6 and Table 8). Log10 Escherichia coli were 1.2 log10, which corresponded with 100% removal efficiency (Table 6 and Table 8). The overall mean log10 total coliforms and Escherichia coli were 0.08 log10 and 0.6 log10 respectively (Table 6).
Table 6: Descriptive analysis of log10 reductions by HWT.
| Mean | Std. Deviation | Std. Error | 95% Confidence Interval for Mean | Min | Max | |||
|---|---|---|---|---|---|---|---|---|
| Lower Bound | Upper Bound | |||||||
| Log10 total coliform reduction | Boiling | 0.7 | 0.80 | 0.10 | 0.406 | 0.972 | -.5 | 2.4 |
| Biosand filtration | 0.2 | 0.30 | 0.20 | -2.598 | 2.939 | 0.0 | 0.4 | |
| Let it stand and settle method | -0.02 | 0.40 | 0.20 | -0.719 | 0.682 | -0.5 | 0.6 | |
| Aqua safe tablets | 0.1 | 0.10 | 0.1 | -0.936 | 1.096 | 0.0 | 0.2 | |
| Total | 0.6 | 0.80 | 0.10 | 0.333 | .824 | .5 | 2.4 | |
| Log10 Escherichia coli reduction | Boiling | 0.7 | 0.8 | 0.10 | 0.355 | .877 | -.4 | 2.1 |
| Biosand filtration | 0.4 | 0.4 | 0.30 | -3.524 | 4.126 | 0.0 | 0.6 | |
| Let it stand and settle method | -0.3 | 0.2 | 0.1 | -0.760 | 0.070 | -0.6 | 0.0 | |
| Application of Aqua Safe Tablets | 0.6 | 0.8 | 0.60 | -7.024 | 8.224 | 0.0 | 1.2 | |
| Total | 0.5 | 0.8 | 0.10 | 0.284 | 0.752 | -0.6 | 2.1 | |
Table 7: One-way ANOVA results showing the relationship between log10 reductions by HWT under household conditions.
| Sum of Squares | df | Mean Square | F | Sig. | ||
|---|---|---|---|---|---|---|
| Log10 Total Coliform Reduction | Between Groups | 2.720 | 3 | 0.907 | 1.356 | 0.269 |
| Within Groups | 28.084 | 42 | 0.669 | |||
| Total | 30.803 | 45 | ||||
| Log10 Escherichia Coli Reduction | Between Groups | 3.452 | 3 | 1.151 | 1.981 | 0.132 |
| Within Groups | 24.398 | 42 | 0.581 | |||
| Total | 27.850 | 45 | ||||
Table 8: Descriptive analysis of percentage reductions of total coliforms and Escherichia coli by selected HWT under household conditions.
| Mean | Std. Deviation | Std. Error | Min | Max | ||
|---|---|---|---|---|---|---|
| Percentage total coliform Reduction | Boiling | 40.2 | 65.3 | 10.6 | -115.7 | 100.0 |
| Bio sand filtration | 23.8 | 49.9 | 35.3 | -11.6 | 59.1 | |
| Let it stand and settle method | -18.1 | 72.4 | 36.2 | -100.0 | 73.5 | |
| Aqua safe tablets | 16 | 22.6 | 16 | 0.0 | 32.0 | |
| Total | 33.3 | 64.9 | 9.6 | -115.7 | 100.0 | |
| Percentage Escherichia coli reduction | Boiling | 22.6 | 81.9 | 13.3 | -200.0 | 100.0 |
| Bio sand filtration | 37.5 | 53 | 37.5 | .0 | 75.0 | |
| Let it stand and settle method | -200 | 141.4 | 71.7 | -300.0 | .0 | |
| Aqua safe tablets | 50 | 70.7 | 50 | .0 | 100.0 | |
| Total | 5.1 | 105.6 | 15.6 | -300.0 | 100.0 | |
Bacterial removal efficiency
Mean log10 total coliform reduction values were: 0.7(40.2%) by boiling method, 0.2 (23.8%) by biosand filtration method, -0.02(-18.1%) by let it stand and settle method and 0.1 (16%) by application of aqua safe tablets (Table 6 and Table 8). Mean log10 Escherichia coli reduction values were: 0.7(22.6%) by boiling method, 0.4(37.5%) by biosand filtration method, -0.3(-200%) by let it stand and settle method and 0.6(50%) by application of aqua safe (Table 6 and Table 8). There were no significant differences between the technologies (p > 0.05) as shown in (Table 7). Almost all the treatment methods showed not significant differences in removing total coliforms and Escherichia coli in drinking water.
Results and Discussion
Sources of drinking water
Although majority respondents (95.7%) had access to the sources of drinking water, most of these sources were at high risk of contamination. Water springs which were being used by majority respondents had toilets constructed in less than 20 meters away them (Plate 1A). Shallow wells were unprotected and their mode of construction and location exposed them to high contamination. One would first step in water in order to get well positioned to collect it. Furthermore, crops were seen grown in less than 10 meters away from the water source (Plate 1B). This explains why majority of water samples from springs were associated with high total coliforms and Escherichia coli concentrations. Constructing toilets in close proximity to drinking water source puts it at risk of feacal contamination. In a related study by (Sivaraja, R., et al., 2014) found out that river Cauvery in India was loaded with coliform bacteria attributable to raw sewage. Additionally, (Abdulkadir, R.S., et al 2014) reported high concentration microbes in drinking water sources located in close proximity to pit latrines.
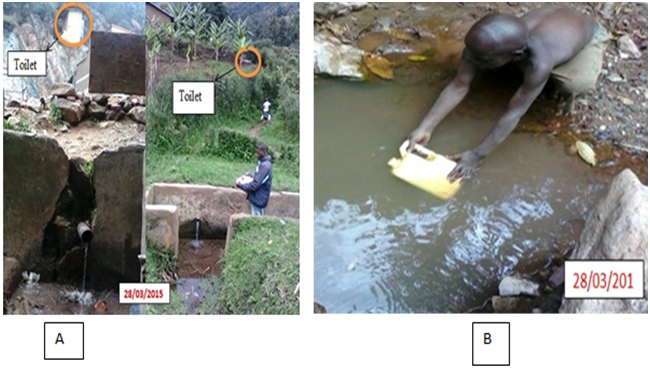
Plate 1A: Water springs and B: Unprotected shallow wells (Source: Field survey)
Household water treatment
Of all the HWT reported, boiling was noted the most common method used by both educated and uneducated people in the study area. Let it stand and settle is common in rural areas, practiced by people with low education level and the elderly. Biosand filtration method was the latest of all HWT and its uptake has considerably been low since inception.
Extensive use of boiling method in the study area is related to the fact that fuel wood is not yet a very big issue since some forests (natural and planted) still exist. The results of this study concur with research findings by (Kakulu, R.K. 2012, Rosa, G., 2010) that reported boiling method as the most popular household water treatment method with 43.6%. The present study findings however do not concur (Wright, J., et al., 2009, Sreenivasan, N., et al, 2015) who found out that water filtration, application of Water guard and let it stand and settle methods were in widespread use. In rural Bangladesh, (Ercumen, A., et al. 2015) reported that water treatment was rarely practiced among study participants with 1 – 2% of households reporting treating their drinking water. Of the 30 total households that reported water treatment, 26 were using boiling method, two were using a cloth filter and boiling, one was using chlorine tablets and one was using a commercial filter.
A reasonable percentage of respondents (24.4%) were not practicing household water treatment because; treated water had bad taste and smell, they were used to drinking untreated water and others believed that their drinking water sources were safe. The study findings concur with (Kakulu, R.K., 2012), who found out that respondents were not treating their drinking water because they believed that it is safer from the source, did not have knowledge on existing household water treatment methods and cost of household water treatment was high. These results imply that people are not well sensitized about the importance of household water treatment and the dangers related to consumption of untreated water. In a related research study by (Sodha, S.V., et al. 2011), among 28 respondents who did not treat their drinking water, 36% said consumption of untreated drinking water was their habit while 21% believed their source water was already safe.
Household water storage options
The container used to store drinking water greatly influences the quality of drinking water. A research study by (Harris, J.R., et al., 2009) found out that regardless of whether treated household water is initially of acceptable microbiological quality, it often becomes contaminated with pathogens of fecal origin during storage perhaps as a result of unhygienic storage and handling practices. Though a number of water storage options were revealed during the unannounced field study visits, majority (33.7%) respondents showed preference to 5-liter jerricans because they were generally cheap, safe to use, light and durable. Plastic buckets were preferred because were easy to clean; 20-liter jerricans were preferred because they were storing much drinking water for quite a number of days and plastic bottles were preferred because are cheap and in cases free of charge. The current study agrees with (Harris, J.R., et al. 2009) who reported that household water storage containers such as clay pots (62%), jerricans (21%), barrels (7%), buckets (5%), jugs (3%), and bottles (1%) were used by mothers before KiBS (Kisumu Breast feeding Study) clay pots were introduced.
Bacterial removal efficiency
It is significantly important to assess the effectiveness of household water treatment methods under household conditions because it indicates how well a method can improve the quality of drinking water without any external interference. The fact that most communities in Kabale District rely on unimproved water sources such as shallow wells, unprotected water springs and unprotected boreholes which are at high risk of contamination, it is important that various HWT methods should be evaluated to come out with those that can perform well under rural household conditions.
There were no significant differences in the level of microbiological effectiveness achieved across the methods. Generally all methods did not meet WHO criteria for “protective” treatment of drinking water on the basis of bacterial reduction, which requires a mean 99% reduction in bacteria (WHO, 2011) though these performance recommendations are based on laboratory based data. Bacterial reductions reported here are comparable though generally low in relation to previously reported estimates of HWT field performance (WHO, 2011). Relatively low bacterial reduction may have been achieved partly because; participants were not provided with trial HWT methods together with safe storage vessels to safeguard contamination after treatment; participants were neither advised nor taught the best practices to ensure that safe water treatment and storage is achieved. The study entirely depended on respondents’ own knowledge of water treatment and storage and none of our data collection team had engaged the community on correct use of any methods. Thus, though this study relatively assessed the performance of the methods under actual household conditions with no interventions.
Boiling method achieved mean overall total coliform and Escherichia coli reduction of 40.1% (0.7 log10 and 22.6% (0.7 log10) respectively, inconsistent with the study from peri-urban India where boiling reduced total coliforms by 99% (n = 1088) (WHO, 2007). The findings of the study do not concur with other studies including with those from rural Guatemala (86.2%) of Total coliforms (Rosa, G., et al, 2010), Cambodia (98.5% of Escherichia coli (Brown, J., et al, 2012); and Vietnam (97% of Total coliforms[Clasen,T, 2007). High bacteria concentration in boiled water under household conditions may be due to variability of boiling in practice and the risk of recontamination during storage (Brown, J., et al, 2012). High total coliforms and Escherichia coli concentrations in household treated water samples could have been due to prolonged storage of household drinking water and re growth of total coliforms and Escherichia coli. Inappropriate water storage, dipping contaminated hands and cups into stored drinking water also increase chances of high total coliforms and Escherichia coli concentrations in stored drinking water (Sobsey, M., et al, 2002).
Application of aqua safe tablets achieved an overall mean total coliform and Escherichia coli reduction of 16% (0.1 log10) and 50% (0.6 log10) respectively. Poor performance of aqua safe tablets may be attributed to the fact that users did not know how to effectively apply to aqua safe tablets. Some users believed it was just a matter of adding aqua safe tablets to water and allow it to settle for some minutes.
The biosand filtration method achieved an overall mean total coliforms and Escherichia coli reductions by 23.8% (0.2 log10) and 37.5% (0.3 log10) respectively. The findings of this study do not agree with (Stauber, C.E., et al, 2006) who found out that effectiveness of biosand filters on field tested water samples ranged from 0 log10 to 2.5 log10 (99.7%). The present study also doesn’t agree with (Earwaker, P. 2006), who reported that biosand filters on average reduced Escherichia coli by 87.9% with 75.7% of filtrate samples with Escherichia coli < 10 CFU/100 ml. Poor performance of biosand filters could be due to their irregular use and poor maintenance. Most biosand filters looked not to have been in use for some time. Perhaps users re-started to use them when they heard about our research activities in their villages.
For a biosand filter to effectively remove bacteria from drinking water, it should have been regularly used for more than 22 days. This explanation agrees with (Sobsey, M.D., et al, 2008) who reported that the efficacy of biosand filters in removing microbes in drinking water varied with filter maturity, dosing conditions, flow rate, pause time between doses, grain size, and filter bed contact time. Inadequacies in biosand filter construction, operation and maintenance perhaps could further explain their poor performance in total coliforms and Escherichia coli removal. A study by (Clasen, T., 2006) reported that poor performance of biosand filters and low usage rates was attributed to the quality of maintenance, lack of reinforcement of educational messages and low support provided to filter users. Additionally, (Mwabi, J.K., et al, 2012) found out that poor performance of biosand filters were due to the fact that they had only been running for only two days at the time of testing, which is not adequate time for a Schmutzdecke to form.
Treatment by let it stand and settle method achieved an overall mean total coliforms and Escherichia coli reductions by -18.1% (-0.01 log10) and -200% (-0.4 log10) respectively. The present study supports UNCEF and WHO (2011) that found out that treatment methods such as straining water through a cloth or let it stand and settle were inappropriate methods for household water treatment. A study by (Mellor, J.E., et al, 2013) found out that total coliforms reduction treatment by let it stand and settle method resulted in total coliforms reduction mean 0.6 log10 (95% CI = -0.4 – 1.5).
Overall, 23.9% and 19.5% of paired household water samples yielded negative log10 total coliform and Escherichia coli reductions, respectively. Negative log reduction occurs when bacteria concentration in a treated water sample is higher than it was before treatment (Mwabi, J.K., et al, 2012). In the present study, negative log reduction perhaps resulted from poor handling of drinking water during storage, use of unsafe water storage options, inadequate cleaning of household water storage vessels and prolonged storage of drinking water. Negative log reductions may result from re-growth of injured bacteria which at a later time their metabolism get reconstructed and recover their growth (Mwabi, J.K., et al, 2012). Improper handling of drinking water during storage, dipping dirty hands and cups into stored drinking water and ineffective cleaning of water storage containers increase chances of storage water contamination (Mellor, J., et al. 2013). Research study by (John, V., et al, 2014) found out that earthen pots (water storage options) that had dirty rims and consumers rarely washed either their hands before taking water from them were associated with high total coliforms concentration. Additionally Escherichia coli can enter a dormant state but viable thus when raw water is tested, they may not be detected or detected in low numbers. After their dormancy period, they are detected in large numbers than before. This interpretations are in line with that of (Wu, F.M., et al. 2002) which state that Escherichia coli and V. cholerae can enter a dormant state, in which they are viable but not cultivable in media used for their detection.
Conclusion
The performance of HWT was generally poor. Our findings indicate that majority of treated household water samples were associated with high total coliforms and Escherichia coli. Prolonged storage of household drinking water, bacterial re-growth, inappropriate water treatment and storage, dipping contaminated hands and cups into stored drinking water perhaps increased total coliforms and Escherichia coli concentrations in stored drinking water. It is therefore important that the government should provide training local people to improve their understanding to effectively use and maintain HWT in use.
Acknowledgement:
gratefully acknowledge financial support from Germany Academic Exchange (DAAD. I would also like to express my sincere gratitude to the anonymous reviewers who made wonderful suggestions to shape this work.
Conflict of Interest:
The author declares no conflict of interest.
References
- 1. WHO, UNICEF. WHO/UNICEF Joint Monitoring Programme for Water Supply and Sanitation. Estimates on the use of water sources and sanitation facilities. (2015)
- 2. WHO, UNICEF. Progress on Sanitation and Drinking-water, 2010 Update, (2010) World Health Organization
- 3. WHO, UNICEF. Progress on Drinking Water and Sanitation: 2014 Update. (2014) World Health Organization and UNICEF. Geneva, Switzerland.
- 4. UBOS & ICF International. Uganda Demographic and Health Survey, 2011. (2012) Uganda Bureau of Statistics, Kampala.
- 5. Mattioli, M.C., Boehm, A.B., Davis, J., et al. Enteric pathogens in stored drinking water and on caregiver’s hands in Tanzanian households with and without reported cases of child diarrhea. (2014) PLoS One 9(1): e84939.
- 6. Clasen, T., Roberts, I., Rabie, T., et al. Interventions to improve water quality for preventing diarrhea. (2006) Cochrane Database Syst Rev 334(7597): 782.
- 7. Wolf, J., Prüss-Ustün, A., Cumming, O., et al. Systematic review: assessing the impact of drinking water and sanitation on diarrhoeal disease in low-and middle-income settings: systematic review and meta-regression. (2014) Trop Med Int Health 19(8): 928-42.
- 8. KDLG. Kabale District local government statistical abstract. (2012) Government of Uganda.
- 9. DWD. National Water Sewerage Corporation supply and distribution report. (2010) Government of Uganda.
- 10. WE Federation, APHA APH. Standard methods for the examination of water and wastewater. (2005) Am Public Health Assoc APHA Wash DC USA.
- 11. Rice, E.W., Bridgewater, L. Standard methods for the examination of water and wastewater. (2012) American Public Health Association, Washington DC.
- 12. Martin, A.H. The log reduction (LR) measure of disinfectant efficacy. (2010) Center for Biofilm Engineering, Montana State University.
- 13. Sivaraja, R., Nagarajan, K. Levels of indicator microorganisms (Total and Fecal Coliforms) in surface waters of rivers Cauvery and Bhavani for circuitously predicting the pollution load and pathogenic risks. (2014) IJPRIF 6(2): 451-461.
- 14. Abdulkadir, R.S., Mahmoud, A.M., Adnan, A., et al. Effect of Pit Latrine Leaks on Shallow Well Water. (2014) Int J Microbiol Appl 1(5): 46-51.
- 15. Kakulu, R.K., Diarrhoea among under-five children and household water treatment and safe storage factors in Mkuranga district, Tanzania. (2012) Muhimbili University of Health and Allied Sciences
- 16. Rosa, G., Clasen, T. Estimating the scope of household water treatment in low-and medium-income countries. (2010) Am J Trop Med Hyg 82(2): 289-300.
- 17. Wright, J., Gundry, S. Household characteristics associated with home water treatment: an analysis of the Egyptian Demographic and Health Survey. (2009) J Water Health 7(1): 21-29.
- 18. Sreenivasan ,N., Gotestrand, S.A., Ombeki, S., et al. Evaluation of the impact of a simple hand-washing and water-treatment intervention in rural health facilities on hygiene knowledge and reported behaviours of health workers and their clients, Nyanza Province, Kenya. (2015) Epidemiol Infect 143(04): 873-880.
- 19. Ercumen, A., Naser, A.M., Unicomb, L., et al. Effects of Source-versus Household Contamination of Tubewell Water on Child Diarrhea in Rural Bangladesh: A Randomized Controlled Trial. (2015) PLoS One 10(3).
- 20. Sodha, S.V., Menon, M., Trivedi, K., et al. Microbiologic effectiveness of boiling and safe water storage in South Sulawesi, Indonesia. (2011) J Water Health 9(3): 577-585.
- 21. Harris, J.R., Greene, S.K., Thomas, T.K., et al. Effect of a point-of-use water treatment and safe water storage intervention on diarrhea in infants of HIV-infected mothers. (2009) J Infect Dis 200(8): 1186-1193.
- 22. WHO, others. Evaluating household water treatment options. Health-based targets and microbiological performance specifications. (2011)
- 23. Clasen, T. Microbiological Effectiveness and Cost of Boiling to Disinfect Drinking Water: Case Studies from Vietnam and India. (2007) Lond Sch Hyg Trop Med 42(12): 4255-4260.
- 24. Brown, J., Sobsey, M.D., Boiling as household water treatment in Cambodia: a longitudinal study of boiling practice and microbiological effectiveness. (2012) Am J Trop Med Hyg 87(3): 394-398.
- 25. Sobsey, M., Joseph Brown. Managing Water in the Home: Accelerated health gains from Improved Water Supply. (2002)
- 26. Stauber, C.E., Elliott, M.A., Koksal, F., et al. Characterization of the biosand filter for E. coli reductions from household drinking water under controlled laboratory and field use conditions. (2006) Water Sci Technol 54(3): 1-7.
- 27. Earwaker, P. Evaluation of Household BioSand Filters in Ethiopia. (2006) Cranfield University, Silsoe Institute of Water and Environment.
- 28. Sobsey, M.D., Stauber, C.E., Casanova, L.M., et al. Point of use household drinking water filtration: a practical, effective solution for providing sustained access to safe drinking water in the developing world.(2008) Environ Sci Technol 42(12): 4261-4267.
- 29. Clasen, T., Boisson, S. Household-based ceramic water filters for the treatment of drinking water in disaster response: An assessment of a pilot programme in the Dominican Republic. (2006) Water PractTechnol 1(2).
- 30. Mwabi, J.K., Mamba, B.B., Momba, M.N.B. Removal of Escherichia coli and Faecal Coliforms from Surface Water and Groundwater by Household Water Treatment Devices/Systems: a sustainable solution for improving water quality in rural communities of the southern african development community region. (2012) Int J Environ Res Public Health 9(1): 139-70.
- 31. Mellor, J.E., Smith, J.A., Samie, A., et al. Coliform sources and mechanisms for re growth in household drinking water in Limpopo, South Africa. (2013) J Environ Eng 139(9): 1152-1161.
- 32. John, V., Jain, P., Rahate, M., et al. Assessment of deterioration in water quality from source to household storage in semi-urban settings of developing countries. (2014) Environ Monit Assess 186(2): 725-734.
- 33. Wu, F.M., Beuchat, L.R., Doyle, M.P., et al. Survival and growth of Shigella flexneri, Salmonella enterica serovar enteritidis, and Vibrio cholerae O1 in reconstituted infant formula.(2002) Am J Trop Med Hyg 66(6): 782-786.


