
Production and Quality Assessment of Gluten-free and Nutrient-dense Biscuit from Acha, Pigeon Pea and Sweet Potato Blends
Mbaeyi-Nwaoha, I.E1*, Egbo, P.C1, Omah, E.C1, Davidson, G.I2
Affiliation
- 1Department of Food Science and Technology, University of Nigeria, Nsukka, Nigeria
- 2Department of Home Science, Nutrition and Dietetics, University of Nigeria, Nsukka, Nigeria
Corresponding Author
Mbaeyi-Nwaoha I.E, Department of Food Science and Technology, University of Nigeria, Nsukka,Nigeria. Tel:+234(0)- 8037722818; E-mail: ifeoma.mbaeyi-nwaoha@unn.edu.ng, miphie2003@yahoo.co.uk
Citation
Mbaeyi-Nwaoha I.E., et al. Production and Quality Assessment of Gluten- Free and Nutrient-dense Biscuits from Acha, Pigeon Pea and Sweet Potato Blends (2015) Int J Food Nutr Sci 2(2): 129-139.
Copy rights
Copy rights: ©2015 Mbaeyi-Nwaoha I.E. This is an Open access article distributed under the terms of Creative Commons Attribution 4.0 International License.
Keywords
Biscuits, ‘Acha’, Pigeon pea, Sweet potato, Gluten, Celiac disease, Nutrient-dense
Abstract
Biscuits were produced using “acha”, pigeon pea and sweet potato flour blends. Proximate, antinutrient, vitamin and sensory evaluation were carried out on the samples using standard methods. Results obtained revealed the following ranges of proximate parameter: moisture (3.95 - 13.40%), fat (1.05 - 9.34%), crude fibre (0.10 - 9.01%), crude protein (1.25 - 22.5%) and carbohydrate (65.80 - 82.60%). The results obtained from antinutrient analysis were phytate (0.10 - 1.83mg/100g) and tannins (0.00 - 1.36 mg/100g). Vitamin content obtained were vitamin A (1.06 - 7.37mg/100g), vitamin B (0.79 - 3.14mg/100g) and vitamin C (0.15 - 1.62mg/100g). Sensory evaluation of the biscuit samples showed that the products were acceptable for consumption (with respect to mouthfeel, flavour, taste, colour, texture and aftertaste) by the panelists and none of the products was rejected. However, the (100% wheat flour) sample was the most acceptable followed by the (65%“acha”, 20% pigeon pea and 15% sweet potato) sample and the (75%“acha”, 20%pigeon pea and 5% sweet potato sample. Thus, the inclusion of acha to wheat improved both the nutritional and sensory properties.
Introduction
Celiac disease and protein-energy malnutrition are major public health problems in developing countries. The demand for gluten-free product is growing as more people are diagnosed with celiac disease (gluten intolerance) and other types of gluten sensitivity according to Case 2006[1]. In patients who suffer from celiac disease, the immune system develops an autoimmune reaction against gliadin, the main protein in gluten[2] that, in turn perpetuates the destruction of villi in the small intestine[3]. Diarrhea is common in the classic form of the disease and may be accompanied by abdominal discomfort and malabsorption[4,5]. “Silent” presentations (e.g., unexplained iron deficiency and osteoporosis) and atypical presentations (e.g., fatigue, abdominal bloating, weight loss, bone and joint symptoms, and constipation) are common. The risk of celiac disease is also increased among people with autoimmune thyroid disease (3%–5%), type 1 diabetes mellitus (5%–10%) and Down syndrome (5.5%) by gluten (a protein found in wheat, rye, barley and triticale) in people who are genetically susceptible[3,6]. Gluten, which comprises roughly 78 to 85 % of the total wheat endosperm protein, is a very large complex mainly composed of polymeric (multiple polypeptide chains linked by disulphide (SS) bonds) and monomeric (single chain polypeptides) proteins known as glutenins and gliadins, respectively. The grain protein content of wheat varies between 8 and 17 %, depending on genetic make-up and external factors associated with the crop. A unique property of wheat flour is that, when in contact with water, the insoluble protein fraction forms a viscoelastic protein mass known as gluten[7].
Meanwhile, oats, buckwheat, millet, rice and quinoa are naturally gluten-free grains although none commonly grown in Nigeria (except millet and rice). These grains are safe to eat provided there has been no cross-contamination with gluten during production or preparation. Adherence to a gluten-free diet ameliorates symptoms and reduces the risk of complications such as osteoporosis and intestinal lymphoma (because the body rejects its own digestive proteins used to process gluten and produces antibody against them) as reported by[8]. There is therefore a need to utilize gluten-free flour in products as vehicle for essential nutrients from under utilized cereals (acha, millet, rice among others) which could be complemented with legumes and tuber to formulate nutrient-dense,gluten-free diet such as biscuits. The consumption of cereal snacks, such as biscuits, cookies, wafers and short bread has become very popularin Nigeria especially among children[9].
Biscuits are ready-to-eat convenient and inexpensive food products of digestive and dietary importance[10] consumed by all ages. They are also nutritive snacks produced from palatable dough that is transformed into appetizing products through the application of heat in the oven[11]. Biscuit is known to generally contain fat (18.5%), carbohydrate (78.23%), ash (1.0%), and protein (7.1%) and salt (0.85%) as reported by Okeagu 2001[12]. However, the dependence on the use of wheat flour in biscuit-making is one major constrain in Nigeria among some developing countries. The inability of the country to meet this demand calls for the research into alternative local sources of flour for baking. Such flour could be sourced from acha, pigeon pea, sweet potato, millet, sorghum among others. Nigeria is finding itself more and more caught up in the “wheat trap” where most of its foods are made from wheat, a foreign cereal[13]. Most of the common local cereal grains including acha, though having similar structure and composition were left in a state of under development and inadequate processing due to lack of attention. Effort has been made to improve the nutritional value of indigenous plant sources. The use of composite flours in bread making has been reported by many researchers[11]. Not withstanding a successful substitution of up to 15% of composite flour in the production of baked products, it would go a long way in reducing cost and enhance utilization[11]. The enrichment or fortification of biscuits and other bakery products with other protein sources such as oilseeds and legumes has received considerable attention[14].
Acha is still argonomically primitive because of its very tiny seed size resulting in difficulty[15]. Acha has high water absorption capacity that gives it the capacity to be utilized in baked foods. It also contains pentosans[16,17] which gives it the inability to form gel in the presence of oxidizing agents at room temperature with high residual protein coupled with high levels of sulphur-containing and hydrophobic amino acid residues which makes it useful in baking[18]. It is also rich in methionine, an essential amino acid vital in human health that is acting in major cereals. Acha helps in lowering the blood glucose level[19] and the subsequently reduces diabetics. The use of acha has helped to improve and increase the nutrient content thereby helping to deplete her foreign reserve.
Today, plant proteins play a significant role in human nutrition particularly in developing countries where average protein intake is less than the required. Proteins of high biological value (such as meat, egg and milk which are also referred to as animal protein) are expensive for developing countries like Nigeria, where a majority of the masses are poor[20]. Due to inadequate supplies of animal proteins, there has been a constant research for new protein sources for use as both functional food ingredients and nutritional supplements[18]. In an effort to help the third world countries reduce or stabilize their importance, the FAO in 1957 started a study on the technological feasibility of the use of composite flour for the production of biscuit bread and pastry product[17]. Most Nigerian staple foods are basically carbohydrate based, therefore in order to improve their nutritive value and enhance the health of the growing population, the use of composite flour for the production of confectionaries is very important or crucial. Composite flour is a flour made from a mixture of flours from different grains. The need for strategic development in the use of inexpensive local resources in the production of staple foods has been promoted by organizations such as the Food and Agricultural Organization (FAO) and the United Nations refugee feeding programs[21,22]. This led to the initiation of the composite flour program, the objective of which was to seek ways of substituting flours, starches and protein concentrates from indigenous crops, for as much wheat as possible in baked products[21]. Therefore, plant sources like legumes remain a cheap and indispensable source of protein though limiting in amino acids, methionine and cysteine needs to be compensated by cereal. Furthermore, most of our indigenous plant foods which are cheap sources of protein are underexploited and rarely diversified in their use as food.
Pigeon pea and sweet potato could be added to acha in order to generate a composite flour and increase its nutrient content because pigeon peas when combined with cereals make a well balanced food[23]. Pigeon pea (Cajanuscajan) belongs to the leguminoseae family of flowering plants. It is grown in African including Nigeria, India, Carribbean, and South America[24]. According to Purseglove 1991[25], the fresh immature unripe pigeon pea contains 67.4% water 7.0% protein, 0.6% fat , 20.2%, carbohydrate, 3.5% crude fibre, and 1.3% ash. When the seed is mature and dry, it contains 10.1% moisture, 19.2% protein, 1.5% fat, 57.3% carbohydrate, 8.1% crude fibre and 3.8% ash. It is also reported to be an important source of food calories and minerals[26].
Sweet potato (Ipomoea batatas) is a perennial crop grown annually[27]. It is a root crop that provides food to a large segment of the world’s population, especially in tropics where bulk of the crop are cultivated and consumed[28,29]. Sweet potatoes are good sources of vitamins C and E as well as dietary fiber, potassium, and iron, and they are low in fat and cholesterol. It serves as an important protein source for many world populations and is an important source of starch and other carbohydrates the human body needs[30]. Also, the cultivar is high in carotenoids, particularly the hydrogen carotenoid, the β-carotene[31]. β-caroteneis a potent provitamin A with 100% activity. The importance of this carotenoid in developing countries where, deficiency of vitamin A remains a serious health problem cannot be over emphasized[32]. The seeds are excellent sources of protein and has pharmacological activities such as anti-diabetic[33] and antioxidant effects[34]. The development of appealing processed products from composite flour of sweet potatoes will therefore play a major role in raising awareness on the potential of the crop. The beta carotene content would be very useful in alleviating vitamin A deficiency among children below six years and adults. The prevalence of vitamin A deficiency in Nigeria and other African countries is very high. The use of sweet potatoes as substitute for sugar would reduce the quantity of sugar needed for bread production leading to lower cost of production and price of bread and enhanced health for the consumers[35].
Studies have shown that plant foods are capable of contributing appreciable quantities of nutrients needed by both children and adults, if properly processed and blended. However, adequate processing and correct blending of flour using acha, pigeon pea, and sweet potato would produce rich composite flour. It will therefore be of economic importance, if our local raw materials could be used in certain proportions to increase nutrients in biscuits. This would however, not only minimize our foreign exchange but would encourage our farmers to produce or grow more crops.Therefore, main aim of the study was to produce composite flour from acha, pigeon pea and sweet potato blends; formulate biscuits from the blends and evaluate their acceptability nutritionally, microbiologically and organoleptically.
Materials and Methods
Raw Material Procurement: Acha (Digitariaexilis), pigeon pea (Cajanuscajan), sweet potato (Ipomoea batatas), granulated sugar, baking powder, full cream milk, salt, baking fat and vanilla were purchased from Ogige market in Nsukka town, Enugu State, Nigeria.
Processing of Acha: Acha grains were processed into flour using the method described by Olapade, et al. 2010[36]. The grains of acha were cleaned by removing stones, dirt, husks and other foreign materials from acha by handpicking. Acha grains were then washed with water for further cleaning of the acha grains. After washing of the acha, it was then dried at a temperature of 50ºC for four hours. The acha was then dry milled using a hammer mill (Thomas Wiley Mill model ED-5) and sieved to pass through 0.2 mm mesh to produce acha flour. Acha flour was then packaged in an airtight container in order to prolong the shelf life of the flour (Figure 1).
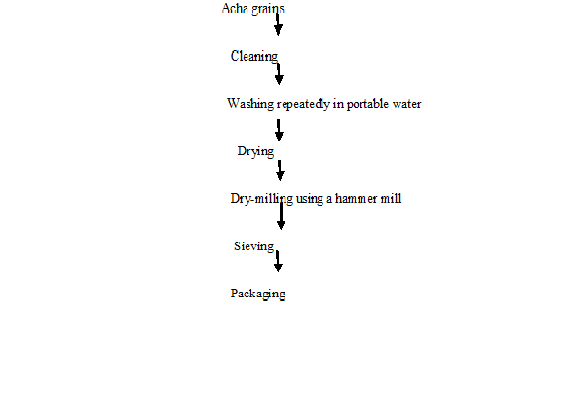
Figure 1: Flow chart for production of acha grains into flour. Source: Olapade et al. (2010).
Processing of Pigeon Pea: The unit operations involved in the processing of pigeon pea into flour included cleaning, soaking, with 1% acid, dehulling, wet milling and drying milling as described by Onyemelukwe 1992[37]. Cleaning removed the damaged insect and infested seeds from the desirable ones. Other contaminants such as dirt, husks, stores and other foreign materials were removed by hand picking and aspiration. The cleaned pigeon pea seeds were soaked in 1% aqueous citric acid. The ratio of each legume to citric acid solution is 1:3. The treatment with citric acid was done basically to reduce the beany flavor. The soaking operation lasted for 12 hours and citric acid was changed every three hours. Dehulling was done by rubbing the soaked pigeon pea seeds in between the palms. Floatation technique was used to separate the husk from the seeds. After the separation, the seeds were washed several times with fresh water in order to remove the sour taste impaired by the citric acid. The dehulled seeds were wet-milled. The pigeon pea waste was then packaged in heat resistant polythene bags flattened and boiled for one and a half hour. The aim of steaming was to cook the various pastes for the production of biscuits and also to eliminate antitrypsin. The steamed pigeon pea gel was then cut into pieces and dried at 55ºC. The product was dried milled to be coarse. The milled product was cooled and then stored in polythene bags (Figure 2).
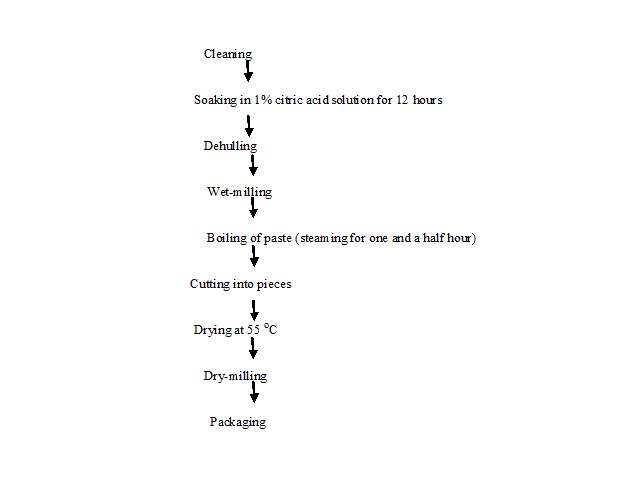
Figure 2: Flow chart for production of pigeon pea flour[37].
Processing of Sweet Potato Tubers into Flour: According to modified method of Odedeji and Adeleke (2010)[38]. The unit of operations involved were selection (sorting and grading), peeling, washing, chopping, soaking, drying, milling (flour form), sieving and packaging. It was usually sorted to remove bad ones from the lot. It was then peeled to remove any soil on the roots using a clean kitchen knife. It was washed to remove adhering soil, dirt and extraneous matters. A drum washer consists of a 200 litre oil drum mounted on a horizontal axle. The drum was cut length wise to provide a door which can be opened and closed during loading and washing respectively. The drum was used to wash 40 kg of sweet potato in 10 minutes using 30 litres of water. After washing, it was pre-dried in a clean place for about 10 minutes to remove the surface water and facilitate ease milling operation. A manual or mechanical slicer or chopper was then used to cut it into uniform pieces of about 5 mm thick. Slices were soaked in clean water containing 1% NaCl and in a solution containing potassium metabisulphite (1%) and citric acid (0.5%) for 30 minutes. The volume of water used was twice the weight of the slices and was enough to cover all the slices. It was then dried on a stainless steel perforated tray and dried in a cabinet dryer at 65ºC for eight hours. After drying, the sliced sweet potato was milled into flour using a hammer mill (Thomas Wiley Mill model ED-5). It was then sieved into fine flour before packaging and storage using 1 mm pore size sieve. It was safely packed and stored in polyethylene bags. The use of black packing material helped to minimize the loss of vitamin A that can be degraded through exposure to ultraviolent light during storage. It was stored in cool, dry well ventilated place (Figure 3).
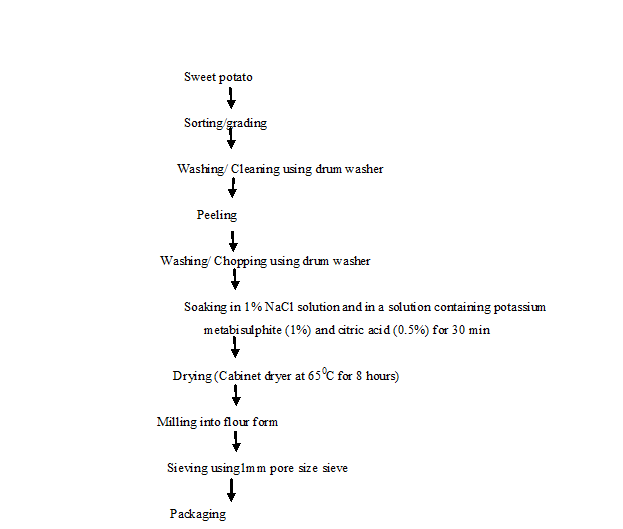
Figure 3: Flow chart for production of orange fleshed sweet potato flour. Source: Modified Odedeji, and Adeleke, (2010).
Composite Flour Formulation: Composite flour formulation was prepared from a blend of acha, pigeon pea and sweet potato in the ratio of 80:20:0; 75:20:5; 65:20:5; 60:20:20 and 55:20:25[15,38,39]. The composite flour with recipe containing sugar (60 g) baking powder (1%), milk (25 g), flavor (2 g), fat (76 g) salt (2 g) and water (50 ml) for the production of different biscuit samples. The various blends were formulated at various percentages and biscuits were produced from these formulations using the method of Ihekoronye (1999)[40]. The varying proportions of flour were weighed and mixed together with the dry ingredients (sugar, baking powder, water, baking fat, vanilla, salt and milk). The dry ingredients were first weighed and mixed before the addition of butter and then creamed. Water was added and mixed properly, until the desired thickness was achieved. The batter was later cut into a circular shape using a biscuit cutter. The formed biscuit is baked in the oven at a temperature of 185ºC for 15-20 minutes, cooled and packaged (Figure 4).
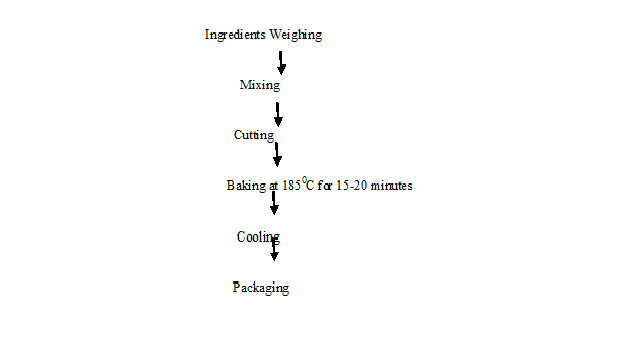
Figure 4: Flow chart for biscuit production. Source: Faris and Singh, 1990; Ayo et al., 2010; Odedeji and Adeleke, 2010.
Proximate Analysis of Raw Materials and Formulated Biscuits Determination of Moisture Content: This was determined in triplicate by hot air oven method in an indirect distillation method. According to AOAC (2010)[41] method, 3 g each of the biscuit sample was weighed using a digital balance (Model number: No. JT 320N) into a cleaned, dried, cooked and weighed crucible. The sample which was in the crucibles was transferred into a hot air oven (Gallen Kamp Oven) at 150ºC and dried for 2 hours. The crucible was weighed periodically until constant weights were obtained. The percentage of moisture was calculated as follows:
(w2 - w3) 100
% Moisture = -------------- x ---
(w2 - w 1) 1
Where;
W1 = Initial weight of empty crucible;
W2 = Weight of crucible + food before drying
W3 = Final weight of crucible + food after drying;
% Total solid (dry matter) = 100 - % moisture
Crude Fibre Determination: The crude fibre was determined using the method described by AOAC (2010)[41]. About 2 g of each of the sample was weighed on a digital balance, boiled under reflux for 30 minutes with 200 ml of a solution containing 1.25 g of H2SO4 per 100 ml of solution which was put into a 250 ml beaker. Then filter through a muslin cloth on a fluted tunnel and wash with hot water for 2 times. The residue was transferred into a 250 ml beaker and boiled for 30 minutes with 200 ml of a solution containing 1.25 g of carbonate free of NaOH per 100 ml. The final residue was then filtered through a muslin cloth and dried using GallenKamp oven. The final residue was ashed in a furnace and put into the desiccator to cool and it was weighed using a digital balance;
(w2 - w3) 100
Crude fiber = -------------- x -----
w1 1
W1 = Weight of the sample
W2= Weight of the sample before ashing
W3 = Weight after ashing
Crude Fat Determination: Crude fat was determined using Soxhlet extraction method as described by AOAC (2010)[41]. A 250 ml clean boiling flask was dried in an oven at 100ºC using hot air oven. About 3 g of the sample was weighed (using a digital balance, Model number: No. JT 320N) into thimble. The thimble and its content was placed in the extraction apparatus and extraction was with ethyl ether in Soxhlet extractor for 6–8 h at a condensation rate of at 3–6 drops per second. During this process, the fat is extracted and transferred into a preweighed evaporated dish. The petroleum ether was recovered by evaporation using a bath and the remaining fat in the flask was dried in the oven at 80ºC for 30 minutes and cooled in a dessicator and finally weighed using digital balance. The difference in the weight of the empty flask and the flask with oil gave the oil content was be calculated as percentage fat content;
(C - B) 100
% Crude fat = ------------ x -------
A 1
A = Weight of sample
B = Weight of empty flask
C = Weight of flask + oil
Crude Protein Determination: The crude protein content of the sample was determined by the semi-microKjeldahl technique as described by AOAC (2010)[41]. About 1.0 g of the sample put into a Kjeldahl flask and 3.0 g of hydrated cupric sulphate (catalyst) was added into the flask. Approximately 20 ml of anhydrous sodium sulphate and 1.0 g of concentrated sulphric acid (H2SO4) was added to digest the samples which was topped and swirled. The flask and liquid was clear and free of coloration. The clear solution was then cooled and made up to 100 ml with distilled water and a digest of about 5 ml was collected for distillation. Then, 5 ml of 60% sodium hydroxide solution was put into the distillation flask and distilled for some minutes. Boric acid indicator absorbed the ammonia which was distilled off and this was filtrated with 0.1 ml hydrochloric acid (HCl). The filter value or the end point at which the colour changes from green to pink was taken. The crude protein was calculated as:
Percentage crude protein = 0.001410 x 6.25 x 25 x T x 100
Where: T = Titre value
Micronutrient Determination ofRaw Materials and Formulated Biscuit
Determination of Vitamin A: Vitamin A was determined using colometric method and trifluoacetic acid (TFA) as described by Snell and Snell (1953)[42]. Then, 1.0 g of the sample was extracted in 20 ml of petroleum ether and 1 ml of the extracted sample after maceration and filtration was heated to dryness using a water bath just at the point of dryness. The residue was redissolved and dehydrated by addition of 0.2 ml of a mixture of chloroform acetic anhydride (1.1 μg/mg). The tubes were capped to minimize evaporation and to protect from light. Then, 2 ml of trifluoacetic acid chloroform was added at exactly 30 seconds after addition of the reagent. Absorbance readings were recorded using spectrophotometer at 620 nm which was preset at zero absorbance with a blank consisting of 0.1 ml chloroform anhydride mixture and 1.0 ml trifluoacetic chloroform reagent.
Absorbance of text x dilution factor
Vitamin A = ----------------------------------
Slope from s tan dard curve
Determination of Vitamin B1 (Thiamine): The Vitamin B1 content was determined using the colorimetric method as described by Pearson (1976)[43]. About 0.5 g of the sample was weighed using digital balance and dissolved in 20 ml distilled water. Then, 2 ml of the dissolved sample was mixed with 18 ml of a mixture of 1% potassium ferrocyanide and stirred for one minute. About 1 ml of the solution was pipette into a separate test tube. After shaking, 15 ml of isobutyl alcohol was added, the mixture was shaken for 2 minutes. The isobutyl sulphate, absorbance was determined at 367 nm using isobutyl alcohol as a blank
Absorbance of text x dilution factor
Thiamine = ---------------------------------------
Slope (from s tan dard curve)
Determination of Vitamin C: Vitamin C determination was done using Pearson (1976)[43] method. About 1 g of the sample was macerated with 20 ml of oxalic acid and 0.4% oxalic acid and centrifuged for 5 minutes. Then, 1 ml of sample was collected, put in test tube and 9 ml indophenols reagent was added. The absorbance was obtained at 520 nm.
Antinutrient Determination of the raw material and Formulated Biscuits
Determination of Tannin: Tannin was determined according to Pearson (1976)[43] method. One gram (1 g) of the sample was weighed into a conical flask and 10 ml of distilled water was added. Then, the mixture was allowed to stand for 30 minutes at room temperature with gentle shaking at every five minutes interval. At the end of 30 minutes, the mixture was centrifuged and 2.5 ml of the supernatant was measured into separate tannin solution. The tannin solution was measured into a separate 50 ml volumetric flask. Similarly, 2.5 ml of standard tannin solution was measured into separate 50 ml flask (1 ml) of Fokin-Den reagent which was added into each flask followed by 2.5 ml of saturated Na2CO3 solution. The solution was made up to the mark and incubated for 90 minutes at room temperature and absorbance reading was taken at 250 nm wavelength. The percentage tannin was calculated thus:
An x 100 x W x Vf
% Tannin = -----------------------
As x Va
Where: An = Absorbance of test sample.
As= Absorbance of the standard.
C = Concentration of standard.
Vf = Total volume of extract.
Va = Volume of extract analyzed.
Phytate Determination: Phytate was determined using Oberlas (1973)[44] method. One gram was extracted with 0.2 NHCl. One milliliter extract was pipetted into a test tube and 2 ml of the solution (2) was added and the test tube was covered. The tube was heated in boiling water for 30 minutes then cooled at room temperature. Four milliliters (4 ml) of solution (3) was iron III sulphate. The weighed 0.2 g was added into 100 ml of 2NHCl and made up to 100 ml with distilled water. In solution (3), 10 g bipyridine and 10 ml thioglycollic acid were added to the distilled water and made up to 1000 ml.
Microbiological Analysis
Total viable and mould count was determined using Harrigan and McCance(1976)[45]. About 1 g of the test sample was soaked in 9 mls of sterile water. The suspension was agitated constantly for 10 minutes. Then, 10-folds of serial dilution technique was performed by diluting 1 ml of test sample suspensions in 9 mls of sterile water. This dilution was performed up till the 7th test tube. Using a permanent marker, the oven-dried agar plate was divided into eight equal segments with the aid of Pasteur’s pipette, a 0.02 ml of the dilution from 10-1 was transferred to each segments of the plate. This was also repeated from 10-2 to corresponding agar plate (Nutrient agar for total viable count and Sabourauddextose agar for mould). This was repeated up till the 10-7 dilution. The plates were allowed to stand for 15 minutes before incubation and were incubated in inverted positioning at 37°C for 24 hours for bacteria growth and at 25°C for 48 hours for mould growth. After the incubation period, the plates were observed and the colonies were counted.
1
Mean colony count per drop x -------------
diluation factor
Original Cell Population = ----------------------------------------------------------
Estimated volume per drop
Sensory Evaluation of the Formulated Biscuit
The organoleptic properties (mouthfeel, flavour, taste, colour, texture, aftertaste and overall acceptability) of the biscuit were assessed by a 20-semitrained member panelist who were familiar with the biscuit using a nine-point Hedonic scale with one representing the least score (dislike extremely) and nine, the highest score (like extremely) according to Ihekoronye and Ngoddy (1985)[46].
Data Analysis and Experimental design
Data was analyzed using one-way analysis of variance (ANOVA) based on completely randomized design. Mean separation was by Duncan’s New Multiple Range Testand SPSS (Statistical Package for Social Science) version 20 computer was used. Significance was accepted at p < 0.05[47].
Results and Discussion
Proximate Composition (%) Flour Blends (“Acha”, Pigeon pea and Sweet potato) and their Products (Biscuits)
The moisture content in (Table 1) ranged from 3.95e ± 0.30% (SampleA-Biscuit from 80% “Acha”: 20% pigeon pea) to 13.40a ± 1.37% (Sample J-Wheat flour) and all the samples were significantly (p < 0.05) different. Sample J was higher than the other samples due to the increase in the protein content. Protein particularly, from cereals have been noted to have high affinity for moisture[48]. According to Sefa-dedeh and Afoakwa (2001)[49], the starch content of wheat flour absorbs moisture quickly and also the anhydrous starch ranked first in the moisture absorbed at 60% moisture content in one hour. The moisture content of the flour and flour blends decreased significantly (p < 0.05) with corresponding increase in sweet potato flour content. Sample A (Biscuit from 80% “acha”: 20% pigeon pea) has the least moisture content which is due no addition of sweet potato flour. The moisture content was similar to that obtained by Srivastava, et al. (2012)[50] who got 7.9 percent for the sweet potato biscuit. The moisture content of the product (biscuit) was found to comply with the regulations of the National Agency for Food and Drug Administration and Control[51] that specifies 6% as the maximum moisture content of baked and extruded products. The low moisture content of the product (biscuit) was attributed to the subsequent baking of the product in the oven. It also implied that the water activity of the product is low and therefore it would have a long shelf life in water and air-proof package.
Table 1: Proximate composition of flour blends from acha pigeon pea, wheat and sweet potato blends and their products (biscuit)
| Samples | Moisture (%) | Fat (%) | Crude fibre (%) | Crude protein (%) | Carbohydrate (%) |
|---|---|---|---|---|---|
| A | 3.95e ± 0.30 | 1.39d ± 0.39 | 6.30c ± 0.18 | 7.12d ± 3.21 | 81.22a ± 0.14 |
| B | 3.96e ± 0.70 | 1.29de ± 0.16 | 6.90b ± 0.22 | 6.14de ± 0.30 | 81.71a ± 0.05 |
| C | 4.73cd ± 0.41 | 9.34bc ± 0.18 | 6.62c ± 0.93 | 5.90e ± 0.81 | 73.41c ± 0.45 |
| D | 5.60c ± 0.70 | 1.71cd ± 0.39 | 7.06b ± 0.60 | 6.42ab ± 0.55 | 78.67ab ± 0.04 |
| E | 3.76f ± 0.38 | 1.27e ± 0.47 | 9.01a ± 0.25 | 8.11cd ± 0.39 | 77.85b ± 0.12 |
| F | 5.06c ± 0.11 | 1.06f ± 0.05 | 1.40e ± 0.02 | 12.5c ± 0.25 | 79.44ab ± 0.01 |
| G | 6.12ab ± 0.10 | 1.80c ± 0.15 | 1.40e ± 0.20 | 9.50cd ± 0.30 | 71.80d ± 0.01 |
| H | 9.21b ± 1.37 | 1.50cd ± 0.41 | 0.80f ± 0.54 | 1.25f ± 0.05 | 76.29b ± 0.02 |
| I | 11.60ab ± 1.05 | 1.40d ± 0.33 | 0.10g ± 0.50 | 22.50a ± 0.30 | 65.80de ± 0.11 |
| J | 13.40a ± 1.37 | 1.30de ± 0.46 | 0.40f ± 0.25 | 12.60bc ± 0.37 | 71.60d ± 0.05 |
Values represent mean ± standard deviation of triplicate determinations. Values bearing the same superscripts within the same row are not significantly (p > 0.05) different from each other.
A = Biscuit from 80% “Acha”, 20% Pigeon pea; B = Biscuit from 75% “Acha”, 20% Pigeon pea, 5% Sweet Potato; C = Biscuit from 65% “Acha”, 20% Pigeon pea, 15% Sweet Potato; D = Biscuit from 60% “Acha”, 20% Pigeon pea, 20% Sweet Potato; E = Biscuit from 55% “Acha”, 20% Pigeon pea, 25% Sweet Potato; F = Biscuit from 100% “Acha” flour (Control); G = Biscuit from 100% Wheat flour (Control); H = “Acha” flour; I = Pigeon pea flour; J = Wheat flour; K = Sweet Potato flour; L = Flour blends from 80% “Acha”, 20% Pigeon pea; M = Flour blends from 75% “Acha”, 20% Pigeon pea, 5% Sweet Potato; N = Flour blends from 65% “Acha”, 20% Pigeon pea, 15% Sweet Potato; O = Flour blends from 60% “Acha”, 20% Pigeon pea, 20% Sweet Potato; P = Flour blends from 55% “Acha”, 20% Pigeon pea 25% Sweet Potato
The crude fat content of the samples ranged from between 1.05f ± 0.04% (Sample O -Flour blends from 60% “acha”: 20% pigeon pea: 20% sweet potato) to 9.34a ± 0.18% (Sample C Biscuit from 65% “acha”: 20% pigeon pea: 15% sweet potato) in Table 1. The fat content of the biscuit samples were significantly (p < 0.05) different. Sample C (Biscuit from 65% “acha”: 20% pigeon pea: 15% sweet potato) had the highest fat content than the other samples. The fat content is optimal for the maximum crispness and low enough to discourage the onset of rancidity[52]. The crude fibre content of the samples ranged from 0.10f ± 0.50% (Sample I - pigeon pea flour) to 9.01a ± 0.25% (Sample E - Biscuit from 55% “acha”: 20% pigeon pea: 25% sweet potato). Sample E (Biscuit from 55% “acha”: 20% pigeon pea: 25% sweet potato) had the highest crude fibre content of 9.01a ± 0.25% which was significantly (p < 0.05) different from the two controls which are sample F (Biscuit from 100% “Acha” flour and sample G (Biscuit from 100% Wheat flour (control) having the same value for crude fibre content which was 1.40de ± 0.02% for sample F (Biscuit from 100% Wheat flour) and 1.40de ± 0.20% for sample G (Biscuit from 100% Wheat flour (Control). This result agreed with the findings of Otegbayoet al. (2002)[53] which was 1.43%. The low crude fibre content of in Sample I (Pigeon pea flour) could probably be due to the effective processing of the grain. This result was an indication that the product (biscuit), flour and flour blends could be good sources of dietary fibre. The fiber content of biscuit increased significantly, due to higher fiber content of sweet potato flour. According to Srivastava, et al. (2012)[48], as fiber absorbs large amount of water, it gives a sensation of fullness (having an appetite completely satisfied). Therefore, this product (biscuit) had a potential for alleviating some dietary related disease such as obesity, coronary heart disease and arteriosclerosis[19].
The crude protein content of the samples ranged from 1.25f ± 0.03% (Sample H -“acha” flour) to 22.5a ± 0.30% (Sample I - pigeon pea flour). Samples I (Pigeon pea flour) has a crude protein content higher than the controls. The crude protein of samples was 22.5% which agreed with Oyenuga (2000)[54] result which was about 23.8%. It complimented the lower protein content of the both the formulated biscuits and flour blends. The increase in the protein content was because legumes are noted to be a good source of protein[55]. This result indicates that the aim of enrichment was to increase the protein content. These findings were in agreement with the work of Kolapo and Sanni (2005)[56], on processing and characteristics of soybean fortified tapioca. This similar observation was made by Akubor and Ukwuru (2005)[57], who showed an increase in the protein content with corresponding increase in the proportion of breadfruit flour supplementation in biscuit production from wheat bread fruit flour blends, hence the use of mushroom to raise the protein content to more than 12% as compared with cookies made from only from wheat flour. This similar observation was made in a research study by Oluwole and Karim (2005)[58] which showed an increase in the protein content with corresponding increase in the proportion of bambara flour supplementation in biscuit production from cassava-wheat-bambara flour blends. It also contained antioxidants called lignin which are also anti-carcinogenic and contains phytosterol which blocks cholesterol production[48]. The product (biscuit), flour and flour blends had the potential of alleviating protein malnutrition in developing countries.
Table 1 shows the carbohydrate content (%) ranged from 65.80de ± 0.11% (Sample I - Pigeon pea flour) to 82.60a ± 0.05v% (Sample N - Flour blends from 65% “acha”: 20% pigeon pea: 15% sweet potato). There were significant (p < 0.05) differences among the samples. The carbohydrate content of sample I (Pigeon pea flour) is favorably compared with the Oyenuga (2000)[54] value which was 64.4% implying that the biscuits are good source of energy needed for body metabolism. Sample N (Flour blends from 65% “acha”: 20% pigeon pea: 15% sweet potato) had the highest value for carbohydrate content of about 82.60% and sample I (pigeon pea flour) had the lowest carbohydrate as a result of added pigeon pea which had low carbohydrate content which had been observed in similar research works using legumes (Ayo, 1998)[17]. The relatively high carbohydrate content of the product (biscuit), flour and flour blends made it a cheap source of energy, since it is a good source of energy. Human needs food energy to cover the basal metabolic rate, the metabolic response to food, the energy cost of physical activities, accretion of new tissue during growth and pregnancy as well as the production of milk during lactation[59].
Micronutrient Composition (mg/100g) of Formulated Biscuit and Flour Blends from “Acha”, Pigeon Pea and Sweet Potato
The result of the micronutrients (Vitamin A, B and C) determined for each sample is presented in Table 2. Vitamin A ranged from 1.05 ± 0.02f mg/100 g (Sample M - Flour blends from 75% “acha”: 20% pigeon pea: 5% sweet potato; sample N - Flour blends from 65% “acha”: 20% pigeon pea: 15% sweet potato) to 7.37a ± 0.72 mg/100 g (Sample D - Biscuit from 60% “acha”: 20% pigeon pea: 20% sweet potato). Vitamin B ranges from 0.79e ± 0.26 mg/100 g (Sample C - Biscuit from 65% “acha”: 20% pigeon pea: 15% sweet potato) to 3.14 ± 0.02a mg/100 g (Sample N - Flour blends from 65% “acha”: 20% pigeon pea: 15% sweet potato). Vitamin C ranged from 0.15e ± 0.23 mg/100 g (Sample D - Biscuit from 60% “acha”: 20% pigeon pea: 20% sweet potato) to 1.62a ± 0.18 mg/100 g (Sample K-sweet potato flour). The formulated biscuit samples which had sweet potato flour added to the flour content had higher vitamin content. Sample D - (Biscuit from 60% “acha”: 20% pigeon pea: 20% sweet potato) had the highest value for vitamin A which is about 7.37a ± 0.72 mg/100 g. Sample G (Biscuit from 100% Wheat flour - Control) had the highest value for vitamin B which is about 2.75a ± 0.39 mg/100 g. Sample K (sweet potato flour) had the highest value for vitamin C of 1.62a ± 0.18 mg/100 g. Sample B (Biscuit from 75% “acha”: 20% pigeon pea: 5% sweet potato; Sample C (Biscuit from 65% “acha”: 20% pigeon pea: 15% sweet potato); Sample D (Biscuit from 60% “acha”: 20% pigeon pea: 20% sweet potato) and Sample E (Biscuit from 55% “acha”: 20% pigeon pea: 25% sweet potato) had increased micronutrient in the final product due to the addition of sweet potato flour. There was significant (p > 0.05) difference in all of the vitamin contents.
Table 2: Micronutrient Composition of formulated biscuit and flour Blends from “acha”, pigeon pea and sweet potato.
| Samples | Vitamin A(mg/100g) | Vitamin B (mg/100g) | Vitamin C (mg/100g) |
|---|---|---|---|
| A | 3.52d ± 0.59 | 1.50c ± 0.50 | 0.64c ± 0.58 |
| B | 4.62d ± 0.35 | 1.85bc ± 0.14 | 0.32d ± 0.4 |
| C | 5.41c ± 1.79 | 0.79e ± 0.26 | 0.92b ± 0.29 |
| D | 7.37a ± 0.72 | 2.35b ± 0.61 | 0.15e ± 0.23 |
| E | 6.49b ± 0.04 | 1.86bc ± 0.30 | 0.62c ± 0.66 |
| F | 4.65c ± 0.83 | 1.66c ± 0.34 | 0.30d ± 0.19 |
| G | 1.06f ± 0.19 | 2.75ab ± 0.39 | 0.19e ± 0.09 |
| H | 1.46de ± 0.76 | 0.84d ± 0.17 | 0.15e ± 0.01 |
| I | 1.48e ± 0.18 | 1.50c ± 0.30 | 0.57cd ± 0.31 |
| J | 4.66d ± 0.05 | 0.83de ± 0.25 | 0.43d ± 0.15 |
| K | 5.03c ± 0.01 | 0.81d ± 0.20 | 1.62a ± 0.18 |
| L | 0.73e ± 0.07 | 1.73c ± 0.02 | 0.39d ± 0.01 |
| M | 1.05f ± 0.02 | 0.97d ± 0.00 | 0.63c ± 0.00 |
| N | 1.21de ± 0.04 | 3.14a ± 0.02 | 0.50cd ± 0.02 |
| O | 0.52e ± 0.01 | 2.74ab ± 0.05 | 0.75c ± 0.11 |
| P | 1.26de ± 0.08 | 1.90bc ± 0.22 | 1.00b ± 0.10 |
Values represent mean ± standard deviation of triplicate determinations. Values bearing the same superscripts within the same row are not significantly (p > 0.05) different from each other.
A = Biscuit from 80% “Acha”, 20% Pigeon pea; B = Biscuit from 75% “Acha”, 20% Pigeon pea, 5% Sweet Potato; C = Biscuit from 65% “Acha”, 20% Pigeon pea, 15% Sweet Potato; D = Biscuit from 60% “Acha”, 20% Pigeon pea,20% Sweet Potato; E = Biscuit from 55% “Acha”,20% Pigeon pea, 25% Sweet Potato; F = Biscuit from 100% “Acha” flour (Control); G = Biscuit from 100% Wheat flour (Control); H = “Acha” flour; I = Pigeon pea flour; J = Wheat flour; K = Sweet Potato flour; L = Flour blends from 80% “Acha”, 20% Pigeon pea; M = Flour blends from 75% “Acha”, 20% Pigeon pea, 5% Sweet Potato; N = Flour blends from 65% “Acha”, 20% Pigeon pea, 15% Sweet Potato; O = Flour blends from 60% “Acha”, 20% Pigeon pea, 20% Sweet Potato; P = Flour blends from 55% “Acha”, 20% Pigeon pea 25% Sweet Potato
According to Adeyemi and Idowu(2000)[60] as well as Fellow(2000)[61], vitamin retention in baked products is affected by temperature. However, in this study all the formulated biscuit samples were subjected to heat treatment, therefore variation in the vitamin contents retention were probably attributed to the composition and addition of sweet potato flour. The retention of pro-vitamin A after baking was attributed to the fact that vitamin A is a fat soluble vitamin and is relatively heat resistance when compared to the water soluble counterparts. The observed stability agreed with the report of Okafor (2010)[62] who noted that Vitamin A exhibits good stability. The high content of vitamin C in sample K (sweet potato flour) was probably due to the fact that it could undergo non-enzymatic oxidation resulting in the formation of brown pigments (Omojiba, 2000)[63] and also it was not sulphited, since sulphite destroys vitamin content.
Antinutrient Composition (mg/100 g) of Formulated Biscuit, Flour and Flour Blends
The phytate content of the samples ranged from 1.83a ± 0.64 mg/100 g (Sample J- wheat flour) to 0.10f ± 0.03 mg/100 g (Sample P) in Table 3. There was no significant increase in samples E and H. Sample J (wheat flour) has the highest value of 1.83a ± 0.64 (mg/100 g). The result showed that there was significant (p >0.05) difference in phytic acid content of the samples. The low level of phytic acid would ensure availability of divalent cation[33]. According to Osman (2007)[64], soaking, cooking and milling during processing of legumes improves the nutritional value of the product (biscuit) thereby, reducing phytic acid and trypsin inhibitors.The tannin content (Table 3) of the samples ranges from 1.36a ± 0.05 Sample P (Flour blends from 55% “Acha”, 20% Pigeon pea 25% Sweet Potato) to 0.00b ± 0.00 (Sample A to H) mg/100 g. Samples A to H did not contain any tannin content. The absence of tannin could be attributed to the effect of milling, soaking and heating during processing of the product[65]. According to Allonso, et al.(2000)[66], dehulling of legumes greatly reduces condensed tannin and polyphenol.
Table 3: Antinutrient Composition of Formulated Biscuits and Flour Blends.
| Samples | Tannin(mg/100g) | Phytate(mg/100g) |
|---|---|---|
| A | - | 0.21e ± 036 |
| B | - | 0.59cd ± 0.37 |
| C | - | 0.26de ± 0.16 |
| D | - | 0.46d ± 0.18 |
| E | - | 0.16f ± 0.10 |
| F | - | 0.23e ± 0.11 |
| G | - | 0.28de ± 1.77 |
| H | - | 0.16f±0.76 |
| I | 0.46b ± 0.30 | 0.91b ± 0.13 |
| J | 0.23c ± 0.15 | 1.83a ± 0.64 |
| K | 0.13cd ± 0.15 | 0.63c ± 0.13 |
| L | 0.30c ± 0.10 | 0.57cd ± 1.09 |
| M | 0.51b ± 0.60 | 0.62c ± 0.07 |
| N | 0.11cd ± 0.01 | 0.39d ± 0.50 |
| O | 0.20c ± 0.00 | 0.25de ± 0.26 |
| P | 1.36a ± 0.05 | 0.10f ± 0.03 |
Values represent mean ± standard deviation of triplicate determinations. Values bearing the same superscripts within the same row are not significantly (p >0.05) different from each other.
A = Biscuit from 80% “Acha”, 20% Pigeon pea; B = Biscuit from 75% “Acha”, 20% Pigeon pea, 5% Sweet Potato; C = Biscuit from 65% “Acha”, 20% Pigeon pea, 15% Sweet Potato; D = Biscuit from 60% “Acha”, 20% Pigeon pea, 20% Sweet Potato; E = Biscuit from 55% “Acha”, 20% Pigeon pea, 25% Sweet Potato; F = Biscuit from 100% “Acha” flour (Control); G = Biscuit from 100% Wheat flour (Control); H = “Acha” flour; I = Pigeon pea flour; J = Wheat flour; K = Sweet Potato flour; L = Flour blends from 80% “Acha”, 20% Pigeon pea; M = Flour blends from 75% “Acha”, 20% Pigeon pea, 5% Sweet Potato; N = Flour blends from 65% “Acha”,20% Pigeon pea, 15% Sweet Potato; O = Flour blends from 60% “Acha”, 20% Pigeon pea, 20% Sweet Potato; P = Flour blends from 55% “Acha”, 20% Pigeon pea 25% Sweet Potato; - = Not detected
Sensory Scores of Formulated Biscuits from “Acha”, Pigeon pea, Wheatand Sweet Potato Blends
The sensory scores shown in Table 4 revealed that all the samples were not significantly different (p > 0.05) in terms of appearance, colour, flavour, taste, texture, mouthfeel, aftertaste and overall acceptability. However, sample G (Biscuit from 100% Wheat flour-control) had the highest mean scores for colour, appearance, flavor, taste, texture, mouthfeel, after taste and overall acceptability. The highest mean scores for the biscuits showed that they were of good quality. About 75% of the panelists liked all the biscuits for their good mouthfeel but had reservations about sweetness. However, the excessive sweetness could be improved by reducing the sugar content. The reduction of sugar content could minimize hardness or undesirable texture of the biscuits[67].
Microbiological Count of Formulated Biscuit, Flour and Flour Blends from “Acha”, Pigeon pea, Wheat and Sweet PotatoBlends
From the results of the total viable count (Table 5), it showed that there was no spoilage or growth of micro-organisms for Samples A,C,D,E,F and G probably due to the action of heat during baking.The counts were minimal although the total viable count of Samples J, H and K showed slight detection of growth of microbes. However, from mould count, there was no growth of micro-organisms in samples A, B, C, D, E, F, G, J, K and P due to the application of heat during baking which led to the destruction of the micro organisms present. This result agreed with the microbiological regulation or standards of the National Agency for Food and Drug Administration[51] which stated that all baked and flaked products should not contain more than 103 cfu/g of aerobic mesophilic bacteria or total viable counts (TVC). However, since micro organisms play significant role in the determination of shelf lives of food products, they are usually responsible for spoilage of many food items. The product should however be well kept after processing in suitable packaging materials capable of preventing contamination and hence subsequent proliferation of spoilage micro organisms[11]. Also, there were no observable coliform and yeast/mould growths from all the cookie samples as observed by Ndife, et al. 2014[68] in the production of cookies from whole wheat and full fat soya. This eliminates the possibility of faecal contamination in the different cookie samples, which is pointer to good production and handling practice. This could also be due to the dry nature of the cookie samples[69].
Table 4: Sensory Scores of Biscuits Produced from Acha, Pigeon pea, Wheat and Sweet Potato Flour.
| Sensory Attributes | A | B | C | D | E | F | G |
|---|---|---|---|---|---|---|---|
| Appearance | 7.35ab ± 0.81 | 6.90b ± 1.07 | 7.45ab ± 0.69 | 7.15ab ± 1.30 | 7.15ab ± 1.09 | 7.15ab ± 0.75 | 7.65a ± 1.04 |
| Colour | 7.35b ± 0.93 | 7.20b ± 0.89 | 7.45b ± 0.76 | 7.25b ± 1.02 | 7.05b ± 1.28 | 6.85b ± 1.25 | 8.10a ± 0.91 |
| Flavour | 7.15b ± 0.88 | 7.50ab ± 0.95 | 7.45ab ± 0.94 | 7.05b ± 1.15 | 7.05b ± 1.36 | 6.95b ± 1.27 | 8.10a ± 0.79 |
| Taste | 6.95c ± 1.10 | 7.50abc ± 0.69 | 7.75ab ± 0.97 | 7.30abc ± 0.98 | 6.85c ± 1.27 | 7.15bc ± 1.50 | 7.95a ± 0.76 |
| Texture | 7.10b±1.48 | 7.15b ± 1.09 | 7.10b ± 1.12 | 7.05b ± 0.10 | 6.75b ± 1.12 | 7.20b ± 1.20 | 8.15a ± 0.81 |
| Mouthfeel | 7.05b ± 1.34 | 7.10b ± 1.30 | 7.30b ± 1.17 | 7.10b ± 0.91 | 6.95b ± 0.89 | 6.85b ± 1.27 | 8.15a ± 0.99 |
| Aftertaste | 7.40b ± 1.19 | 7.60b ± 0.82 | 7.75b ± 0.97 | 7.20b ± 1.11 | 7.35b ± 1.33 | 7.25b ± 1.33 | 8.50a ± 0.76 |
| Overall acceptability | 7.40b ± 1.19 | 7.55b ± 0.76 | 7.75ab ± 0.97 | 7.20b ± 1.12 | 7.35b ± 1.33 | 7.25b ± 1.32 | 8.40a ± 0.82 |
Values represent mean ± standard deviation of triplicate determinations. Values bearing the same superscripts within the same row are not significantly (p > 0.05) different from each other.
A = Biscuit from 80% “Acha”, 20% Pigeon pea; B = Biscuit from 75% “Acha”, 20% Pigeon pea, 5% Sweet Potato; C = Biscuit from 65% “Acha”, 20% Pigeon pea, 15% Sweet Potato; D = Biscuit from 60% “Acha”, 20% Pigeon pea, 20% Sweet Potato; E = Biscuit from 55% “Acha”, 20% Pigeon pea, 25% Sweet Potato; F = Biscuit from 100% “Acha” flour (Control); G = Biscuit from 100% Wheat flour (Control).
Table 5: Mould and total viable counts of the formulated nutrient-dense Biscuit from acha pigeon pea, wheat and sweet potato blends and their products (biscuit).
| Samples | Total viable count (cfu/g) | Mould count (cfu/g) |
|---|---|---|
| A | ND | ND |
| B | 1.9 x101 | ND |
| C | ND | ND |
| D | ND | ND |
| E | ND | ND |
| F | ND | ND |
| G | ND | ND |
| H | 3.3 x 101 | 1.4 x 101 |
| I | 1.1 x 101 | 2.5x 10² |
| J | 3.9 x 101 | ND |
| K | 2.2 x 101 | ND |
| L | 1.0 x101 | 3.3 x 10² |
| M | 2.0 x101 | 2.4 x 101 |
| N | 1.1 x101 | ND |
| O | ND | 4.0 x 101 |
| P | 1.0 x10² | ND |
Values represent mean ± standard deviation of triplicate determinations. Values bearing the same superscripts within the same column are not significantly (p > 0.05) different from each other.
A = Biscuit from 80% “Acha”, 20% Pigeon pea; B = Biscuit from 75% “Acha”, 20% Pigeon pea, 5% Sweet Potato; C = Biscuit from 65% “Acha”, 20% Pigeon pea, 15% Sweet Potato; D = Biscuit from 60% “Acha”, 20% Pigeon pea, 20% Sweet Potato; E = Biscuit from 55% “Acha”, 20% Pigeon pea, 25% Sweet Potato; F = Biscuit from 100% “Acha” flour (Control); G = Biscuit from 100% Wheat flour (Control); H = “Acha” flour; I = Pigeon pea flour; J = Wheat flour; K = Sweet Potato flour; L = Flour blends from 80% “Acha”, 20% Pigeon pea; M = Flour blends from 75% “Acha”, 20% Pigeon pea, 5% Sweet Potato; N = Flour blends from 65% “Acha”, 20% Pigeon pea, 15% Sweet Potato; O = Flour blends from 60% “Acha”, 20% Pigeon pea, 20% Sweet Potato; P = Flour blends from 55% “Acha”, 20% Pigeon pea 25% Sweet Potato; ND = Not detected
Conclusion
From, the study, it was observed that the most acceptable biscuit from 65% “acha”: 20% pigeon pea: 15% sweet potato blends. Sample C because sweet potato flour has the potential of being used as a nutritional supplement. It was also observed that pigeon pea had high protein content which helps to improve growth and tissues of the body. The panelists accepted the products organoleptically and there was no complaint of any side effects by the consumers due to the absence of gluten in the flours used for the nutrient-dense biscuit formulation. Efforts should be made to improve the above blend ratio and sweet potato flour should be incorporated into refined foods to improve the nutritional benefit of such products. More research should also be carried out on how to improve the acceptability of “acha”, when put into other use.
References
- 1. Case, S. Gluten-Free Diet: A Comprehensive Resource Guide. (2006) Case Nutritional Consulting Regina.
- 2. Hemert ,S.V., Breedveld, A.C.,Jörgen, M., et al. Migraine associated with gastrointestinal disorders: review of the literature and clinical implications. (2014) Front Neurol 5: 241.
- 3. Silvester, J., Duerksen, D. Celiac disease. (2013)Canadian Medical Association Journal 185(1): 60.
- 4. Cranney, A., Zarkadas, M., Graham, I.D., et al. The Canadian Celiac Health Survey. (2007) Dig Dis Sci52(4): 1087-1095.
- 5. Husby, S., Koletzko, S., Korponay-Szabó, I.R., et al.European Society for Pediatric Gastroenterology, Hepatology, and Nutrition guidelines for the diagnosis of coeliac disease. (2012)J Pediatr Gastroenterol Nutr 54(1): 136-160.
- 6. Ediger, T. R., Hill, I. D. Celiac Disease. (2014) Pediatrics in Review 35(10): 409-416.
- 7. Ivana, C., Marilena, L.,Stefania, M.,et al.Enzymatic Strategies to Detoxify Gluten:Implications for Celiac Disease. (2010) Enzyme Research 1-9.
- 8. Fenster, C. Gluten Free Quick and Easy. (2007) Penguin Rutherford New Jersey.
- 9. Abayomi, H. T., Oresanya T. O., Opeifa A. O., et al. Quality evaluation of cookies produced from blends of sweet potato and fermented soybean flour. (2013) International Journal of Biological, Biomolecular, Agricultural, Food and Biotechnological Engineering 7(7): 350-355.
- 10. Kulkan,S.D. Roasted Soyabean in Cookies Influence on Product Quality. (1997) Journal of Food Science and Technology 34(6): 503-505.
- 11. Olaoye O.A, Ondude, A.A., Oladoye, C.O. Breadfruit Flour in Biscuit making. (2007) African Journal of Food Science 20-23.
- 12. Okeagu, N.J. Extraction and comparison of the two varieties of beniseed oil. (2001)A project submitted in the Department of Food Science and Technology.
- 13. Ayo, J.A., Haruna, U.S.,Yelmi, B., et al. Effect of Informers on the Quality of Acha Bread. (2008) Nigerian Food Journal 26(1): 56-63.
- 14. Okoye, J.I., Nkwocha, A.C.,Ogbonnaya, A.E. Production, proximate composition and consumer acceptability of biscuits from wheat/soybean flour blends. (2008) Continental J Food Science and Technology 2: 6-13.
- 15. Ayo, J.A., Ikuomola, D.S., Esan, Y.O., et al. Effects of Added Defatted Beniseed on the quality of Acha-based Biscuit. (2010)Continental Journal of Food Science and Technology 4: 7-13.
- 16. Lasekan, O.O.Chemical Composition of “Acha” Flour. (1994)Nigerian Food Journal 12: 19-23.
- 17. Ayo J.A., Ayo V.A., Nkama. I., et al. Effect of amaranth grain flour on the quality of wheat biscuits. (1998) International Journal of Food Properties (3): 61-169.
- 18. Obizoba, I.C.,Anyika J.U. Nutritive value of Baobab milk (AdansoniadigitalaL.) Hungary rice, Acha (Digitariaexillis) flours. (1994) Plant Foods Hum Nutr46(2): 156-165.
- 19. Ayo, J.A., Ayo, V.A., Nkama, I., et al. Physiochemical in-vitro digestibility and Organoleptic Evaluation of Acha Wheat Biscuit Supplement with Soyabean flour. (2007) Nigerian Food Journal 25(1): 77-89.
- 20. Ezeuh, M.I. Cultivation and Utilization of Minor Food Legumes in Nigeria. (1977) Tropical Grain Legume Bulletin 10: 28-32.
- 21. Food Nutrients Requirements, Report of a Joint FAO⁄ WHO/UNU Expert Consultation. (1994) World Health Organization Technical Report Series 724.
- 22. Awogbenja M.D., Ndife J. Evaluation of infant feeding and care practices among mothers in Nassarawa egg on local government area of Nassrawa state. (2012) Indian J Sci Res 3(1): 21-29.
- 23. Kabuo, N.O., Dialoke, S.A., Onuegbu, N., et al. Utilization of Tender Pigeon pea (Cajanuscajan (L.) Millsp.) inNigeria.(2015) Food Science and Quality Management 37: 110-115.
- 24. Onyebuashi, C.O.A. Characteristics of Water Extractable Proteins from Cajanuscajan.(1986).
- 25. Purseglove, J.W. Tropical Crops-Dicotyledons. (1968) Science 163: 1050-1051.
- 26. Oshodi, S.M.,Adenekan, I.G. Profile of Some Small and Large Scale Industries Using Soyabean. A Second year, Technical Report of IDRC/IITA Soyabean Utilization Project Phase II. (1992) International institute of Tropical Agriculture Ibadan. 394-405.
- 27. Woolfe, J.A. Sweet potato: An untapped food resource. (1992) Cambridge University Press.
- 28. Kocklar, S.L. Tropical Crops. A Textbook of Economic Botany. (1981) Macmillan Publishers Ltd 230-232.
- 29. Opeke, L.K. Essential of Crop Farming. (2006) Spectrum books Limited 205.
- 30. Pomeranz, Y. Wheat chemistry and Technology 3rd edn.(2007) American Association of Cereal Chemists.
- 31. Kosambo, L.M., Carey, E.E., Misera, A.K., et al. Influence of Age,Farming site and Boiling Provitamina Contents in Sweet Potato (Ipomoea batatas) Storage Roots. (1988) Journal of Food Composition and Analysis 11(4):305-321.
- 32. Rodriguez-Amaya, D.B. Carotenoids and Food Preparation-The retention of Provitamin A in Prepared, Processed and Stored Foods. (1997) Opportunities for Micronutrient Intervention (OMNI) 88.
- 33. Quanhong, L., Tianze, C.,Caitongyi, P. Study on the action of pigeon pea protein. (2003)Journal of Chinese Institute of Food Science and Technology 1:7-11.
- 34. Nkosi, C.Z., Opoku, A.R.,Terblanche, S.E. Antioxidant Effect of Pigeon pea (Cajanuscajan) protein isolated in CCL4-induced liver injury in low protein fed rats.(2006)Phototherapy Res20:935-940.
- 35. Igbabul, B., Num, G.,Amoves, J. Quality evaluation of composite bread produced from wheat, maize and orange fleshed sweet potato flours. (2015)American Journal of Food Science and Technology 2(4): 109–115.
- 36. Olapade, A.A., Aworh, O.C.,Oluwole, O.B. Quality Attributes of Biscuits from Acha (Digitariaexilis) Flour Supplemented with Cowpea (Vignaunguiculata) Flour. (2010) African Journal of Food Science and Technology 2(9): 198-203.
- 37. Onyemelukwe, N.N. Characteristics of Porridge-type Breakfast Cereal Product Formu-lated from Pigeon pea and Maize. (1992)Paper presented at the 16th Annual Conference of the Nigeria Institute of Food Science and Technology 53.
- 38. Odedeji, J.O.,Adeleke, R.O. Pasting Characteristics of Wheat and Sweet Potato Flour Blends. (2010) Pakistan Journal of Nutrition 9(6): 555-557.
- 39. Faris, D.G., Singh, U. Pigeon pea: Nutrition and Products. (1990)CAB International 401-434.
- 40. Ihekoronye, A.I. Cereal Grains and Oilseed Processing Technology. In: Manual on Small-scale Food Processing.(1999) The Academic Publishers 11-50
- 41. AOAC (2010) Official Methods of Analysis 18thedn, Revision 3, Association of Official Analytical Chemists. Washington DC.
- 42. Snell, F.D., Snell, C.T. Colorimetric method of Analysis 3rd edn. (1953)Van-Nostrand Company Inc 86-121.
- 43. Pearson, D.A. Chemical Analysis of Foods (7th edn). (1976) Churchill Livingstone 487-573.
- 44. Oberlas, D. Phytates In: Toxicants occurring naturally in Foods (Stron, F edn). National Academy of Sciences 363-371.
- 45. Harrigan, W.F., McCance, M.E. Laboratory method for Food and Dairy Microbiology. (1978) Academic Press 18(3): 226-227.
- 46. Ihekoronye, A.I., Ngoddy, P.O. Integrated Food Science and Technology for the Tropics. (1985) Macmillan Publishers 368-369.
- 47. Steel, G.D., Torrie, J. H. (1980). Principles and Procedures of Statistics: A Biometrical Approach, McGraw-Hill Book Company Inc.
- 48. Alabo, A.P. Effect of Sesame seed on millet biscuit. (2006) Plant Foods for Human Nutrition 64: 21-27.
- 49. Sefa-dedeh, S.K., Afoakwa, E.O. Biochemical and Textural Changes in Trifoliate Sweet Potato (Ipomoea batatas) Tubers. (2001) A Harvest Annual meeting.
- 50. Srivastava, S., Genitha, T.R. Yadav, V. Preparation and Quality Evaluation of Flour and Biscuit from Sweet Potato. (2012) Journal of Food Process and Technology 3(12): 1- 5.
- 51. NAFDAC Analytical Standards and Expected Limits for Food and Food Products. (2005) Central Laboratory.
- 52. Kansas, C.N. A Seminar on Wheat Importation in Nigeria by Kansas Wheat Commission, Kansas. (2006) Association of Wheat Growers.
- 53. Otegbayo,B.O., Sobande, F.O., Aina, J.O. Nutritional Quality of Soy-Plantain Extruded Snacks. (2002) Ecology of Food and Nutrition 41(5): 463-472.
- 54. Oyenuga, V. A. Nigerian Foods and Feeding Stuffs 4th edn. (2000) University Press Ibadan.
- 55. Ayo, J.A., Nkama, I. Effects of Acha (Digitariaexilis staph) Grain flour on the Physical Sensory Quality of Biscuit. (2003) Journal of Nutrition and Food Science 33(3): 125-135.
- 56. Kolapo, A. L.,Sanni, M. O. Processing and characteristics of soybean–fortified Tapioca. (2005) Journal of Women in Technical Education 4: 59-66.
- 57. Akubor, P.I., Ukwuru, M.U. Functional properties and biscuit making potential of soybean and cassava flour blends. (2005) Plant foods for Human Nutrition 58(3): 1-12.
- 58. Oluwole, O.B., Karim,O.R. Production of biscuits from Bambara, cassava and wheat flour blends. (2005) Journal of Raw Materials Research 2(1): 34-38.
- 59. Human Energy Nutrition. Report of a Joint FAO/WHO/UNU Expert Consultation. (2004) FAO Food and Nutrition Technical Report.
- 60. Adeyemi, I.A.,Idowu, C.C. The evaluation of pregelatinized maize flour in the development of massa a baked product. (2000) Nigerian Food Journal 8: 63-73.
- 61. Fellow, P. Food Processing Technology 3rd edn Principle and Practice. (2009) Woodhead Publishing 177-182.
- 62. Okafor, J.N.C.Production and Evaluation of Extruded Snacks from Composite flour of Bambara groundnut (Voandzeia subterranean (L) thoaur), Hungry rice (Digitariaexilis staph) and Carrot (Daucuscarota). (2010) University of Nigeria.
- 63. Omojiba, G.O. Determination and Evaluation of Drying Temperature of some Selected Vegetables. (2000) An unpublished Postgraduate Diploma Thesis of the University of Technology.
- 64. Osman, A.M. Effect of Different Processing Methods on Nutrient Composition, Anti-nutritional factors and in-vitro protein Digestibility on Dolichos lablab bean (Lablab purpureus (L) Sweet). (2007) Pakistan Journal of Nutrition 6(4): 203-299.
- 65. Olayemi, F.O. Evaluation of the Reproductive and Toxic Effects of Crestisferruguirea (Decando L.) root Extraction in Male rats. University of Ibadan 46-57.
- 66. Allonso, R., Aguirne, A., Marzo, F.Effects of Traditional Processing Methods on Anti-nutritional and in-vitro digestibility of Protein and Starch in Faba and Kidney beans. (2000) Food Chemistry 68: 159-165.
- 67. Eneche, E.H. Biscuit-Making Potential of Millet/Pigeon Pea Flour Blends. (1999) Plant Foods Hum Nutr 54(1): 21-27.
- 68. Ndife, J., Kida, F. Fagbemi, S. Production and quality assessment of enriched cookies from whole wheat and full fat soya. (2014) European Journal of Food Science andTechnology 2(1):19 -29.
- 69. Ezeama C.F. Food Microbiology: Fundamentals and Applications. (2007) Natural Prints Ltd Lagos.


