
Programmed Cell Death of Cultured A549 Lung Epithelial Cells Induced by Sodium Arsenite Exposure
Yongping Mu1,3, Rebecca Wang1,4, He Wang1,2*
Affiliation
- 1Department of Environmental Health Science, School of Public Health and Tropical Medicine, Tulane University, New Orleans, LA 70112, USA
- 2School of Health Sciences, University of Newcastle, Callaghan, NSW 2308, Australia
- 3Clinical Laboratory Tests Center, The Affiliated People’s Hospital of Inner Mongolia Medical University, Inner Mongolia Autonomous Region, 010010,China
- 4Benjamin Franklin High School, New Orleans, LA70116, USA
Corresponding Author
He Wang, School of Health Sciences, University of Newcastle, Callaghan, NSW2308, Australia, Tel: (02) 49217735; E-mail: he.wang@newcastle.edu.au
Citation
Wang, H., et al. Programmed Cell Death of Cultured A549 Lung Epithelial Cells Induced by Sodium Arsenite Exposure.. (2017) J Med Chem Toxicol 2(2): 85-89.
Copy rights
© 2017 Wang, H. This is an Open access article distributed under the terms of Creative Commons Attribution 4.0 International License.
Keywords
Sodium arsenite (NaAsO2); Lung epithelial cells; Oxidative stress; Programmed cell death
Abstract
The purpose of this experiment is to test if there is a potential for human toxicity to sodium arsenite (NaAsO2) by examining cell death in A549 cells acutely exposed NaAsO2. In this experiment, A549 cells were plated according to experimental requirements and grown to 70 - 80% confluence before treatment with NaAsO2 of different concentrations. Methylthiazol Tetrazolium (MTT) Assay and Acridine Orange (AO) staining were used to visualize and assess the cytotoxic effects on cell viability. Autophagy of cells was determined by formation of autophagosomes and ratio of induction of light chain 3-II (LC3-II) and light chain 3-I (LC3-I). Western Blot was used to determine apoptosis and Real-time PCR was conducted to quantify the changes in the levels of Caspase-3 and PARP (Poly (ADP-ribose) polymerase) levels. This study demonstrated that exposure to NaAsO2 in vitro can lead to cell death. At low concentration NaAsO2 can induce autophagy and at high concentration it can induce apoptosis. The work presented in this poster shows the initial cellular response of human lung epithelial A549 cells to acute exposure to NaAsO2 in vitro.
Introduction
Arsenite is a toxic metalloid that is widely distributed in the environment found in water, soil, and air. Exposure to inorganic arsenite occurs worldwide via environmental (e.g., contaminated drinking water, air, food, domestic fuel sources) and occupational exposures (e.g., smelting industries, pesticide production)[1]. In addition to its association with nonmalignant diseases, arsenic is a major world-wide health concern because of its carcinogenic potential in humans[2-6].
As part of the innate immune defense, the polarized conducting lung epithelium acts as a biological barrier to keep exogenous particulates carried in respiration from underlying tissue. Arsenite is a metalloid toxicant that can increase the variety of pulmonary adverse health effects, such as lung inflammation, fibrosis, emphysema and tumors via inhalation or ingestion[7]. Since the lung is an important target organ for inorganic arsenite-induced carcinogenicity[8], pulmonary toxicity has not been fully elucidated. Human A549 epithelial lung adenocarcinoma cells were routinely used as in vitro model system for lung epithelial cells[9,10]. We hypothesize that sodium arsenite can cause cell toxicity in A549 cells via programmed cell death. To test the hypothesis we will determine the biological responses of sodium arsenite on the lung epithelial cells by monitoring arsenite-induced toxicity, particularly programmed cell death via autophagy and apoptosis.
Materials and Methods
Reagents and materials
Trivalent Inorganic Arsenic Sodium meta arsenite [NaAsO2], MW 129.91, abbreviated as iASIII (purity > 98%), phenylmethylsulfonyl fluoride (PMSF) and protease inhibitor cocktail were supplied by Sigma-Aldrich (St. Louis, MO). Trypsin/1mM EDTA (0.25%), RPMI 1640 medium, 1×PBS, NP40 cell lysis buffer, and penicillin/streptomycin were purchased from Invitrogen (Carlsbad, CA). Fetal bovine serum (FBS) was obtained from Atlanta Biologicals (Lawrenceville, GA). BCA assay kit was obtained from Pierce Biotechnology (Rockford, IL). A549 cells were purchased from the ATCC (Catalog No. CCL-185™). The following primary polyclonal antibodies used in this experiment were purchased from Cell Signaling Technology (Boston, MA): LC3B, Caspase3, PARP, and GAPDH. IRDye® 800CW-conjugated secondary antibody was purchased from BioRad (Life Science Research 2000 Alfred Nobel Drive Hercules, CA 94547). The primers of mRNA PARP, Caspase3 and GAPDH were purchased from Qiagen Company (Maryland, USA).
Preparation of sodium arsenite solution
Trivalent Inorganic Arsenic (sodium arsenite) was dissolved in double-distilled water to a final concentration of 10−2 M. This stock solution was freshly prepared for every test. Serial dilutions were prepared starting from the stock solution to obtain different arsenite concentrations in cell media.
Cell culture
The A549 cell line was derived from human lung carcinoma of a 58-year-old Caucasian male[11] which has been routinely used as a model for lung epithelial cells[12]. It is known to have retained a number of the main characteristics of the native lung epithelium[13] such as tight junctions formation, presence of keratin, and synthesis of ferritin[14]. Cells were cultured in a complete, consisting of RPMI 1640 medium, supplemented with 10% fetal bovine serum (FBS), 100 μg /ml penicillin, and 100 g/ml streptomycin and maintained at 37 °C and 5% CO2 in a humidified incubator.
Analysis of cell viability by MTT assay
MTT assay was used to evaluate the viability of A549 cells cultured in media containing different concentrations of sodium arsenite (0.00, 0.625, 1.25, 2.50, 5.00, 10.0, 20.0, 40.0, 80.0 μM) according to the instruction of the manufacturer’s instruction. Briefly, 1.00 x 10⁵ of A549 cells were seeded into 96-well plates overnight to adhere, and the media containing various concentrations of sodium arsenite was added to the wells. After incubation for 24h and 48h, MTT 5 mg/ml, equal of 1/10 of media, was added to each well and incubated for 3 h. After incubation, the medium was removed, and equal media of DMSO was added to the remaining precipitates on the plates in the well. The absorbance of the resulting solution was determined at 570 nm (690 nm wavelength was used as reference) using a spectrophotometer (BIO-RAD).
Reactive oxygen species (ROS) assay
The intracellular ROS production levels were determined using an oxidation sensitive fluorescent dye, 2′7′-dichlorodihydrofluorescein diacetate (H2DCFDA). Briefly, after starvation, cells were treated with different concentrations sodium arsenite (0 - 20 uM) for 24 hours. After washing, the cells were incubated with 40 μM DCFH-DA for 45 min in dark. At the end of DCFH-DA incubation, cells were washed with PBS, Lysed with 1N NAOH, and aliquots were transferred to a blackwell plate (BD Falcon). The fluorescent intensity was measured using a multidetection microplate reader (FLUO star Optima Microplate Reader, BMG LABTECH, Cary, NC) with excitation and emission wavelengths of 485 nm and 520 nm, respectively. Three independent experiments were conducted.
Autophagy assay by AO staining
As a marker of autophagy, the volume of the cellular acidic compartment was visualized by acridine orange (AO) staining, which was performed as describled by (Yang et al. 2008). Briefly, Human A549 cells were treated with 0 or 10 μM arsenite for 24 h and stained with 1 μg/ml acridine orange in serum- free medium at room temperature for 15 min. Then the cells were washed twice, each for 5 min and immediately visualized under a fluorescent microscope.
Western blot assay
To determine the relative protein expression, total proteins were extracted and analyzed by the Immuneblot assay. Cells were harvested following indicated time exposure to various concentrations of arsenite. The lysates were sonicated and centrifuged for 5 minutes at 10,000x g and supernatant fractions were stored at – 80°C or used immediately. The total protein extracts were separated by 6% - 12% SDS-PAGE gel and Immuneblot analysis was performed according to the manufacturer’s instruction (Cell signaling, USA), after electro-transferring, membrane was blocked in TBS/0.1% Tween 20 with 5% (w/v) nonfat dry milk for 1 hour at room temperature, then incubated with primary polyclonal antibodies overnight at 4°C. After washing with TBS/0.1% Tween 20, target protein band, specifically bound to the primary antibody, was detected by LI-COR (LI-COR Odyssey, USA) system with IRDye® 800CW-conjugated secondary antibody. Western blot bands were quantified by densitometry relative to the GAPDH loading control using image software.
Quantitative real-time polymerase chain reaction analysis for gene expression
Total RNAs were extracted by using the RNeasy Mini Kit for PARP and caspase3-mRNA analyses according to the manufacturer’s instructions. The primers of mRNA PARP, Caspase3 and GAPDH were used for RT-PCR. The PCRs were performed in the Bio-Rad CFX96™ sequence detection system (Bio-Rad, Hercules, CA, USA), in accordance with the manufacturer’s instructions. Expression of mRNA was performed in two steps using miScript II RT Kit and miScript SYBR Green PCR Kit (Qiagen, USA). The Caspase3 and PARP mRNA levels were normalized to GAPDH mRNA levels, which were determined in the same tube as the target gene (Caspase3 and PARP). For quality control, distilled water was used as negative controls. First strand cDNA from RNA templates was performed using miScript II RT Kit according to manufacturer’s protocol. After reverse transcription reaction, real-time PCR was performed by a Bio-Rad CFX96™ sequence detection system using Quanti-Tect SYBR Green PCR Master Mix (Qiagen, USA). Real-time PCR amplification conditions were 50°C for 2 min, 95°C for 15 min, followed by 40 cycles at 94°C for 15 s, 55°C 30s, and 70°C for 30s. Melt curve at 60°C for 1 min. Melt curve analysis of the PCR products confirmed the absence of secondary products. All real-time PCR assays were performed in triplicate. Quantification of each analyze expression compared with untreated controls was assessed using the 2-ΔΔCT method. Fluorescence data were processed and analyzed.
Statistical analysis
All experiments were repeated at least three times. The data were expressed as means ± SD. (standard deviation). Intergroup differences were tested by analysis of variance (One Way ANOVA), followed by Tukey’s test. The software used was Excel and SPSS, version 13.0 (SPSS Inc., Chicago, IL, USA). Values of p < 0.05 were considered statistically significant (indicated in tables and figures as *).
Results
When A549 cells were treated with increasing concentration of NaAsO2 for 24 hours (blue columns in Figure 1), cell viability remained largely intact until concentration exceeded 20.0 μM. At the highest concentration of NaAsO2 employed (80.0 μM), cell viability decreased to about 70%. However, as exposure time increased to 48 hrs, the effect of NaAsO2 treatment on cell viability was more pronounced. For example, cell viability was reduced to 85% at a low concentration of 5.00 μM. As concentration goes up, cell viability steadily decreased to 50% when NaAsO2 concentration reached 80.0 μM.
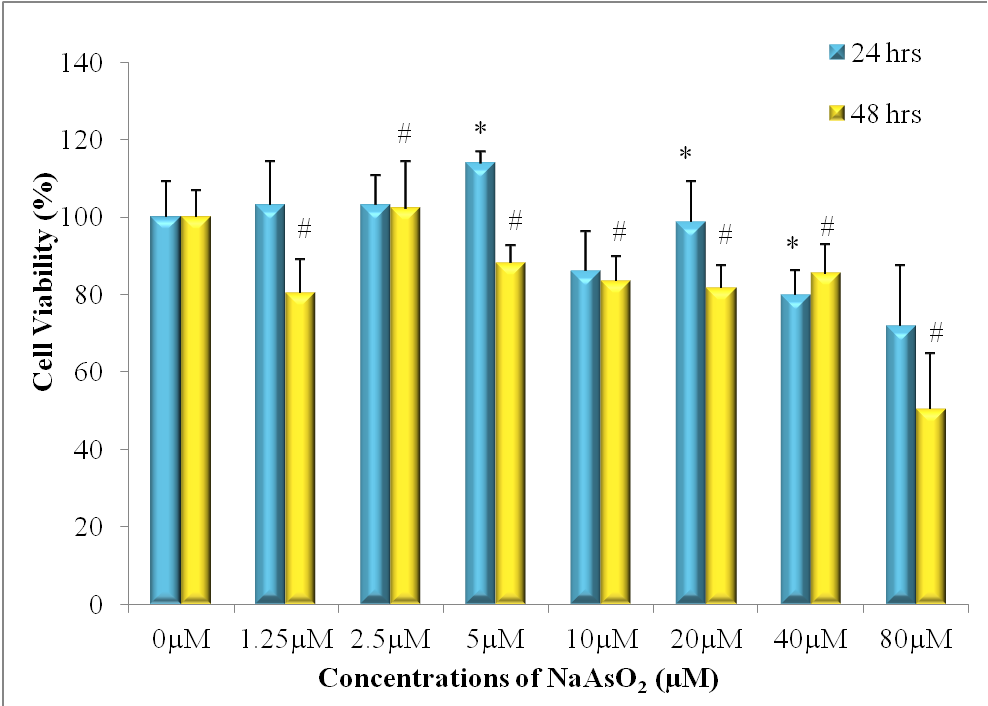
Figure 1: MTT Assay results showing cell viability of NSCLC A549 cells after exposure to NaAsO2 for 24 hrs and 48hrs (*p < 0.05 versus control at 24h; # p < 0.05 versus control at 48h).
Untreated A549 cells grow adhered to the bottom of the well at high confluence whereas NaAsO2 treated cells show reduced cell adhesion to the flask (Figure 2), an observation consistent with decreased cell viability in the MTT assays. Figure 3 shows the occurrence of cell autophagy after treatment with 10.0 μM NaAsO2 for 24 h. The control cells (Figure 3a) stained green in the vessel compartments. However, the treated cells had orange color showing in the cells, indicative of a lower pH level within cellular vessels due to autophagosomes formation (Figure 3b).
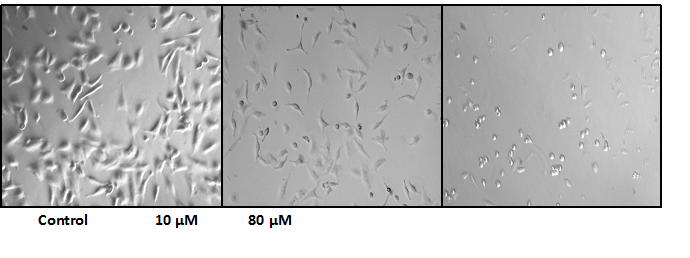
Figure 2: Cell Morphology changes relative to concentrations (0 μM, 10 μM, 80 μM) of NaAsO2 after 24 hrs of treatment.
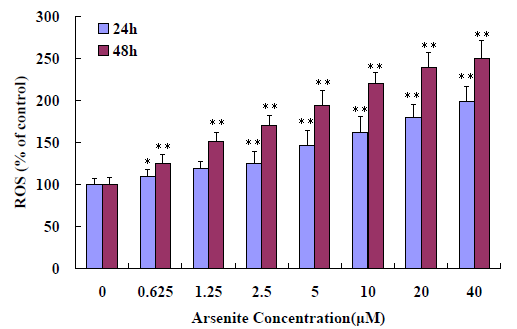
Figure 3: Induction of oxidative stress in A549 cells. A549 cells treated with different concentration (0 - 40 μM) sodium arsenite, evaluated by a multidetection microplate reader using H2DCFDA. Cells were treated with sodium arsenite for 24 h and 48 h, washed, and incubated with DCFH-DA for 45 min. The cells were harvested and subjected for microplate reader analysis. The results represented the mean ± SD of three independent experiments. *P < 0.05, **P < 0.01, compared with untreated cells at 24 h and 48 h.
To confirm the ROS (reactive oxygen species, or superoxide and hydrogen peroxide) production induced in A549 cells, ROS levels were detected by florescence microplate reder at different concentration arsenite exposure. The results showed that ROS production is sensitive to arsenite exposure and the ROS significant release at 0.625 μM and at dose and time-dependent manner (Figure 4). For further confirmation the relationship between cytotoxicity and the arsenite via ROS production, a scavenger of ROS, NAC was added. The antioxidant activity of NAC is thought to be due to the thiol containing motif which acts as a precursor for GSH synthesis[16,17]. The data shown that the cell toxicity caused by arsenite significantly decreased with adding NAC (Figure 5).
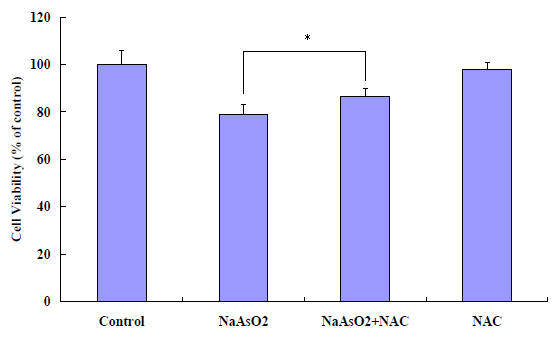
Figure 4: Effects of ROS inhibitor, NAC on arsenite-induced cytotoxicity in A549 cells.The data shown that the cell viability significantly increased with adding NAC to the arsenite-treated cells. Methods: Cultured A549 cells were treated with 20 μM sodium arsenite with 10 mM NAC for 24 hours.The cell viability was determined by MTT assay. Results were presented as mean ± SD of three independent experiments in triplicates. *P < 0.05, compared with only arsenite treated cells at 24h.
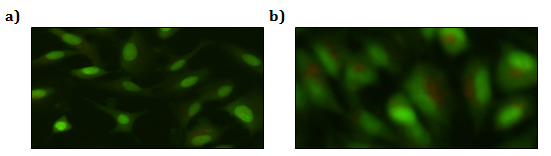
Figure 5: Detection of NaAsO2 induced autophagy by AO staining: a) control, green-stained vessel compartments, b) cells treated with 10 μM of NaAsO2 for 24 hrs.
Another indication of autophagy occurrence in cells is the change of the expression ratio of LC3-II: LC3-1. Autophagy increases the ratio of LC3-II to LC3-I due to increased conversion of LC-3-I to LC3-II. As shown in Figure 4, the ratio of LC3-II to LC3-I steadily went up as NaAsO2 concentration is increased from 0 to 40 μM, providing additional evidence of autophagy occurring after exposure to NaAsO2.
The lung epithelial cells treated with NaAsO2 showed increased expression of active caspase-3 and PARP, two hallmark proteins of apoptosis. Results shown in Figure 5 confirmed that the active 19kDa cleaved caspase-3 and 89kDa cleaved PARP were increasingly expressed in cells exposed to progressively higher NaAsO2 concentrations. Such changes are also occurring at the mRNA level, as verified by real-time PCR assays of mRNA expression of PARP and caspase-3 (Figure 6).
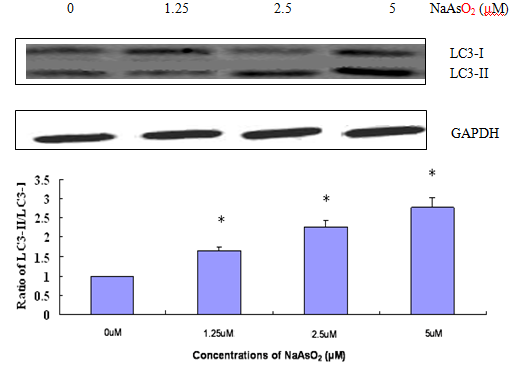
Figure 6: Western Blot analysis demonstrates increased ratio of LC3-II to LC3-I as NaAsO2 exposure induces the conversion of LC3-I to LC3- II (treatment of 24 hrs). No apoptosis marker can be detected within this concentration range.
Discussion
Autophagy is the catabolic mechanism involving cell degradation of unnecessary or dysfunctional cellular components through the lysosomal machinery. Autophagy can be a survival mechanism but can also be a pathway for cell death. The synthesis, degradation and renewal of cellular components are critical to cell survival. Autophagy, a cellular mechanism associated with the degradation of unnecessary or dysfunctional organelles plays a vital role in maintaining homeostasis in a cell. When a cell is under tolerable stress conditions, autophagy may serve as a repair mechanism and return the cell back to its normal state. However, if a cell is subjected to severe or continuous stress conditions, autophagy may trigger apoptosis, or cell death. During the process of autophagy, autolysosomes are formed when lysosomes fuse with autophagosomes that have engulfed degraded cellular components in the cytoplasm. As the cellular components are digested, the pH level within the capsule becomes more acidic. The method of AO staining helps us to visualize autophagy by making these cellular acidic vessels appear an orange-red color. The orange-red stains seen in Figure 3b shows that the A549 cells treated with 10.0 μM of NaAsO2 for 24 h clearly underwent autophagy. However, the occurrence of apoptosis cannot be concluded from AO staining results.
During autophagy, a cytosomal protein LC3-I is conjugated to LC3-II. Figure 4 shows that as concentrations of NaAsO2 increase, so does the ratio of LC3-II to LC3-I, further supporting that autophagy has occurred. On its own, Figure 4 does not present any evidence of apoptosis.
Figure 1 and Table 1 indicate that cell viability increases at exposure to 5 μM of NaAsO2 (24h). Coupled with the results of Figure 4, this could be evidence that exposure to low concentrations of NaAsO2 for 24 hours can initiate in A549 cells an autophagic response promoting cell survival. Exposure to NaAsO2 at increasing concentrations for more extensive periods of time leads to apoptosis, clearly indicated by the significant loss of cell viability shown in Figure 1 (48h) and Table 1 (48h). Further study is needed to clarify if it was autophagy that contributed to cell death in A549 cells at all other exposure levels to NaAsO2.
Table 1: Cell viability (%) of A549 cells after exposure to different concentrations (μM) of sodium arsenite for 24 hours and 48 hours.
| Treatment | 0 μM | 1.25 μM | 2.5 μM | 5 μM | 10 μM | 20 μM | 40 μM | 80 μM |
|---|---|---|---|---|---|---|---|---|
| 24 hr | 100.% | 103% | 103% | 113% | 86.0% | 99.8% | 80.0% | 71.8% |
| 48 hr | 100.% | 80.4% | 102% | 88.0% | 83.4% | 81.7% | 85.4% | 50.4% |
Activation of Caspase3 initiates a cell’s entry into the apoptotic signaling pathway. Once activated, Caspase-3 cleaves nuclear proteins such as PARP, setting the cell on a course of destruction. PARP is involved in repairing damaged DNA, but once it is cleaved it is no longer active and DNA cannot be repaired. The destruction of DNA within the nucleus is a hallmark feature of apoptosis. Evidence that apoptosis is occurring is supported by the increased expression of the activated Caspase-3 and inactivated PARP as seen in Figure 5 and Figure 6.
Our study supports that NaAsO2 induces autophagy and apoptosis in A549 cells. In this study, we found that in vitro exposure of A549 cells to high concentrations of NaAsO2 results in apoptosis. Further study is needed to clarify if autophagy contributed to cell death at these high exposure levels to NaAsO2. At lower concentrations, NaAsO2 induced autophagy in A549 cells but apoptosis could not be detected.
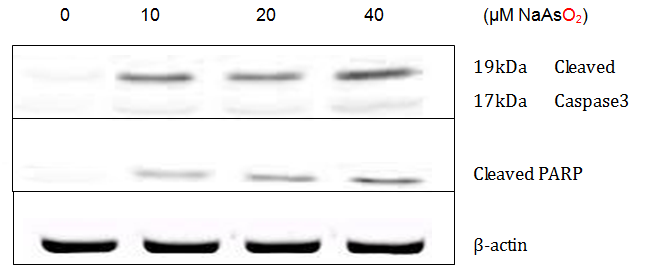
Figure 7: Detection of active caspase-3 and PARP in A549 cells exposed to NaAsO2 for 24 hrs by Western Blotting.
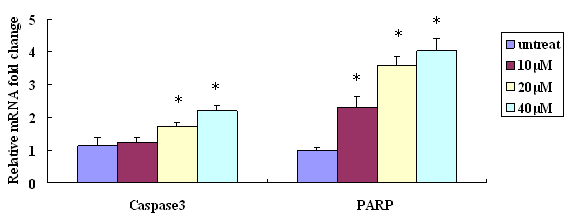
Figure 8: Real-time PCR assay for mRNA expression of PARP and Caspase-3 after treatment with NaAsO2 for 24 hrs. Data presented in triplets (*p < 0.05 versus control).
Long-term consumption of arsenic contaminated water may result in accumulation of toxic levels of arsenic in the bloodstream which may ultimately build up in the lungs through blood circulation and lead to serious damaging health effects. This is a major worldwide concern, especially in third-world countries where water treatment is not affordable and in the western United States where public and domestic wells have shown increased levels of arsenic.
References
- 1. Hughes, M. F., Beck, B.D., Lewis, A.S., et al. Arsenic Exposure and Toxicology: A Historical Perspective. (2011) Toxicological Sci 123(2): 305-332.
Pubmed || Crossref || Others - 2. Abnosi, M.H., Jafari Yazdi Z. Low dose and long term toxicity of sodium arsenite caused caspase dependent apoptosis based on morphology and biochemical character. (2012) Cell J 14(3): 161-170.
Pubmed || Crossref || Others - 3. Kajita, K., Kuwano, Y., Kitamura, N., et al. Ets1 and heat shock factor 1 regulate transcription of the Transformer 2β gene in human colon cancer cells. (2013) J Gastroenterol 48(11): 1222-1233.
Pubmed || Crossref || Others - 4. Ivanov, V.N., Hei, T.K. Induction of apoptotic death and retardation of neuronal differentiation of human neural stem cells by sodium arsenite treatment. (2013) Exp Cell Res 319(6): 875-887.
Pubmed || Crossref || Others - 5. Xu, Y., Li, Y., Li, H., et al. The accumulations of HIF-1α and HIF-2α by JNK and ERK are involved in biphasic effects induced by different levels of arsenite in human bronchial epithelial cells. (2013) Toxicol Appl Pharmacol 266(2): 187-197.
Pubmed || Crossref || Others - 6. Chen, C.J., Chen, C.W., Wu, M.M.,et al. Cancer potential in liver, lung, bladder and kidney due to ingested inorganic arsenic in drinking water. (1992) Br J Cancer 66(5): 888-892.
Pubmed || Crossref || Others - 7. Tokar, E.J., Diwan, B.A., Ward, J.M., et al. Carcinogenic effects of ''whole life'' exposure to inorganic arsenic in CD1 mice. (2011) Toxicol Sci 19(1): 73-83.
Pubmed || Crossref || Others - 8. Smith, A.H., Marshall, G., Yuan, Y., et al. Increased mortality from lung cancer and bronchiectasis in young adults after exposure to arsenic in utero and in early childhood. (2006) Environ Health Perspect 114(8): 1293–1296.
Pubmed || Crossref || Others - 9. Bartel, M., Ebert, F., Leffers, L., et al. Toxicological Characterization of the Inorganic and Organic Arsenic Metabolite Thio-DMA in Cultured Human Lung Cells. (2011) J Toxicol 2011: 373141.
Pubmed || Crossref || Others - 10. Chen, C., Jiang, X., Zhao, W., et al. Dual role of resveratrol in modulation of genotoxicity induced by sodium arsenite via oxidative stress and apoptosis. (2013) Food Chem Toxicol 59: 8-17.
Pubmed || Crossref || Others - 11. Giard, D.J., Aaronson, S.A., Todaro, G.J., et al. In vitro cultivation of human tumors: establishment of cell lines derived from a series of solid tumors. (1973) J Natl Cancer Inst 51(5): 1417-1423.
Pubmed || Crossref || Others - 12. Khan, M.I., Mohammad, A., Patil, G., et al. Induction of ROS, mitochondrial damage and autophagy in lung epithelial cancer cells by iron oxide nanoparticles. (2012) Biomaterials 33(5): 1477-1488.
Pubmed || Crossref || Others - 13. Lieber, M., Smith, B., Szakal, A.,et al. A continuous tumor-cell line from a human lung carcinoma with properties of type II alveolar epithelial cells. (1976) Int. J. Cancer 17(1): 62-70.
Pubmed || Crossref || Others - 14. Fang, R., and Aust, A.E. Induction of ferritin synthesis in human lung epithelial cells treated with crocidolite asbestos. (1997) Arch Biochem Biophys 340(2): 369-375.
Pubmed || Crossref || Others - 15. Yang, C., Kaushal, V., Shah, SV.,et al. Autophagy is associated with apoptosis in cisplatin injury to renal tubular epithelial cells. (2008) Am J Physiol Renal Physiol 294(4): F777-787.
Pubmed || Crossref || Others - 16. Dekhuijzen, P.N. Antioxidant properties of N-acetylcysteine: their relevance in relation to chronic obstructive pulmonary disease. (2004) Eur Respir J 23(4): 629-636.
Pubmed || Crossref || Others - 17. Moldeus, P., Cotgreave, I.A., Berggren, M. Lung protection by a thiol-containing antioxidant: N-acetylcysteine. (1986) Respiration 50 Suppl (1): 31-42.
Pubmed || Crossref || Others


