
Protective effects of Macrotyloma uniflorum seeds (horse gram) in abnormalities associated with the metabolic syndrome in rats
Vandana S. Panda1*, Yuti H. Desai1, Sudhamani S2
Affiliation
- 1Department of Pharmacology & Toxicology, Prin. K. M. Kundnani College of Pharmacy, Mumbai, India
- 2Department of Pathology, Dr. D.Y. Patil Medical College, Nerul, Navi Mumbai, India
Corresponding Author
Dr.Vandana S. Panda, Prin. K. M. Kundnani College of Pharmacy, Jote Joy Building, Rambhau Salgaonkar Marg, Cuffe Parade, Colaba, Mumbai 400005. India: Tel: +91 22 22164387/ Fax: +912222165282; E-mail:vspanda@rediffmail.com
Citation
Panda, V.S., et al. Protective effects of Macrotyloma uniflorum seeds (horse gram) in abnormalities associated with the metabolic syndrome in rats. (2015) J Dia Obes 2(1): 28-37.
Copy rights
© 2015 Panda, V.S. This is an Open access article distributed under the terms of Creative Commons Attribution 4.0 International License.
Keywords
Macrotyloma uniflorum seed; Ferulic acid; Fructose; Metabolic syndrome; Cardioprotective activity; Antioxidant activity.
Abstract
Macrotyloma uniflorum Lam. (Verdc.) known as horse gram is an underutilized and unexplored legume distributed throughout Asia and Africa. Its seeds are rich in antioxidant phenolic acids, ferulic acid being the most potent one. The present study evaluates the protective effects of a hydroalcoholic extract of the seeds of Macrotyloma uniflorum (MUSE) and ferulic acid in hyperlipidemia and cardiac abnormalities associated with the metabolic syndrome in rats. Isolation and quantification of ferulic acid from MUSE was carried out by HPTLC and HPLC respectively. Abnormalities associated with the metabolic syndrome were induced in rats by administering them fructose (25% w/v) in drinking water for 45 days. MUSE (200mg/kg and 400mg/kg), ferulic acid (80mg/kg) and the standard drug gemfibrozil (60mg/kg) were administered to rats along with fructose. MUSE and ferulic acid treatments elicited significant cardioprotective activity by attenuating the fructose-elevated activities of the marker enzymes AST, LDH and CK-MB in serum and by restoring the fructose depleted activities of these enzymes in heart. Both treatments attenuated significantly the fructose elevated malondialdehyde levels, and restored the fructose depleted glutathione levels and activities of the antioxidant enzymes superoxide dismutase, catalase, glutathione peroxidase and glutathione reductase in heart. A significant alteration in lipid profile, notable decrease in cardiac hypertrophy, left ventricular hypertrophy, heart collagen and blood glucose levels, and improved glucose tolerance was observed in the treatment groups when compared with the fructose fed animals. The present findings suggest that MUSE may be useful as an adjuvant for the management of hyperlipidemia and cardiac abnormalities associated with the metabolic syndrome. The potent antioxidant activity of its phenolic phytoconstituents, particularly ferulic acid, may be a major factor towards this activity.
Introduction
It has been globally recognized that cardiovascular disease (CVD) has become a ubiquitous cause of morbidity and a leading contributor to mortality in most countries. The National Heart, Lung, and Blood Institute (NHLBI), a division of the National Institutes of Health, USA has identified Syndrome X or the Metabolic syndrome as a leading risk factor for CVD[1]. Metabolic syndrome, also known as syndrome X, insulin resistance syndrome, or dysmetabolic syndrome is a cluster of metabolic risk factors that come together in a single individual[2]. These metabolic factors include insulin resistance, hypertension, cholesterol abnormalities, central obesity and an increased risk for blood clotting[3]. People with metabolic syndrome have 50-60% higher cardiovascular risk than those without it.
Dyslipidemia is an integral part of the metabolic syndrome which includes hyper triglyceridemia and a low HDL level. Individuals with the metabolic syndrome, particularly those with abdominal obesity exhibit a highly atherogenic lipid profile, which may account for their high risk of CVD. Central fat accumulation and presence of insulin-resistance have both been associated with a number of dyslipidemia features like elevated plasma triglyceride levels, increased VLDL and intermediate-density lipoprotein (IDL) levels, presence of small but dense LDL particles and decreased HDL levels. These abnormalities of lipoprotein metabolism are more likely to occur together than separately and constitute essential features of the metabolic syndrome[3].
Type 2 diabetes mellitus (T2DM) or noninsulin dependent diabetes mellitus is the most common form of diabetes in which the body has adequate insulin, but the cells have become resistant to it, accounting for 90% – 95% of the diabetic cases. Risk of CVD is 200% higher in diabetic population than in non-diabetic individuals. Progression of T2DM can lead to diabetic cardiomyopathy, which has been defined as diabetes-associated ventricular dysfunction that occurs independently of coronary artery disease and hypertension. In addition, diabetic cardiomyopathy may be characterized by diastolic dysfunction, which becomes more apparent in the presence of hypertension or myocardial ischemia[4].
Recently, much attention has been focused on plant foods that may be beneficial in preventing the metabolic syndrome and possibly reducing the risk of diabetes and cardiovascular disease[5]. Dietary patterns high in fruit, vegetable and cereal content were generally found to be associated with lower prevalence of the metabolic syndrome[6].
Horse gram [Macrotyloma uniflorum Lam. (Verdc.)], previously [Dolichos biflorus] belonging to the family Fabaceae is a lesser known drought resistant food legume grown throughout Asia, Africa and Australia and primarily utilized as a feed to animals and horses. In India it is known as the "poor man's pulse" and used as a staple food. The seeds/beans are ovoid, reddish brown in colour, 4-6 mm long and 3-5 mm broad. They contain varying amounts of carbohydrates, proteins, amino acids, lipids, phenolic compounds (3,4- dihydroxy benzoic acid, vanillic acid, caffeic acid, p-coumaric acid, ferulic acid, chlorogenic acid, syringic acid and sinapic acid), flavonoids (quercetin, kaempferol and myricetin), anthocyanidins (cyanidin, petudin, delphinidin and malvidin), tannins, saponins, fatty acids (hexanoic acid and hexadecanoic acid), phytosterols (stigmasterol and β-sitosterol) and minerals like iron, calcium and molybdenum[7]. Phenolic acids obtained from M. uniflorum are considered to be potent antioxidants which act by scavenging free radicals and reactive oxygen species[8].The seeds of Macrotyloma uniflorum are used in traditional medicine as bitter, thermogenic, astringent, anthelmintic, diaphoretic, diuretic, expectorant, ophthalmic and tonic. The seeds are also useful for haemorroids, tumors, bronchitis, splenomegaly, kidney stones and in asthma[9].
Fructose has been implicated as a contributor to nearly all of the classic manifestations of the metabolic syndrome[10,11]. In Sprague-Dawley rats, feeding a high-fructose diet induces an increase in blood pressure associated with hyperinsulinemia and hyperlipidemia, a pathologic status resembling human type 2 diabetes. Hence, in this model, rats were given fructose in drinking water to induce cardiac abnormalities associated with the metabolic syndrome.
An anti-hypercholesterolemic effect of Macrotyloma uniflorum extract on high fat diet-induced hypercholesterolemia in Sprague-Dawley rats has been reported[12]. Ferulic acid has also been shown to possess potent anti-diabetic, anti-cholesterolemic and cardioprotective activities[13,14]. Horse gram contains ferulic acid as one of its phenolic components. This study was thus undertaken to quantify ferulic acid in MUSE and to evaluate the protective effect of MUSE and ferulic acid in fructose induced hyperlipidemia and cardiac abnormalities in rats.
Materials and Methods
Plant material
The raw seeds of Macrotyloma uniflorum were purchased from the grain market, Mumbai, India on order and authenticated at the Blatter Herbarium, St. Xavier's College, Mumbai after matching with the existing specimen (specimen no. AD-6). The seeds were air dried under shade, powdered mechanically and stored in air tight containers. The powder was extracted using a mixture of ethanol: water (80:20) v/v in a Soxhlet apparatus. This extract was dried and stored in a refrigerator for further use.
Isolation of ferulic acid by preparative HPTLC
After successful development of TLC, preparative High Performance Thin Layer Chromatography (HPTLC) of the hydroalcoholic extract of the seeds of Macrotyloma uniflorum (MUSE) was carried out on the CAMAG HPTLC system for isolation and identification of ferulic acid. The absorbance value of different bands in the crude extract after TLC separation was studied using the Desaga Scanner for the most possible wavelength absorption of ferulic acid. Prior to MUSE application, HPTLC plates (HPTLC Silica gel 60 F254, Merck) of 10 x 10 cm were activated at 110°C for 30min. MUSE (100 mg) was dissolved in 10 ml of methanol and 100 μL of this solution was applied as a single band of 180mm length on the activated HPTLC plates using a Linomat V applicator (CAMAG, Switzerland). The plates were then developed with 10ml of the solvent system comprising toluene: ethyl acetate: formic acid (6.8:2.3:0.9) in a twin trough chromatographic chamber and examined at 320 nm[15]. After development, the constituent at Rf 0.72 was marked and scraped out from the plate. The scraped material was mixed with methanol and eluted from silica gel by centrifugation at 3000 rpm. The supernatant was evaporated on a water bath to get ferulic acid. Further confirmation of the isolated constituent was done by using UV–Visible, IR and NMR spectroscopies for major functional groups.
Quantification of ferulic acid using HPLC
Chemicals and Reagents
HPLC grade methanol, acetonitrile and analytical grade formic acid were procured from Merck® India Ltd. (Mumbai). All the solvents and solutions were filtered through a membrane filter (Millipore filter paper, 0.45 μm pore size) and degassed before use. Standard ferulic acid was procured from Sigma-Aldrich Pvt. Ltd., MO, USA.
Instrumentation and Materials
Analysis was performed on Jasco HPLC system with Jasco PU-2080 Plus Quaternary Gradient HPLC Pump and in-built Jasco MD-2010 Plus PDA multi wavelength detector. Chromatographic software Chrompass was used for data collection and processing. The analytical column was LC-GC Qualisil BDS C 18 (5 μm, 250 mm x 4.6 mm).
Chromatographic Conditions
Chromatographic separation of ferulic acid was carried out using an isocratic mobile phase comprising water: acetonitrile (80:20) v/v, adjusted with formic acid to a pH of 3.5[16]. A well resolved and sharp peak with a retention time (Rt) of 7.8 min was obtained. The flow rate was maintained at 1.0 mL/min and the detection carried out at 320 nm.
Preparation of standards
A stock solution (1000 μg/ml) was prepared by dissolving 10 mg of ferulic acid in 10 ml of methanol.This solution was further diluted with the mobile phase to give a stock solution of 100 μg/mL. Further dilutions were made as required with the mobile phase.
Preparation of calibration curve
The calibration curve was prepared by injecting various concentrations (10 – 50 μg/mL) of the standard ferulric acid solution.
Quantification of ferulic acid in MUSE
MUSE (100 mg) was dissolved in 10 ml methanol to yield a solution of 10 mg/mL. This solution (20 μL) was injected and the elution was carried out using the mobile phase mentioned earlier. The amount of ferulic acid in MUSE was calculated from the calibration curve.
Drugs and chemicals
Epinephrine, 5, 5′-Dithiobis (2-nitrobenzoic acid) - (DTNB) and trichloro acetic acid (TCA) were purchased from Sigma Chemical Co., St Louis, MO, USA. Thiobarbituric acid (TBA), reduced glutathione, oxidized glutathione and nicotinamide adenine dinucleotide phosphate (NADPH) were obtained from Himedia Laboratories, Mumbai, India. All other chemicals were obtained from local sources and were of analytical grade.
Animals
Albino Sprague Dawley rats (120-150 g) of either sex were used. They were housed in clean polypropylene cages under standard conditions of humidity (50 ± 5%), temperature (25 ± 2°C) and light (12 h light/12 h dark cycle) and fed with a standard diet (Amrut laboratory animal feed, Pune, India) and water ad libitum. All animals were handled with humane care. Experimental protocols were reviewed and approved by the Institutional Animal Ethics Committee (Animal House Registration No. 25/1999/CPCSEA) and conform to the Indian National Science Academy Guidelines for the Use and Care of Experimental Animals in Research.
Preparation of test solutions and drinking water
Fructose solution (25 % w/v in distilled water) was prepared every day and given as drinking water to animals of all test groups. The dry extract of Macrotyloma uniflorum seed extract (MUSE) was dissolved in distilled water and the aqueous solution was used for administration. Ferulic acid was suspended in an aqueous solution of 1% carboxymethyl cellulose (C.M.C) and administered orally.
Experimental procedure
Animals, after acclimatization (6 –7 days) in the animal quarters, were randomly divided into 5 groups of 12 animals each (Groups I to V) and an additional group, viz., Group VI comprising of 6 animals only. All animals were treated in the following way:
Group I (Normal control): Rats received distilled water for 45 days
Group II (Fructose control): Rats received fructose (25 % w/v) in drinking water for 45 days.
Group III (MUSE 200): Rats received fructose (25 % w/v) in drinking water and MUSE (200 mg/kg, p.o.) once daily for 45 days
Group IV (MUSE 400): Rats received fructose (25 % w/v) in drinking water and MUSE (400 mg/kg, p.o.) once daily for 45 days
Group V: Rats received fructose (25 % w/v) in drinking water and ferulic acid (80 mg/kg, p.o.) once daily for 45 days
Group VI (Standard): Rats received fructose (25 % w/v) in drinking water and Gemfibrozil (60 mg/kg, p.o.) once daily for 45 days
All animals were given normal chow diet and drinking water ad libitum. Body weight was observed at the beginning and once weekly till the end of the study. Oral glucose tolerance test was performed in animals of groups I to V on the last day of treatment, the 45th day and blood glucose was measured using an automated digital glucometer (Accu-Chek Advantage, Roche, USA). All animals were fasted overnight after the last treatment and sacrificed by cervical dislocation. Blood was collected by cardiac puncture, a drop was used for glucose measurement and the remaining was allowed to clot for 30 min at room temperature. Serum was separated by centrifugation at 2500 rpm at 30°C for 15 min and used for the estimation of total cholesterol (TC), triglycerides (TG), high density lipoprotein (HDL) and marker enzymes viz., AST, LDH and CK-MB. The hearts of the animals from groups I to V were dissected immediately washed with ice-cold saline and weighed. The left ventricles were separated and weighed. A part of the left ventricular tissue was removed and estimated for hydroxyproline to determine its collagen content. Hearts were homogenized with phosphate buffer (pH- 7) and an aliquot was used for the estimation of lipid peroxidation (LPO). The homogenates were centrifuged at 7000 × g for 10 min at 4°C and the supernatants were used for the assays of AST, LDH, CK-MB, reduced glutathione (GSH), superoxide dismutase (SOD), catalase(CAT), glutathione peroxidase (GPx) and glutathione reductase (GR). Hearts of the remaining 6 animals from groups I to V were also dissected, washed with ice-cold saline, fixed in 10% buffered formalin and used for histological studies.
Low density lipoprotein (LDL) and very low density lipoprotein (VLDL) were calculated as per Friedevald's equation as follows:
VLDL = Total serum triglycerides/5
LDL = Total serum cholesterol – VLDL – HDL
The atherogenic index (AI) was calculated using the following formula AI = (TC-HDL) / HDL.
Cardiac hypertrophy index (ratio of heart weight to body weight) & left ventricular hypertrophy index (ratio of left ventricular weight-to-heart weight) were measured from heart, body and left ventricle.
Oral glucose tolerance test
Animals received glucose solution (1.5 g/kg) orally 30 minutes after their respective treatments. Blood glucose levels were determined at 0, 30, 90 and 120 min after glucose administration.
Determination of collagen
Measurement of the hydroxyproline content is used as an index for collagen turnover. The L-hydroxyproline of the left ventricle was estimated by the method of Bergman and Loxley[17]. A part of the left ventricular tissue (250 mg) of each animal was dried at 60°C for 24h and 100 mg was was hydrolyzed with 6N HCl at 110°C for 4h and neutralized with 10N NaOH. To 2 ml of this solution, 1 ml of the oxidant solution [1 ml of 7 % w/v aqueous Chloramine T solution and 4ml of acetate citrate buffer (pH-6)] was added and the color was developed by adding 13 ml of the Ehrlich reagent. The absorbance of the color was measured at 558 nm against reagent blank. The concentration of hydroxyproline was determined by extrapolating from the standard curve and was expressed as mg /g tissue.
Total cholesterol, Triglyceride and HDL estimation
Total cholesterol (TC) levels were determined in the serum of experimental animals by the CHOD-PAP method using kits supplied by Erba (Mumbai, India).
HDL levels were determined in the serum of experimental animals by the Phosphotungstic Acid method using kits supplied by Erba (Mumbai, India).
Trigycerides (TG) levels were determined in the serum of experimental animals by the GPO-Tinder Method method using kits supplied by Erba (Mumbai, India).
The above results were expressed as mg/dL.
Marker enzyme assays
The marker enzymes AST, LDH, CK-MB were assayed in serum and homogenised tissue using standard kits supplied by Erba (Mumbai, India). The results were expressed as IU/L.
Lipid peroxidation
The quantitative estimation of LPO was performed by determining the concentration of thiobarbituric acid reactive substances (TBARS) in the liver using the method of Buege and Aust[18]. The amount of malondialdehyde (MDA) formed was quantified by reaction with TBA and used as an index of lipid peroxidation. The results were expressed as nanomole of MDA per gram of wet tissue using molar extinction coefficient of the chromophore (1.56 × 10⁻⁵/M/cm) and 1,1,3,3-tetraethoxypropane as standard.
Glutathione estimation
GSH level was estimated in the liver homogenate using DTNB by the method of Ellman[19] . The absorbance was read at 412 nm and the results were expressed as μmol/gm of wet liver.
Antioxidant enzyme assays in heart homogenate
SOD was assayed by the method of Sun and Zigman in which the activity of SOD was inversely proportional to the concentration of its oxidation product adrenochrome, which was measured spectrophotometrically at 320 nm[20]. One unit of SOD activity is defined as enzyme concentration required to inhibit the rate of auto-oxidation of epinephrine by 50% in 1 min at pH 10.
CAT was estimated by the method of Clairborne, which is a quantitative spectroscopic method developed for following the breakdown of H2O2 at 240 nm in unit time for routine studies of CAT kinetics[21].
GPx estimation was carried out using the method of Rotruck et al which makes use of the following reaction[22]:
H2O2 + 2GSH → 2H2O + GSSG (oxidized glutathione).
GPx in the tissue homogenate oxidizes glutathione and simultaneously, H2O2 is reduced to water. This reaction is arrested at 10 minute using trichloroacetic acid and the remaining glutathione is reacted with freshly prepared DTNB solution to result in a coloured compound, which is measured spectro photometrically at 420 nm. Sodium azide inhibits catalase activity. GR activity was determined by using the method of Mohandas et al in which the following reaction is implicated[23]:
NADPH + H+ + GSSG → NADP+ + 2GSH
In the presence of GR, oxidized glutathione undergoes reduction and simultaneously, NADPH is oxidized to NADP+. Enzyme activity is quantified at room temperature by measuring the disappearance of NADPH/min at 340 nm spectro photometrically.
Histopathological Studies
Hearts stored in 10% buffered formalin were embedded in paraffin, sections cut at 5 μm and stained with hematoxylin and eosin. These sections were then examined under a light microscope for histo-architectural changes.
Statistical analysis
The results of cardio protective and antioxidant activities are expressed as mean ± SEM from 6 animals in each group. Results were statistically analyzed using one-way ANOVA followed by Bonferroni's Multiple Comparison test; P < 0.05 was considered significant. GraphPad Version 5.00 of Graph Pad Software Inc., San Diego, USA was the software used for statistical analysis.
Results
Quantification of ferulic acid in MUSE by HPLC
Figures 1a & 1b are HPLC chromatograms for standard ferulic acid and MUSE respectively. From the calibration curve (Figure 2), the amount of ferulic acid present in MUSE was 0.4655% w/w.
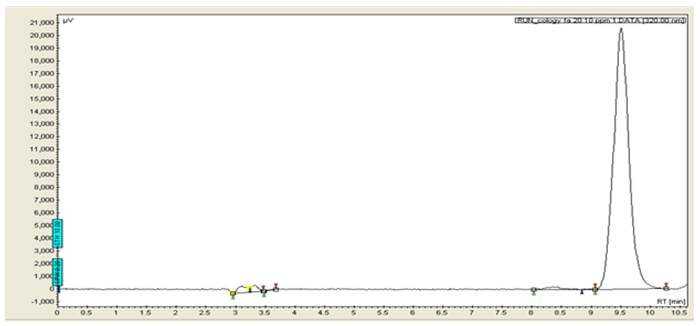
Figure 1a: HPLC chromatogram for standard ferulic acid at 320 nm
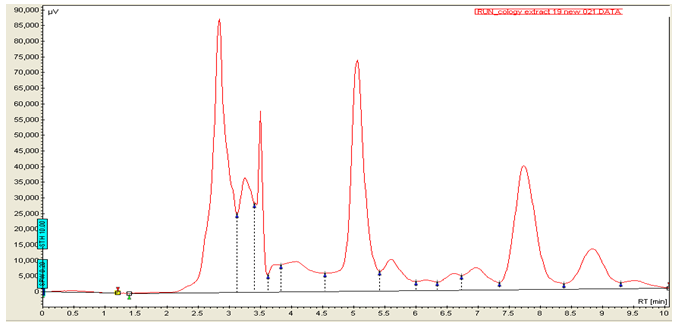
Figure 1b: HPLC chromatogram for MUSE at 320 nm
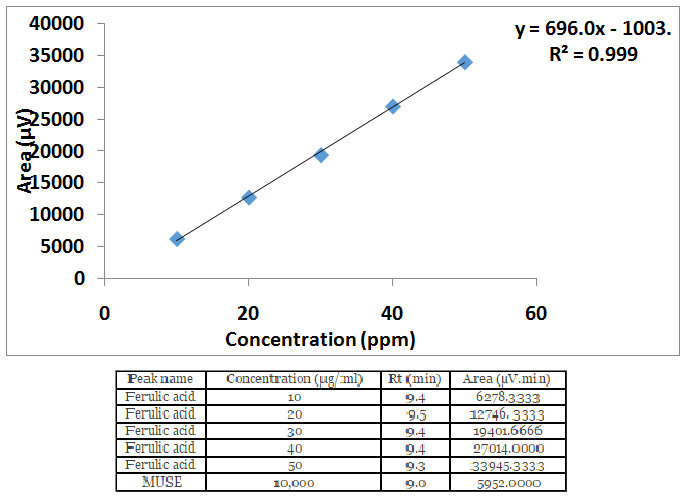
Figure 2: Calibration curve of standard ferulic acid by HPLC
| Peak name | Concentration (μg/ml) | Rt (min) | Area (μV.min) |
|---|---|---|---|
| Ferulic acid | 10 | 9.4 | 6278.3333 |
| Ferulic acid | 20 | 9.5 | 12746. 3333 |
| Ferulic acid | 30 | 9.4 | 19401.6666 |
| Ferulic acid | 40 | 9.4 | 27014.0000 |
| Ferulic acid | 50 | 9.3 | 33945.3333 |
| MUSE | 10,000 | 9.0 | 5952.0000 |
Effect on heart parameters and blood glucose (Table 1)
Administration of fructose for 45 days in drinking water to rats caused a significant increase in cardiac hypertrophy index (CHI), left ventricular hypertrophy index (LVHI) and blood glucose in the fructose control group when compared with the Normal control group of rats. At the end of the 45 day treatment, CHI, LVHI and blood glucose levels of ferulic acid, MUSE 200 and MUSE 400 treatment groups were found to be significantly lower than that of the fructose administered group of animals. Ferulic acid treatment showed a better effect than MUSE 200 treatment and was comparable to MUSE 400.
Table 1: Effect of MUSE and ferulic acid on heart parameters and blood glucose in fructose treated rats
| GROUPS | CHI (mg/g) | LVHI(g/g) | Glucose (mg/dL) |
|---|---|---|---|
| Normal | 3.257 ± 0.039 | 0.4273 ± 0.0023 | 89.35 ± 5.10 |
| Fructose control | 4.06 ± 0.05a | 0.5508 ± 0.0041a | 148.4 ± 3.9a |
| MUSE 200 (200mg/kg) | 3.746 ± 0.011*** | 0.4988 ± 0.0043*** | 119.7 ± 4.1*** |
| MUSE 400 (400mg/kg) | 3.629 ± 0.007*** | 0.4697 ± 0.0040*** | 0.4697 ± 0.0040*** 106.6 ± 3.4*** |
| Ferulic acid (80mg/kg) | 3.354 ± 0.038*** | 0.4485 ± 0.0020*** | 99.4 ± 3.5*** |
All values are expressed as Mean ± SEM, N=6 in each group
One-way Anova followed by Bonferroni's Multiple Comparison test is applied for statistical analysis
P values: a p < 0.001 when Fructose control group is compared with Normal group *** p < 0.001 when treatment groups are compared with Fructose control group
Effect on oral glucose tolerance test (Figure 3)
Animals given only fructose in drinking water were found to have impaired glucose tolerance with high glucose levels after glucose load when compared with the Normal control animals. Oral administration of MUSE daily to fructose fed rats significantly improved the impaired glucose tolerance when compared with the fructose control group of rats. MUSE 400 exhibited a better effect than MUSE 200 and was comparable with ferulic acid.
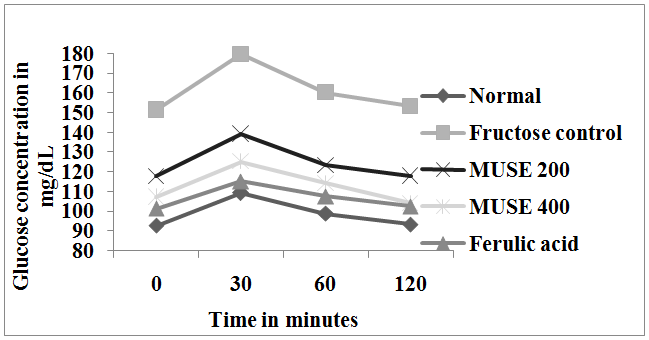
Figure 3: Effect of MUSE and ferulic acid on oral glucose tolerance test in fructose treated rats
Effect on lipid profile (Figures 4 & 5)
Fructose administration in drinking water to rats for 45 days significantly increased the levels of TC, TG, LDL and VLDL and the atherogenic index, and decreased the HDL levels in blood. Oral administration of MUSE, ferulic acid and the reference standard gemfibrozil to fructose fed rats for 45 days significantly attenuated the fructose elevated levels of TC, TG, LDL and VLDL and the atherosclerotic index, and elevated the fructose depleted HDL levels when compared with the fructose control group of animals. MUSE 400 showed a better effect than MUSE 200 and was comparable to ferulic acid treatment. Gemfibrozil treatment elicited the lowest TC, TG, LDL and VLDL levels and the highest HDL levels amongst all treatment groups.
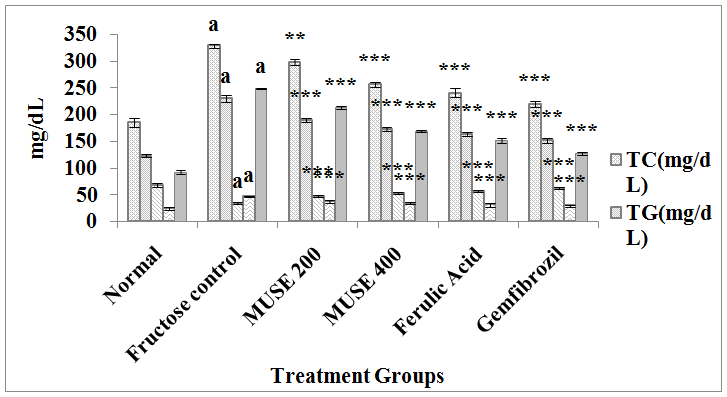
Figure 4: Effect of MUSE and ferulic acid on lipid profile in fructose treated rats
All values are expressed as Mean ± SEM, N=6 in each group
One-way Anova followed by Bonferroni's Multiple Comparison test is applied for statistical analysis
P values: a p < 0.001 when Fructose control group is compared with Normal group,
*** p < 0.001, **p < 0.01 when treatment groups compared with Fructose control group
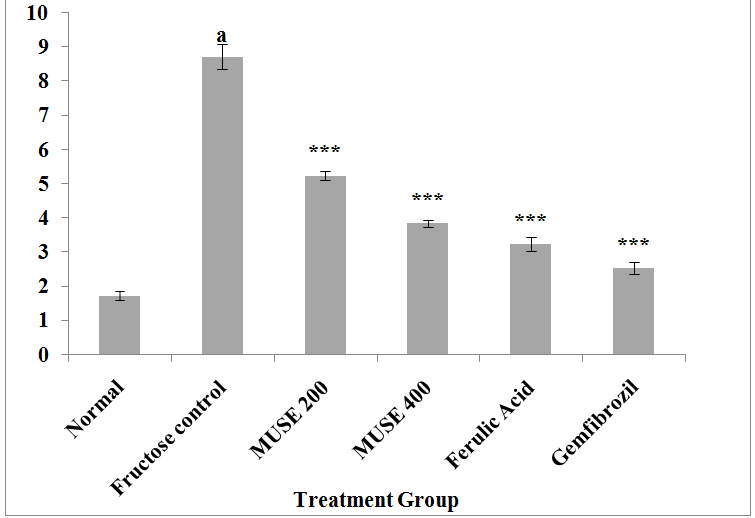
Figure 5: Effect of MUSE and ferulic acid on the atherogenic index (AI) in fructose treated rats
All values are expressed as Mean ± SEM, N = 6 in each group
One-way Anova followed by Bonferroni's Multiple Comparison test is applied for statistical analysis
P values : ap < 0.001 when Fructose control group is compared with Normal group
***p < 0.001 when treatment groups compared with Fructose control group
Effect on collagen, serum marker enzymes and heart marker enzymes
The hydroxyproline, thus, collagen levels of the fructose administered rats were found to be significantly higher than those of the Normal group rats. MUSE 200, MUSE 400 and ferulic acid treatments brought about a significant depletion of the elevated collagen levels when compared with the fructose control rats (Figure 6). MUSE 400 and ferulic acid produced better effects than MUSE 200.
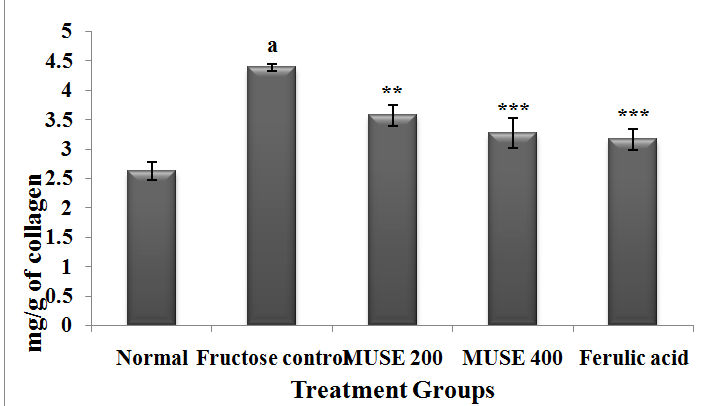
Figure 6: Effect of MUSE and ferulic acid on ventricular collagen in fructose treated rats
All values are expressed as Mean ± SEM, N=6 in each group
One-way Anova followed by Bonferroni's Multiple Comparison test is applied for statistical analysis
P values :ap < 0.001 when Fructose control group is compared with Normal group
*** p < 0.001, **p < 0.01 when treatment groups are compared with Fructose control group
Activities of the marker enzymes AST, LDH and CKMB were noted to be significantly elevated in the sera of the fructose control group of rats. MUSE (200 & 400mg/kg) and ferulic acid treatments elicited significant cardioprotective activity by attenuating the fructose – elevated activities of AST LDH and CK-MB in serum (Figure 7). MUSE 400 was as effective as ferulic acid in its cardioprotective activity.
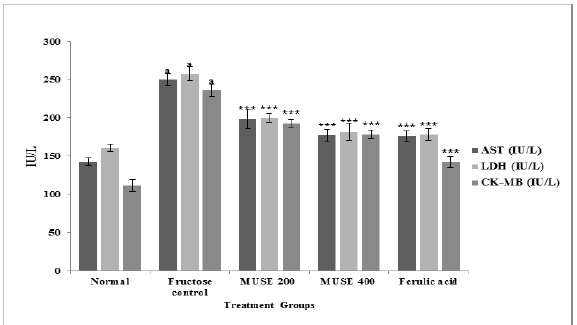
Figure 7: Effect of MUSE and ferulic acid on serum AST, LDH and CK-MB in fructose treated rats
All values are expressed as Mean ± SEM, N=6 in each group
One-way Anova followed by Bonferroni's Multiple Comparison test is applied for statistical analysis.
P values :ap < 0.001 when Fructose control group is compared with Normal group
*** p < 0.001 when treatment groups are compared with Fructose control group.
Marker enzyme activities of AST, LDH and CK-MB were assayed in the cardiac tissue and found to be significantly depleted in the fructose fed rats when compared with the Normal rats. MUSE 200, MUSE 400 and ferulic acid treatment for 45 days caused a significant restoration in the activities of AST, LDH and CK-MB depleted due to fructose administration. (Figure 8)
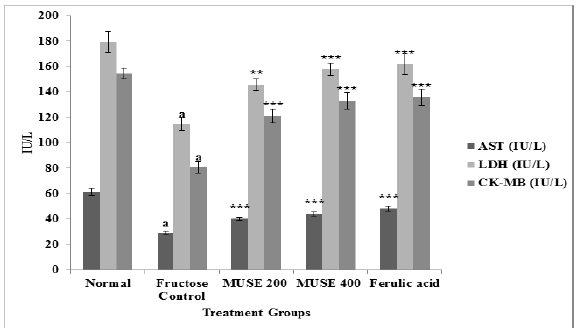
Figure 8: Effect of MUSE and ferulic acid on heart AST, LDH and CK-MB in fructose treated rats
All values are expressed as Mean ± SEM, N=6 in each group
One-way Anova followed by Bonferroni's Multiple Comparison test is applied for statistical analysis.
P values: ap < 0.001 when Fructose control group is compared with Normal group
*** p < 0.001, **p < 0.01 when treatment groups compared with Fructose control group.
Effect on LPO, GSH and antioxidant enzymes
The effects of MUSE and ferulic acid on LPO, GSH and antioxidant enzymes are summarized in Tables 2 and 3. MDA, the lipid peroxidation marker was significantly elevated in the fructose fed group of rats when compared with the Normal group. Treatment with MUSE (200 mg/kg and 400 mg/kg) and ferulic acid prevented significantly the increased formation of MDA.
Table 2: Effect of MUSE and ferulic acid on heart GSH, GPx and GR in fructose treated rats
| Groups | GSH μmol/g wet tissue | GPx Unit/mg protein | GR Unit/mg protein |
|---|---|---|---|
| Normal group | 3.238 ± 0.173 | 14.6 ± 0.7 | 246.9 ± 9.7 |
| Fructose control group | 1.099 ± 0.289a | 5.395 ± 0.558a | 173.8 ± 5.8a |
| MUSE 200 (200 mg/kg) | 1.737 ± 0.108** | 9.369 ± 0.597*** | 223.8 ± 8.9** |
| MUSE 400 (400 mg/kg) | 2.025 ± 0.095*** | 10.24 ± 0.38*** | 233.6 ± 12.6*** |
| Ferulic acid (80 mg/kg) | 2.772 ± 0.134*** | 11.01 ± 0.48*** | 234.2 ± 10.8*** |
All values are expressed as Mean ± SEM, N=6 in each group
One-way Anova followed by Bonferroni's Multiple Comparison test is applied for statistical analysis
P values : ap < 0.001 when Fructose control group is compared with Normal group
: *** p < 0.001, **p < 0.01 when treatment groups compared with Fructose control group
Table 3: Effect of MUSE and ferulic acid on heart LPO, SOD and CAT in fructose treated rats
| Groups | LPO nmol MDA/g wet tissue | SOD U/mg protein | CAT U/mg protein |
|---|---|---|---|
| Normal group | 24.86 ± 1.20 | 20.06 ± 1.14 | 34.50 ± 2.59 |
| Fructose control group | 42.61 ± 1.19a | 12.23 ± 1.01a | 17.59 ± 1.29a |
| MUSE 200 (200mg/kg/day) | 31.12 ± 1.72** | 18.45 ± 0.68* | 28.04 ± 1.40** |
| MUSE 400 (400mg/kg/day) | 29.95 ± 2.57*** | 19.29 ± 0.81*** | 29.84 ± 0.97*** |
| Ferulic acid(80mg/kg) | 28.83 ± 1.67*** | 19.65 ± 0.47*** | 30.29 ± 1.24*** |
All values are expressed as Mean ± SEM, N = 6 in each group
One-way Anova followed by Bonferroni's Multiple Comparison test is applied for statistical analysis
P values :ap < 0.001 when Fructose control group is compared with Normal group
: *** p < 0.001, **p < 0.01 when treatment groups compared with Fructose control group
Significant decline in GSH was observed in the fructose control group of rats when compared with the Normal group of rats. MUSE (200 mg/kg and 400 mg/kg) and ferulic acid treatments significantly restored the declined GSH levels.
SOD, CAT, GPx and GR activities in the heart homogenate of the fructose control group of animals were found to be significantly depleted when compared with those in the normal animals. MUSE at both doses and ferulic acid treatment restored significantly the antioxidant enzyme activities depleted due to the fructose provided in drinking water, thus exhibiting a strong antioxidant activity.
Histopathological studies
Histopathological studies on heart tissue of Normal control group rats revealed a normal histoarchitecture with intact cardiac muscle fibres and blood vessels without sign of separation, edema or any other abnormality (Figure 9a). Heart tissues of fructose fed rats showed myocardial degeneration, mononuclear infiltration and separation of cardiac muscle fibres, vacuolation and congestion (Figure 9b). Treatment with MUSE (200 mg/kg and 400 mg/kg) showed a dose dependent decrease in the level of congestion, edema and infiltration of inflammatory cells when compared with the fructose control group of rats (Figures 9c & d). MUSE 400 mg/kg administration showed maximum protection which was comparable with ferulic acid treatment. The ferulic acid group showed less severity of lesions like myocardial degeneration and vacuolation when compared with the fructose control group of rats (Figure 9e).
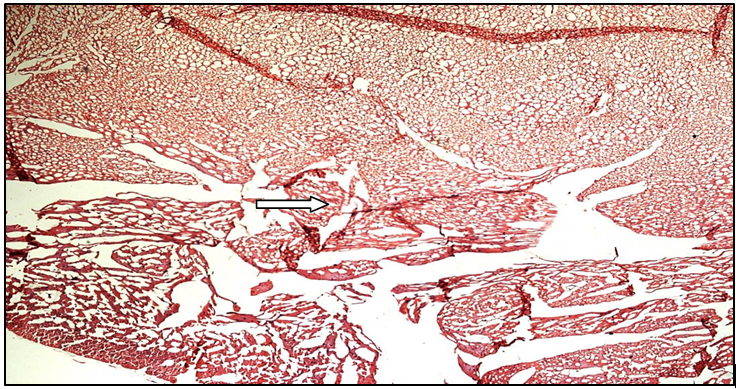
Figure 9a: Histopathological image of normal heart
White arrow shows normal myocardial fibres
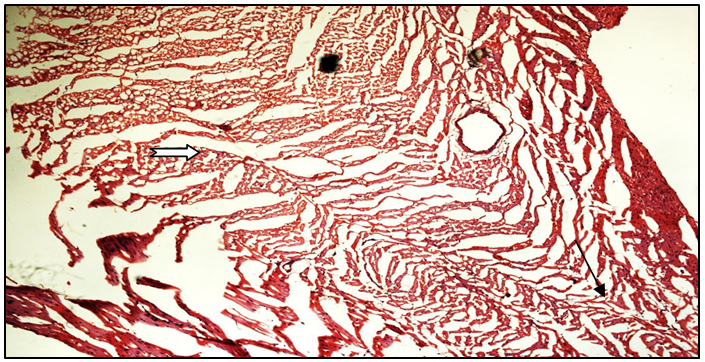
Figure 9b: Histopathological image of fructose fed heart
Black arrow shows severe myofibrillar loss; White arrow shows cytoplasmic vacuolization
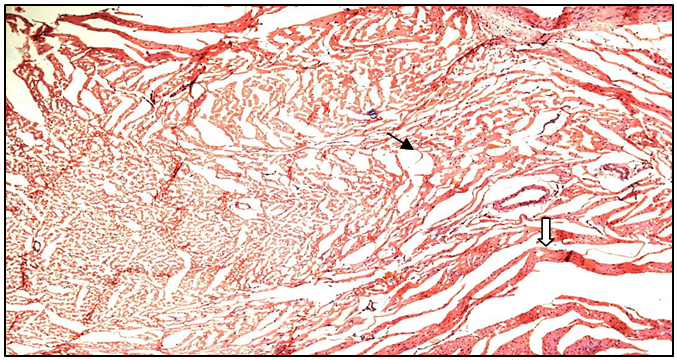
Figure 9c: Histopathological image of MUSE 200 heart
Black arrow shows minimal separation of myocardial fibres; White arrow shows myofibrillar loss
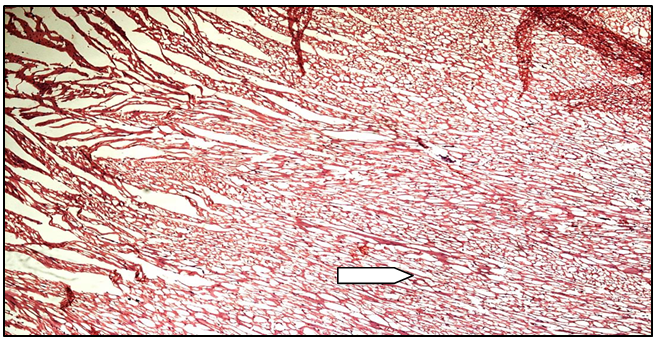
Figure 9d: Histopathological image of MUSE 400 heart
White arrow shows moderate degree of vacuolization of myocardial fibres. No myocardial loss.
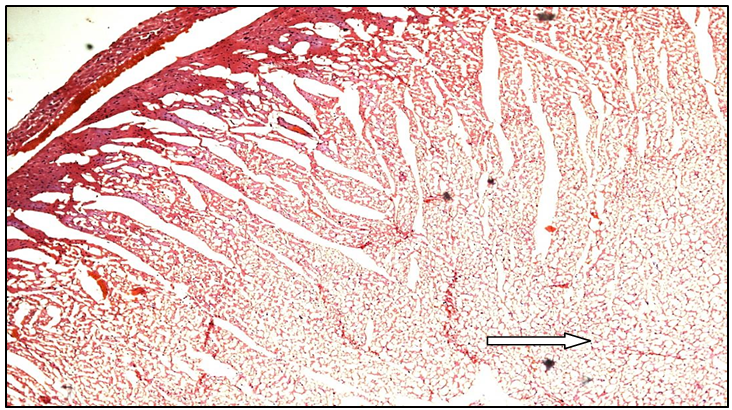
Figure 9e: Histopathological image of ferulic acid heart
White arrow shows moderate degree of cytoplasmic vacuolisation of myocardial fibres without any evidence of myocardial cell loss (similar to MUSE 400 group)
Discussion
Fructose has been reported to induce hypertriglyceridemia associated with insulin resistance in rats causing hyperglycemia seen in Type 2 diabetes, hyperinsulinemia and hypertension[24].
After absorption in GIT, fructose is transported via portal circulation to the liver, where it enters hepatocytes via the glucose transporter GLUT- 5 independently of insulin and is rapidly metabolised. Fructose is metabolised into "glycerol-3-phosphate" and "acetyl CoA". These two intermediate metabolites are then used as substrates for glyceride synthesis, contributing to VLDL and TG production in liver. The exposure of liver to such large quantities of fructose leads to rapid stimulation of lipogenesis and TG accumulation which in turn contributes to reduced insulin sensitivity and hepatic insulin resistance/glucose intolerance[25, 26].
Fructose itself can create oxidative stress by its metabolism[27]. Possible mechanisms for direct induction of oxidative stress can be depletion of ATP due to increased catabolism of fructose, down regulation of HMP shunt by fructose, increased aldehyde formation and decreased generation of reducing equivalents. Fructose also causes increased production of H2O2. An increase in production of H2O2 and hydroxyl radicals in hamster pancreatic cells incubated with fructose in the presence of a metal ion catalyst has been reported[28]. Increase in production of reactive free radicals and oxidative stress contributes to development of insulin resistance and hence hyperlipidemia. A number of studies on fructose fed rats have been reported suggesting an anti-hyperlipidemic effect of drugs having inhibitory effects on oxidative stress and generation of free radicals[29,30]. In our study, fructose administration exhibited an elevation in plasma levels of triglycerides, total cholesterol, LDL and a decrease in the level of plasma HDL. These findings are consonant with the lipogenic mechanism of fructose. Treating fructose fed rats with MUSE and ferulic acid for 45 days decreased the fructose-elevated levels of TG, TC, VLDL and LDL and elevated the fructose-decreased levels of HDL. Treatment with MUSE and ferulic acid also decreased the Atherosclerotic Index elevated by fructose feeding to rats.
Gemfibrozil is a current drug from the fibrate class of lipid modifying agents. Since, it is used successfully in the treatment of hypercholesterolemia, hypo alphalipoproteinemia (low plasma HDL) and hypertriglyceridemia clinically, it was used as a reference standard in the present study for evaluation of the anti-hyperlipidemic activity of MUSE and ferulic acid associated with the metabolic syndrome.
According to the Randle's glucose-fatty acid cycle, increased supply of plasma triglycerides leads to increased free fatty acid (FFA) availability and their oxidation that can impair insulin action and glucose metabolism and utilization, leading to development of hyperglycemia[31]. Oral administration of MUSE to rats fed with fructose-rich diet substantially prevented hyperglycemia and hyperlipidemia. Blood glucose levels were higher in fructose fed animals than in Normal control animals. Treatment with MUSE and ferulic acid decreased the blood glucose levels significantly when compared with fructose-rich treatment. Similarly, impaired glucose tolerance observed in fructose fed rats was also improved significantly by MUSE and ferulic acid treatments.
Myocardium contains an abundant concentration of marker enzymes – AST, LDH & CK-MB which serve as a sensitive index to assess the degree of myocardial necrosis. Fructose fed rats exhibited increased activities of the marker enzymes in serum accompanied by their concomitant reduction in heart, indicating the onset of myocardial necrosis.
Mitochondrial dysfunction is closely related to ROS formation and has been considered to play a critical role in the development of diabetic cardiomyopathy[32]. Free radicals generated due to hyperglycemia are known to initiate LPO of membrane bound PUFAs, leading to damage of the structural and functional integrity of the myocardium. The myocardium once impaired, releases its marker enzymes into the blood. Hence, the activities of AST, LDH and CK-MB were found to be decreased in the heart homogenate of fructose fed rats when compared with normal rats, which is indicative of cellular injury possibly due to lipid peroxide formation. Attenuation of the serum AST, LDH and CK-MB activities and their elevation in heart by MUSE and ferulic acid oral treatment indicates a cardioprotective effect of MUSE and ferulic acid.
The collagen levels, cardiac hypertrophy index (CHI) and left ventricular hypertrophy (LVHI) index in fructose fed rats were found to be significantly higher than in the normal rats. In cardiac hypertrophy, connective tissue formation and thus, an increase in collagen content in the heart is observed[33]. Modification of the structure and properties of collagen due to extensive cross linking has been reported in aging and in various pathological conditions including diabetes[34]. The protein cross linking that occurs in diabetes in vivo could be fructose induced. Sakai et al have reported that fructose enhanced the reactive oxygen or oxygen radical generation and the associated degeneration of proteins and lipids by peroxidation reactions through free radical formation[35]. Malondialdehyde, an end product of lipid peroxidation can react with the free amino groups of collagen and stimulate cross-linking[36]. These data indicate that oxidative stress from hyperglycemia-induced ROS is involved in the pathogenesis of diabetic cardiomyopathy. Ferulic acid and MUSE treatment showed significant decrease in collagen content of heart when compared with hearts of fructose fed rats. These effects may be attributed to the antioxidant potential of ferulic acid and other active phyto-constituents of MUSE.
Lipid peroxidation has been identified as one of the basic deteriorative reactions in cellular mechanisms during free radical induced myocardial injury. The increased levels of MDA indicate excessive formation of free radicals by fructose and activation of the lipid peroxidative process, resulting in irreversible damage to heart in animals. MUSE and ferulic acid treatment significantly decreased the MDA levels by preventing formation of lipid peroxides from fatty acids.
It is worthwhile to note that the contractile function of the heart dictates its high metabolic demand, and the mitochondrial respiratory chain is the primary energy-releasing system in these cells. Through this respiratory chain, a series of oxidation–reduction reactions continually takes place in cardiomyocytes. Therefore, an efficient antioxidant system including GSH and the antioxidant enzymes SOD, CAT, GPx and GR would be critical to myocardium. However, as discussed above, hyperglycemia can impair and decrease antioxidant capacity in the heart, making it more vulnerable to ROS induced damage.
Myocardial GSH was significantly lower in fructose fed rats compared to normal rats. MUSE and ferulic acid showed a significant increase in GSH when compared with only fructose fed rats. Decreased GSH levels in fructose treated rats may be due to its enhanced utilization for augmenting the activities of GPx and GR. Fructose depleted glutathione levels were significantly restored by MUSE and ferulic acid oral administration. In the present study, SOD activity decreased significantly in the fructose fed group of animals may be due to an excessive formation of superoxide anions. The activities of H2O2 scavenging enzymes CAT and GPx also decreased significantly in fructose fed animals. The excessive superoxide anions formed lead to inactivation of SOD. In the absence of adequate SOD activity, superoxide anions are not dismuted into H2O2, which is the substrate for CAT and GPx. This probably results in an inactivation of these enzymes. Administration of MUSE and ferulic acid effectively prevented the decrease in SOD and CAT activities, which may be largely correlated to the scavenging of free radicals by MUSE and ferulic acid, resulting in prevention of depletion of these enzymes.
GR is an antioxidant enzyme involved in reduction of GSSG (an end product of GPx reaction) to GSH. In fructose fed rats there was a marked reduction in GPx activity, leading to reduced availability of substrate for GR, resulting in decreased activity of GR. Treatment of MUSE and ferulic acid to fructose fed rats restored the activity of GR, thus accelerating the conversion of GSSG to GSH.
Cardiac abnormalities induced by the metabolic Syndrome were further assessed using histomorphology of the heart. Rat hearts from fructose treated animals revealed cytoplasmic vacuole formation, leukocyte infiltration and myofibrillar loss, which is a typical finding in fructose induced cardiomyopathy. These changes were significantly reduced in animals which received MUSE and ferulic acid.
Phenolic compounds act by scavenging free radicals and quenching the lipid peroxides. The hydroxyl and phenoxy groups of phenolic compounds donate their electron to free radicals and neutralize them, forming phenolic radicals and quinone methide intermediates, which are excreted via bile[37]. Reports have suggested that ferulic acid has the greatest antioxidant activity among the phenolic acids of horse gram and is an efficient scavenger of different free radicals, including superoxide anion (O2−), hydroxyl radical (OH•), nitric oxide (NO•) and peroxyl radical (ROO•)[38]. Toda et al have reported ferulic acid to scavenge the superoxide anion radical and inhibit the ensuing LPO, this effect being similar to SOD[39]. It has been approved in certain countries as food additive to prevent lipid peroxidation[40]. The acute oral LD50 of ferulic acid in male and female F344 rats is reported to be 2445 mg/kg and 2133 mg/kg. respectively[41]. It, thus, presents very low toxicity.
The antioxidant potential of ferulic acid can usually be attributed to its structural characteristics (Figure 10a). Ferulic acid because of its phenolic nucleus and unsaturated side chain can readily form a resonance-stabilized phenoxy radical, which accounts for its potent antioxidant activity. Any reactive radical colliding with ferulic acid easily abstracts a hydrogen atom to oxidize it to a phenoxy radical. This radical is highly resonance-stabilized as the unpaired electron may be present not only on the oxygen but it can also be delocalized across the entire molecule (Figure 10b). Additional stabilization of the phenoxy radical is provided by the extended conjugation in the unsaturated side chain. This resonance stabilization accounts for the effective antioxidant property of ferulic acid. Moreover, this phenoxy radical is unable to initate or propagate a radical chain reaction, and its most probable fate is a collision and condensation with another ferulate radical to yield the dimer curcumin. Such coupling may lead to a host of products, all of which still contain phenolic hydroxyl groups capable of radical scavenging. The presence of a second phenolic hydroxyl group substantially enhances the radical scavenging activity due to additional resonance stabilization and o-quinone formation. Ferulic acid is also known to inhibit cytochrome P450, the free-radical generator and thus known to decrease lipid peroxidation[42].
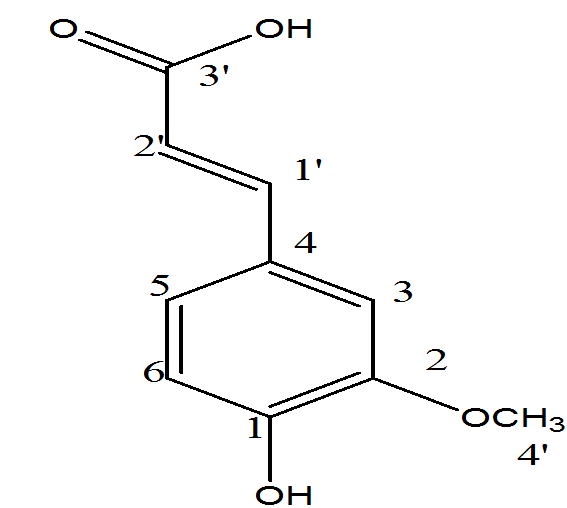
Figure 10a: Structure of ferulic acid
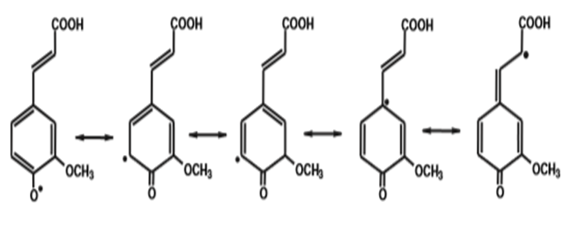
Figure 10b: Resonance stabilization of ferulic acid radical
Conclusion
In conclusion, the Macrotyloma uniflorum seed extract provides protection against hyperlipidemia and cardiac abnormalities associated with the Metabolic Syndrome. The potent antioxidant activity of its phenolic phyto constituents, particularly ferulic acid, may be a major factor contributing for this activity. The future of this edible bean lies in a thorough mechanistic investigation of these effects.
Acknowledgement: We are grateful to Glenmark Research Centre, Mumbai, India for providing animals for this study.
Conflict of Interest: I, the corresponding author on behalf of all the above authors certify that there is no actual or potential conflict of interest in relation to this article.
References
- 1. Grundy, S.M., Brewer, H.B. Jr., Cleeman, J.I., et al. Definition of Metabolic Syndrome: Report of the National Heart, Lung, and Blood Institute/American Heart Association Conference on Scientific Issues Related to Definition. (2004) Arterioscler Thromb Vasc Biol 24(2): e13- e18.
- 2. Alberti, K.G., Zimmet, P., Shaw, J. Metabolic syndrome-a new world-wide definition. A consensus statement from the International Diabetes Federation. (2006) Diabet Med 23(5): 469- 480.
- 3. Saely, C.H., Aczel, S., Marte, T., et al. The metabolic syndrome, insulin resistance, and cardiovascular risk in diabetic and non diabetic patients. (2005) J Clin Endocrinol Metab 90(10): 5698- 5703.
- 4. Rubler, S., Dlugash, J., Yuceoglu, Y.Z., et al. New type of cardiomyopathy associated with diabetic glomerulosclerosis. (1972) Am J Cardiol 30(6): 595– 602.
- 5. Fujioka, K., Greenway, F., Sheard, J., et al. The effects of grapefruit on weight and insulin resistance: relationship to the metabolic syndrome. (2006) J Med Food 9(1): 49– 54.
- 6. Maki, K.C. Dietary factors in the prevention of diabetes mellitus and coronary artery disease associated with the metabolic syndrome. (2004) Am J Cardiol 93(11A): 12C– 17C.
- 7. Kawsar, S.M.A., Huq, E., Nahar, N., et al. Identification and quantification of phenolic acids in Macrotyloma uniflorum by reversed phase HPLC. (2008) Am J Plant Physiol 3(4): 165- 172.
- 8. Siddhuraju, P., Manian, S. The antioxidant activity and free radical-scavenging capacity of dietary phenolic extracts from horse gram (Macrotyloma uniflorum (Lam.) Verdc.) seeds. (2007) Food Chem 105(3): 950- 958.
- 9. Mehra, A., Upadhyaya, M. Macrotyloma uniflorum Lam. A traditional crop of Kumaun Himalaya and ethnobotanical perspectives. (2013) Intl J Agri Food Sci 3(4): 148- 150.
- 10. Kelishadi, R., Mansourian, M., Heidari-Beni, M. Association of fructose consumption and components of metabolic syndrome in human studies: A systematic review and meta-analysis. (2014) Nutrition 30(5): 503– 510.
- 11. Tappy, L., Le, K.A., Tran, C., et al. Fructose and metabolic diseases: new findings, new questions. (2010) Nutrition 26(11-12): 1044- 1049.
- 12. Kumar, D.S., Prashanthi, G., Avasarala, H., et al. Antihypercholesterolemic effect of Macrotyloma uniflorum (Lam.) Verdc (Fabaceae) extract on high-fat diet-induced hypercholesterolemia in Sprague-Dawley rats. (2013) J Diet Suppl 10(2): 116- 128.
- 13. Yen-Hung, Y., Ya-Ting, L., Hung-Sheng, H., et al. Dietary Caffeic Acid, Ferulic Acid and Coumaric Acid Supplements on Cholesterol Metabolism and Antioxidant Activity in Rats. (2009) J Food Drug Anal 17(2): 123- 132.
- 14. De Paiva, L.B., Goldbeck, R., dos Santos, W.D., et al. Ferulic acid and derivatives: molecules with potential application in the pharmaceutical field. (2013) Brazilian Journal of Pharmaceutical Sciences 49(3): 395- 411.
- 15. Medic-Saric, M., Jasprica, I., Smolcic-Bubalo, A., et al. Optimization of Chromatographic Conditions in Thin Layer Chromatography of Flavonoids and Phenolic Acids. (2004) Croatica Chemica Acta 77(1-2): 361- 366.
- 16. Mas, S., Fonrodona, G., Tauler, R., et al. Determination of phenolic acids in strawberry samples by means of fast liquid chromatography and multivariate curve resolution methods. (2007) Talanta 71(4): 1455- 1463.
- 17. Bergman, I., Loxley, R. Two improved and simplified methods for the spectrophotometric determination of hydroxyproline. (1963) Anal Chem 35(12): 1961- 1965.
- 18. Buege, J.A., Aust, S.D. Microsomal Lipid peroxidation. (1978) Methods Enzymol 52: 302- 310.
- 19. Ellman, G.L. Tissue sulfhydryl groups. (1959) Arch Biochem Biophys 82(1): 70- 77.
- 20. Sun, M., Zigman, S. An improved spectrophotometric assay for superoxide dismutase based on epinephrine auto-oxidation. (1978) Anal Biochem 90(1): 81- 89.
- 21. Clairborne, A. Catalase activity In: Greenwald RA, ed. CRS Handbook of Methods in Oxygen Radical Research. Boca Raton, FL: CRS Press (1985) p. 283- 284.
- 22. Rotruck, J.T., Pope, A.L., Ganther, H.E., et al. Selenium: Biochemical role as a component of glutathione peroxidase. (1973) Science 179(4073): 588- 590.
- 23. Mohandas, J., Marshal, J.J., Duggin, G.G., et al. Low activities of glutathione-related enzymes as factors in the genesis of urinary bladder cancer. (1984) Cancer Res 44(11): 5086- 5091.
- 24. Basciano, H., Federico, L., Adeli, K. Fructose, insulin resistance and metabolic dyslipidemia. (2005) Nutri Metab 2(1): 5- 18.
- 25. Park, O.J., Cesar, D., Faix, D., et al. Mechanisms of fructose-induced hypertriglyceridaemia in the rat. Activation of hepatic pyruvate dehydrogenase through inhibition of pyruvate dehydrogenase kinase. (1992) Biochem J 282(Pt 3): 753- 757.
- 26. Kelley, G.L., Allan, G., Azhar, S. High dietary fructose induces a hepatic stress response resulting in cholesterol and lipid dysregulation. (2004) Endocrinol 145(2): 548- 555.
- 27. Rajasekar, P., Anuradha, C.V. Effect of L-carnitine on skeletal muscle lipids and oxidative stress in rats fed high-fructose diet. (2007) Exp Diabetes Res 72741: 1- 8.
- 28. Suzuki, K., Islam, K.N., Kaneto, H., et al. The contribution of fructose and nitric oxide to oxidative stress in hamster islet tumor (HIT) cells through the inactivation of glutathione peroxidase. (2000) Electrophoresis 21(2): 285- 288.
- 29. Urakawa, H., Katsuki, A., Sumida, Y., et al. Oxidative stress is associated with adiposity and insulin resistance in men. (2003) J Clin Endocrinol Metab 88(10): 4673- 4676.
- 30. Ahir, K.B., Patel, B.G., Patel, S.B., et al. Effect of Solanum nigrum fruits in lipid levels and antioxidant defences in rats with fructose induced hyperlipidemia and hyperinsulinemia. (2008) Pharmacologyonline 3: 797- 807.
- 31. Randle, P.J. Regulatory interactions between lipids and carbohydrates: the glucose fatty acid cycle after 35 years. (1998) Diabetes Metab Rev 14(4): 263- 283.
- 32. Tomita, M., Mukae, S., Geshi, E., et al. Mitochondrial respiratory impairment in streptozotocin-induced diabetic rat heart. (1996) Jpn Circ J 60(9): 673 – 682.
- 33. Lopez, B., Gonzalez, A., Varo, N., et al. Biochemical assessment of myocardial fibrosis in hypertensive heart disease. (2001) Hypertension 38(5): 1222– 1226.
- 34. Reiser, K.M. Nonenzymatic glycation of collagen in aging and diabetes. (1991) Proc Soc Exp Biol Med 196(1): 17- 29.
- 35. Sakai, M., Oimomi, M., Kasuga, M. Experimental studies on the role of fructose in the development of diabetic complications. (2002) Kobe J Med Sci 48(5-6): 125- 136.
- 36. Fu, M.X., Requena, J.R., Jenkins, A.J., et al. The advanced glycation end product, Nepsilon- (carboxymethyl) lysine, is a product of both lipid peroxidation and glycoxidation reactions. (1996) J Biol Chem 271(17): 9982- 9986.
- 37. Pan, G.X., Spencer, L., Leary, G.J. Reactivity of ferulic acid and its derivative towards hydrogen peroxide and peracetic acid. (1999) J Agric Food Chem. 47(8): 3325– 3331.
- 38. Srinivasan, M., Sudheer, A.R., Menon, V.P. Ferulic acid: therapeutic potential through its antioxidant property. (2007) J Clin Biochem Nutr 40(2): 92– 100.
- 39. Toda, S., Kumura, M., Ohnishi, M. Effects of phenolic carboxylic acids on superoxide anion and lipid peroxidation induced by superoxide anion. (1991) Planta Med 57(1): 8– 10.
- 40. Adam, A., Crespy, V., Levrat-Vermy, M.A., et al. The bioavailability of ferulic acid is governed primarily by the food matrix rather than its metabolism in intestine and liver in rats. (2002) J Nutr 132(7): 1962– 1968.
- 41. Tada, Y., Tayama, K., Aoki, N. Acute oral toxicity of ferulic acid, natural food additive, in rats. (1999) Ann Rep Tokyo Metr Res Lab PH 50: 311- 313.
- 42. Teel, R.W., Huynh, H. Modulation by phytochemicals of cytochrome P450-linked activity. (1998) Cancer Lett 133(2): 135- 141.


