
Roadside BTEX Profiles in the Atmosphere at a Terai Region of Northern India
Amit Masih*, Anurag S. Lall and J.K.Lal
Affiliation
Environmental Research Lab, Department of Chemistry, St. Andrew's College, Gorakhpur, India
Corresponding Author
Amit Masih, Assistant Professor, Environmental Research Lab, Department of Chemistry, St. Andrew’s College, Gorakhpur, UP, India; E-mail: amitmasih10@yahoo.com
Citation
Masih, A., et al. Roadside BTEX Profiles in the Atmosphere at a Terai Region of Northern India. (2017) J Environ Health Sci 3(2): 1-7.
Copy rights
© 2017 Masih, A. This is an Open access article distributed under the terms of Creative Commons Attribution 4.0 International License.
Keywords
BTEX; Roadside; High traffic congestion; Charcoal tubes; Terai region
Abstract
Transportation has turned into an escalating source that causes severe adverse effects on air quality. Over the last few decades, there has been a dramatic increase in the number of publications on traffic-related volatile organic compounds (VOCs), which indicates that automobiles in urban regions are the dominant source of benzene, toluene, ethylbenzene and xylene, commonly called BTEX. A monitoring program was designed and implemented to characterize roadside levels of BTEX during November, 2014 – February, 2015 at Gorakhpur – a terai belt of north India, on both weekdays and weekends. Samples of the air were collected at two sites namely, Nausad Traffic Junction (NTJ) and Golghar Traffic Junction (GTJ). Besides this, air samples were also collected at different distances (3 m, 10 m, 20 m, 30 m respectively) from the road. BTEX were sampled by SKC activated charcoal tubes and analyzed by GC–FID (Gas Chromatography- Flame Ionization Detector). Total BTEX concentration ranged from 9.8 - 61.3 μg m-3 at roadside sites, Gorakhpur. The total mean BTEX at Golghar traffic junction (GTJ) and Nausad traffic junction (NTJ) were 36.6 μg m-3 and 18.1 μg m-3 respectively. The concentrations of BTEX were plotted against distance from the road. The coefficient of determination (R² values) for benzene, toluene, ethylbenzene and xylene were found to be 0.65, 0.98, 0.98 and 0.92 respectively. The average T/B and X/E ratios of both the sites together were 2.3 and 1.2 respectively. The higher traffic volume and traffic congestion on weekdays lead to remarkably higher BTEX levels than those observed on Sunday at both the sites. Toluene was found to be dominant followed by benzene, xylene and ethylbenzene. Appropriate traffic management and vehicle emission control should be applied to reduce the VOC pollution in the city.
Introduction
Vehicular emissions remain a major contributor to air pollution in cities worldwide. With global vehicle ownership projected to hit two billion by 2020, understanding its impact on air quality and human health is fundamental to future urban planning. Pollutants emitted from vehicles are of concern in populated urban areas because of their effects on human health and also atmospheric visibility (Giang & Onah, 2014). Risks on human health can be posed by the ambient air pollutants such as suspended particulate matters and volatile organic compounds that originate from automobile exhaust, combustion exhaust, industry processes and domestic activities (Wong et al., 2002). Such activities have produced massive emissions of nitrogen oxides (NOx), carbon monoxide (CO), sulfur dioxide (SO2), particulate matter (PM), including black carbon (BC), volatile organic compounds (VOCs) and semi-VOCs (e.g. polycyclic aromatic hydrocarbons) (Wang et al., 2009). Large amount of air pollutants are released from the vehicle fleet, especially fine particulate matter (PM2.5, particles with aerodynamic diameter less than 2.5 mm) and a range of toxic gases including volatile organic compounds (VOCs) because emission control measures are not strongly enforced for old vehicles and inadequate inspection allows these old vehicles to remain in use (Oanh et al., 2013).
Benzene, toluene, ethylbenzene and xylenes (BTEX) collectively form a group of VOCs that are commonly related to the vehicle emission in urban areas worldwide (Monod et al., 2001; Skov et al., 2001). In urban areas, benzene is mainly airborne and generated by vehicular traffic. Atmospheric reactions of BTEX produce secondary pollutants, which in turn causes deterioration of air quality and damages crops and vegetation. (Srivastava, et al., 2005). Therefore, BTEX species are monitored together with SO2, NOx, O3, Pb, CO and PM in many cities in the world (Lan and Binh, 2012; Kumar et al. 2015). The International Agency for Research on Cancer, classified benzene as a carcinogenic compound. Benzene is emitted mainly from petrol-fuelled cars, and thus, it is mostly found in urban areas (Khoder, 2007). Previous studies have reported that out of the total vehicular emissions, alkanes, aldehydes and BTEX are mainly produced by Light Duty Vehicles(LDV), whereas Heavy Duty Vehicles (HDV) dominate emissions of CO, NOx, SO2, and PM10 (Schmid et al., 2001). VOCs are also emitted in the interior of motor vehicles, which is made from a wide variety of synthetic materials (Buters et al., 2007).
In some developed and industrialized countries, there have been various studies on the nature and ambient concentrations of the aromatic hydrocarbons (e.g. Zhao et al., 2004; Buczynska et al., 2009). These studies reveal that traffic is the most important source of high pollution levels in towns, and thus the population living in the ambient environment is susceptible to high exposure of the pollutants. In Denmark, the annual average concentration of benzene in outdoor urban air was found to be 2.9 μg/m³ (Skov, et al., 2001). Levels of benzene (3.4 μg/m³), toluene (23.6 μg/m³), ethylbenzene (3.3 μg/m³), m & p-xylene (5.1 μg/m³) and o-xylene (2.7 μg/m³) were measured in Spain (Fernandez-Villarrenaga et al., 2004). In the Metropolitan Region of Rio de Janeiro (MRRJ), 77% of the emissions of total pollutants and 98% of total carbon monoxide are due to vehicles (Martins et al., 2010). Road traffic in Paris can be considered as the dominant source of these pollutants in the ambient air (Vardoulakis et al., 2002). They concluded that traffic emissions were the main source of BTEX in the studied area. The benzene emission factors have uncertainty depending on the traveling condition of vehicles, composition of fuels and the performance of exhaust gas processing equipment. Therefore, it is thought that the risk of cancer through benzene exposure becomes high for the residents who live near a main road with heavy traffics (OUKA, 2004). Ambient VOCs contribute to 35 – 55% of the outdoor air cancer risk in the US (Liu et al., 2009). Other studies have found a relationship between traffic density and incidence of leukemia in children (Rommelt et al., 1999). According to World Health Organization, the concentrations of airborne benzene associated with an excess lifetime risk of developing leukemia of 10-4, 10-5 and 10-6 are 17, 1.7 and 0.17 μg/m³ respectively (Lan and Binh, 2012). Many studies reveal that BTEXs are known to be toxic and genotoxic and they also actively participate in the photochemical reactions. Cytotoxic studies have demonstrated that the nano size particles play an important, dangerous and deleterious role on a per mass basis and even very low mass concentrations of nanoparticles are influential (Hsieh et al., 2011).
High levels of VOCs have also been observed in Asian Countries (Kumar et al. 2016). BTEX pollution is a problem in megacities of developing countries. The reason for the enhanced concentration was solely attributed to the increase of the vehicular population from 3.5 million in 2001 - 2002 to 5.1 millions in 2007 (Khillare, 2008). In Japan, the amount of VOCs emitted in 2002 as estimated from PRTR data (Pollutant Release and Transfer Registers) was found to be 19,000 tonnes/year, and it is presumed that 85% of the total benzene was discharged from automobiles or two-wheeled vehicles (OUKA, 2004). Benzene concentration was 67 μg/m³ in Cairo, Egypt (Khoder, 2007); 14.7 μg/m³ in Mumbai, India (Gauri, 2011); 11.8 μg/m³ in Manila, Philippines (Balanay, 2008), 51.5 μg/m3 in Guangzhou, China (Wang, 2002) and 27 μg/m³ in Algiers, Algeria (Lan and Binh, 2012). The information on the roadside air pollution in a city is important for exposure assessment studies relevant to urban commuters and to urban dwellers in general (Giang & Onah, 2014). It was found that only limited number of studies have been conducted on the roadside BTEX concentration, in this particular terai part of India. BTEX are important air pollutants not only because they play a key role in atmospheric chemistry but also because some have toxic health effects. Thus BTEX monitoring should be an essential part of an air quality management program. So, this study was conducted in order to characterize the roadside air pollution with emphasis on BTEX at Gorakhpur.
Experimental Procedure
Sampling site description
Gorakhpur (26°45′32″N 83°22′11″E) is located in the terai region of eastern Uttar Pradesh in northern India, near the border of Nepal, in the foothills of the Shiwalik Himalayas. Situated on the basin of rivers Rapti and Rohini, the geographical shape of the Gorakhpur city is like a bowl, surrounded by the river and other small streams from three sides. River Rapti is interconnected through many other small rivers. The present district of Gorakhpur, 265 kms east of capital Lucknow, on National Highway -28, covers geographical area of 3483.8 Sq. km having total population of about 4,440,895. In winter season, the temperature ranges from 4.5°C to 28.5°C with an average of 18°C and humidity is 89% (Masih et al., 2016). High water mark of the city, “Golghar”, is in almost geographical center of the city, which includes several major shops, hotels, banks, and restaurants and busy roads. Gorakhpur has many small towns located within the city as residential areas. In outskirts of the city, farming is very much prevalent. Gorakhpur city has a good rainfall every year (Masih et al., 2017). Table 1 describes the meteorological conditions during the sampling period at Gorakhpur. (Table 1)
Table 1: Meteorological conditions measured during the study period.
| Meteorological parameter | Mean | S.D. | Range |
|---|---|---|---|
| Winter | |||
| Wind speed (m s-1) | 1.6 | 0.18 | 0.1 - 10.1 |
| Air temperature (°C) | 18.6 | 1.4 | 3.5 - 29.5 |
| Relative humidity (%) | 71.3 | 7.1 | 26.4 - 83.1 |
| Summer | |||
| Wind speed (m s-1) | 2.2 | 0.33 | 0.1 - 12.2 |
| Air temperature (°C) | 35.5 | 3.3 | 20.5 - 48.5 |
| Relative humidity (%) | 81.6 | 7.4 | 27.2 - 89.6 |
| Monsoon | |||
| Wind speed (ms-1) | 1.9 | 0.21 | 0.1 - 14.1 |
| Air temperature (°C) | 30.8 | 2.1 | 18.2 - 43.8 |
| Relative humidity (%) | 89.3 | 7.8 | 31.2 - 97.4 |
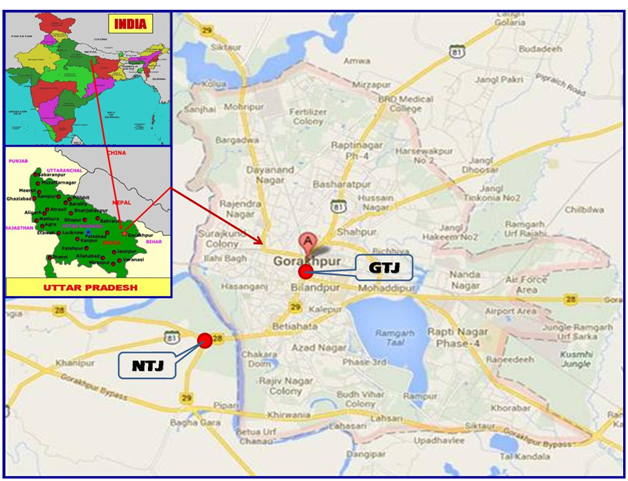
Figure 1: Map of Gorakhpur showing GTJ and NTJ roadside sites.
Two locations, namely Nausad Traffic Junction (NTJ) and Golghar Traffic Junction (GTJ), on which the traffic density is usually high, were selected as roadside monitoring sites. Nausad Traffic Junction (NTJ) is situated at National Highway (NH-28) from Lucknow (Uttar Pradesh) to Barauni (Bihar), while Golghar Traffic Junction (GTJ) acts as a connecting road within the Gorakhpur city. Along the roadside, there are many houses which have been built recently. Usually on these roads, we have high traffic throughout the day and the night with both heavy and light motor vehicles. Figure 1 shows the map of Gorakhpur indicating the two sites.
BTEX sampling and analysis
The monitoring was done at these two sampling sites, which were selected adjacent to roads (3m) during November 2014 to February 2015. Each site was monitored 20 - 24 hrs for ambient air quality thrice a week in a scheduled manner. The sampling was done on alternate working days (i.e. Mondays, Wednesdays and Fridays) and also on weekends. 32 samples were collected from each site and a total of 64 samples were collected from both the sites. In order to study the lateral dispersion of BTEX, air samples were also collected at different distances (3 m, 10 m, 20 m and 30 m respectively) from the road. BTEX were sampled and analyzed using a methodology based on National Institute for Occupational Safety and Health (NIOSH) method 1501 (USEPA, 2012; NIOSH, 1994). BTEX were sampled by drawing air through activated coconut shell charcoal tubes (CSC, 8 mm x 110 mm, 600 mg) containing two sections (main section 400 mg, second section 200 mg) separated by a 2 mm urethane foam (SKC Inc.), using a low-flow SKC Model 220 sampling pump (SKC, Inc., 84, PA, USA) at the flow rate of 250 ml/min for 20 - 24 hrs. The air suction rate was verified every week using calibrated rotameters with an accuracy of ± 1%. Samples were refrigerated at -5oC until analysis. The second section of tube was analyzed in order to detect breakthrough. Charcoal beds in the sorbent tubes were transferred to 2 ml vials and extracted by adding 1.0 ml of carbon disulphide (CS2) with occasional agitation for 30 min. Sampled air was then analyzed with an HP 6890 gas chromatography/mass spectrometer and gas chromatography/ flame ionization detector. The cold trap operating temperature was -30°C and was raised to 250°C for 3 min. The carrier gas was nitrogen and an Agilent 19091J-413/E column (30 m x 0.32 mm i.d. x 0.25 mm) was used. The column temperature was held at 40°C for 5 min, after which it was raised to 100°C for 5 min and then increased to 200°C, at which it was held for 2 min. For each compound, two ions (one target and one qualifier) were monitored. Compounds were identified based on their relative retention times and ion ratios. Identified compounds were quantified using internal calibration procedure, with five levels of calibration as follows: 0.1; 1; 5; 25; 100 μg/ml in CS2 in all solutions. All calibration solutions were purchased from Supelco. The reproducibility of the results was checked by analyzing duplicated samples and the difference was always below 10%. Blank runs were performed before each sample analyses. The uncertainties of the results were calculated, using the data of the calibration curves, as: benzene 18%, toluene 10%, ethylbenzene 21%, m, p-xylene 8% and o-xylene 12%.
Results and Discussion
Roadside BTEX concentrations
The statistical data set for total BTEX at roadside sites of Gorakhpur, India is given in Table 1. Total BTEX concentration ranged from 9.8 - 61.3 μg m-3. The total mean concentration of BTEX for the entire samples collected was found to be 27.4 μg m-3 and the median was 22.2 μg m-3. Total mean BTEX at Goalghar traffic junction (GTJ) and Nausad traffic junction (NTJ) were 36.6 μg m-3 and 18.1 μg m-3 respectively. Figure 2, depicts individual profiles of BTEX at GTJ and NTJ sites at Gorakhpur. The concentrations of benzene, Toluene, ethylbenzene and xylene at GTJ were 31.20 μg m-3, 82.80 μg m-3, 14.30 μg m-3 and 18.20 μg m-3 respectively, whereas at NTJ the levels of BTEX were found to be 21.60 μg m-3, 41.60 μg m-3, 4.41 μg m-3 and 4.85 μg m-3 respectively. The concentration trends of BTEX at both the sites (GTJ and NTJ), found in present study suggests that toluene had the maximum concentration followed by benzene, xylene and ethylbenzene. The percentage individual contribution of BTEX at roadside sites is illustrated in Figure 3.
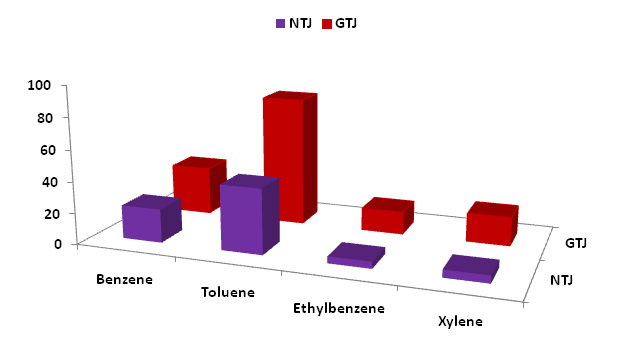
Figure 2: Individual BTEX concentrations at GTJ and NTJ (μg m-3).
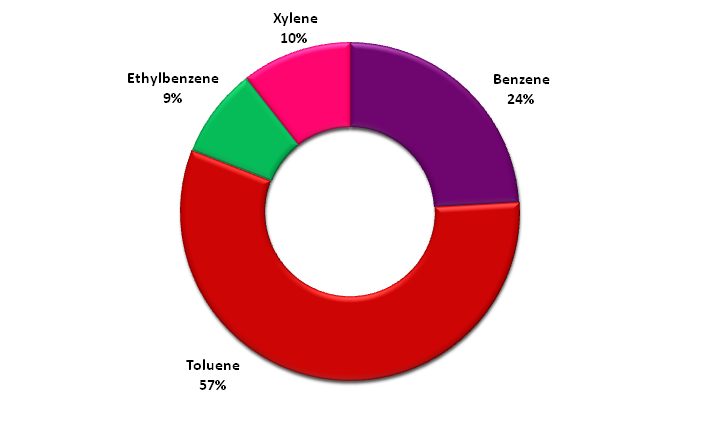
Figure 3: Individual contribution (%) of BTEX at roadside sites, Gorakhpur.
Variation with distances from the road
As the concentrations of BTEX were higher at GTJ site, therefore, the air was also sampled & measured at different distances from roadside i.e. 10 m, 20 m, and 30 m from roadside in addition to 3 m sampling in order to investigate the horizontal effect of the VOCs. The total mean concentrations of BTEX were 36.6, 31.2, 22.6 and 16.5 μg m-3 at 3 m, 10 m, 20 m, and 30 m respectively. The concentrations of individual BTEX at various distances from the road are presented in the figure 4, which shows that the highest concentrations are at 3m from the road, and it decreases with increasing distance from the road. It also shows that, except for benzene, the concentrations of TEX decreased considerably with the distance. Other sources like incineration, motorcycles/car repairing works, cigarette smoking or evaporation from the cars may contribute to the higher benzene levels (Truc et al., 2007). Toluene was reduced by 55%, 66% and 74% at 10 m, 20 m, and 30 m respectively as compared to the level at 3 m. Similarly, ethylbenzene decreased with the distances by 53%, 62% and 67%, while xylene decreased at almost similar rates around 51%, 64% and 68%. The decreasing trend of BTEX concentrations probably reflects the decrease in the atmospheric concentration further from the road due to dispersion. Figure 5 shows the concentrations of individual BTEX plotted against distance from the road, along with the coefficient of determination (R² values) obtained for each plot. The R² values obtained for benzene, toluene, ethylbenzene and xylene were 0.65, 0.98, 0.98 and 0.92 respectively. R² value is a statistical measure of the closeness of data to the fitted regression line. Comparatively low R² value obtained for benzene indicates that benzene does not follow the expected decrease in concentration with increasing distance. This also confirms that compared to toluene, ethylbenzene and xylene, the concentration of benzene is not decreasing appreciably with increasing distance due to its slow rate of degradation which is further explained by using toluene/ benzene ratios.
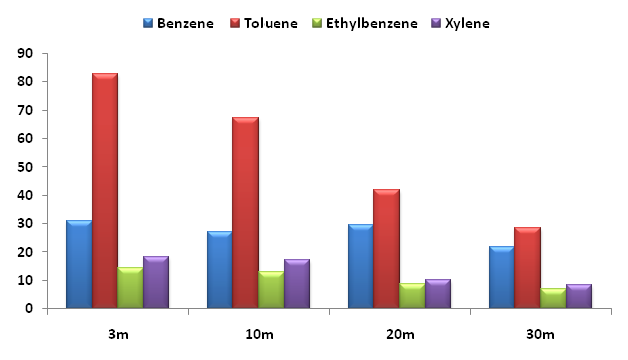
Figure 4:
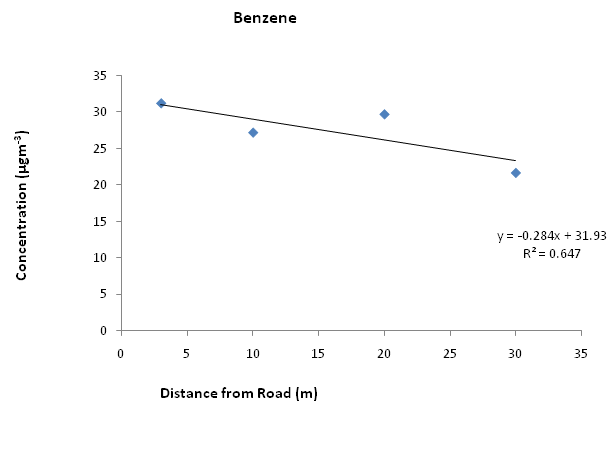
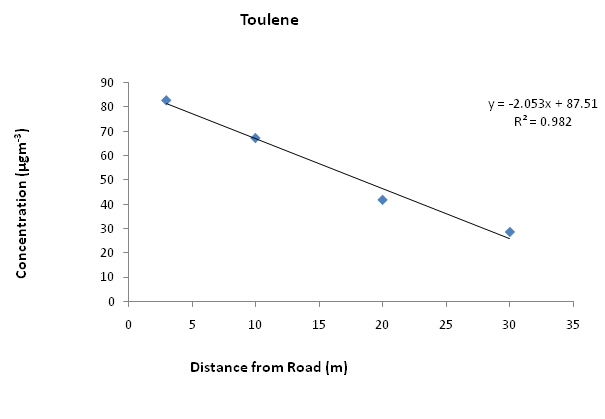
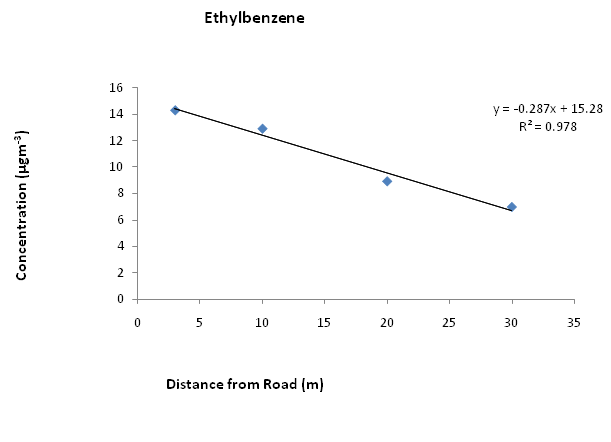
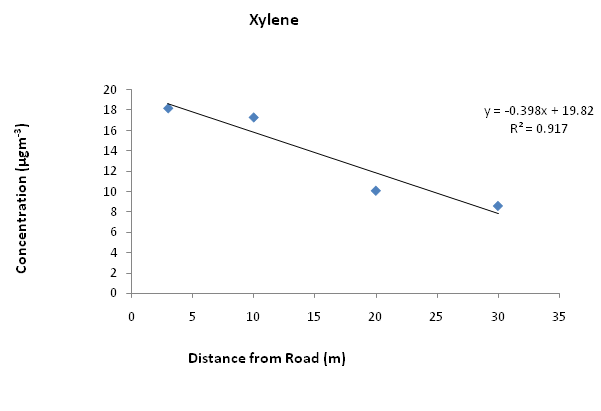
Figure 5: R² values of individual BTEX plot against distance from the road.
Ratios of toluene/benzene (T/B) & xylene/ethylbenzene (X/E)
The atmospheric degradation of BTEX occurs predominantly with OH radicals. The rate constant for such degradation reactions is highest for xylene followed by ethylbenzene, toluene and benzene. It is known that even toluene degrades five times faster than benzene. Thus the ratio of toluene to benzene (T/B) can be used to estimate the proximity of vehicular emission source (Amodio et al., 2013). Higher T/B ratios indicate emissions from a fresh vehicular source while lower T/B ratios suggest probable photochemical degradation of benzene and toluene originated from a distant source. Usually, T/B ratios in the range 1.5 - 3.0 indicate predominance of traffic related emissions (Miller et al., 2011; Amodio et al., 2013; de Gennaro et al., 2015). Therefore, T/B ratios at both the sites were also calculated and examined in this study. Toulene/benzene (T/B) ratios were found to be 2.7 and 1.9 at GTJ and NTJ sites respectively. In a similar way, the ratio of xylene to ethylbenzene (X/E) is also used to estimate the age of the air mass. The xylene/ethylbenzene (X/E) ratios were also calculated for each sampling site and were found to be 1.3 and 1.1 for GTJ and NTJ sites respectively. Moreover, average T/B and X/E ratios of both the sites together were 2.3 and 1.2 respectively. For different urban samples, there is a broad range of ratios reported ranging from 1.3 for Tokyo to above 4.8 in Athens, but the most usual values are between 2.0 and 3.0 (Monod et al., 2001; Truc et al., 2007). The result shows that the ratios found in our study for the GTJ and NTJ sites are in the range reported for the roadsides.
Weekdays/weekends (WD/WE) levels of BTEX at roadside
Table 2 depicts that higher levels of BTEX were observed on weekdays having concentrations for benzene (26.4 ± 5.2) μg m-3, toluene (62.2 ± 8.1) μg m-3, ethylbenzene (9.4 ± 3.1) μg m-3 and xylene (11.5 ± 3.4) μg m-3, as compared to the respective levels on weekends/holidays for benzene (23.6 ± 5.5) μg m-3, toluene (50.2 ± 7.4) μg m-3, ethylbenzene (6.5 ± 2.7) μg m-3 and xylene (7.6 ± 2.6) μg m-3 due to higher traffic volume and traffic congestion on weekdays. Figure 6 clearly illustrates the pattern of BTEX during weekdays and weekends. Table 2, 3. Figure 6
Table 2: Mean, Median and Range of BTEX (μg m-3) at Roadside, Gorakhpur.
| VOCs | Mean | Median | Range |
|---|---|---|---|
| Benzene | 26.4 ± 5.2 | 19.8 ± 4.4 | 10.9 ± 2.8 - 58.7 ± 7.3 |
| Toluene | 62.2 ± 8.1 | 52.6 ± 6.9 | 18.8 ± 4.1 - 133.4 ± 12.6 |
| Ethylbenzene | 9.4 ± 3.1 | 8.3 ± 2.7 | 4.2 ± 1.6 - 21.2 ± 4.3 |
| Xylene | 11.5 ± 3.4 | 8.1 ± 2.6 | 5.3 ±1.8 - 32.1 ± 5.9 |
| Total Mean | 27.4 ± 19.8 | 22.2 ± 16.6 | 9.8 ± 10.3 - 61.3 ± 30.1 |
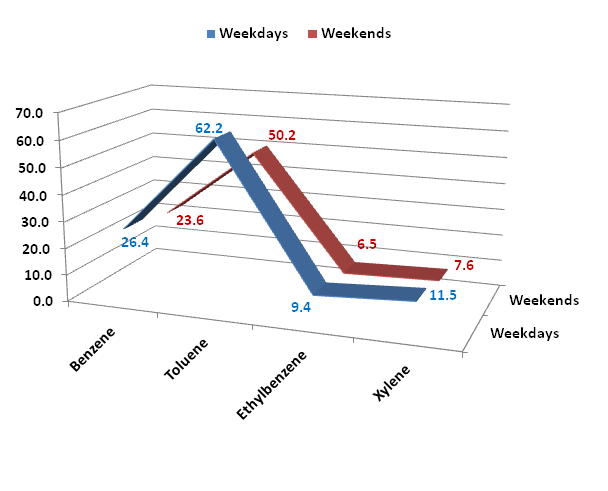
Figure 6: Weekday/weedend concentrations of BTEX at roadside (μg m-3).
Table 3: Weekdays/Weekend levels of BTEX (μg m-3) at Roadside, Gorakhpur.
| VOCs | Weekdays | Weekends |
|---|---|---|
| Benzene | 26.4 ± 5.2 | 23.6 ± 5.5 |
| Toluene | 62.2 ± 8.1 | 50.2 ± 7.4 |
| Ethylbenzene | 9.4 ± 3.1 | 6.5 ± 2.7 |
| Xylene | 11.5 ± 3.4 | 7.6 ± 2.6 |
Table 4: Roadside BTEX profiles compiled from literature data.
| Study (Reference) | Location (Country) | VOC Concentrations (μg m-3) | |||
|---|---|---|---|---|---|
| Benzene | Toluene | Ethylbenzene | Xylene | ||
| Rommelt et al, 1999 | Germany | 15.0 | 42.1 | -- | 37.3 |
| Schimd et al, 2001 | Austria | 4.5 | 9.4 | 2.0 | 6.7 |
| Wang et al, 2002 | China | 34.9 | 85.9 | 24.1 | 95.6 |
| Pilidis et al, 2005 | Greece | 49.8 | 105.4 | -- | 57.8 |
| Kerbachi et al, 2006 | Algeria | 27.0 | 39.0 | -- | -- |
| Martins et al, 2007 | Brazil | 1.1 | 4.8 | 3.6 | 10.4 |
| Truc and Onah, 2007 | Thailand | 73.0 | 62.0 | 16.0 | 32.0 |
| This Study, 2015 | India | 26.4 | 62.2 | 9.4 | 11.5 |
Comparison of the present work with other roadside studies worldwide
The BTEX levels obtained in this study were compared with other roadside studies reported from different countries of the world (Table 4). It indicates that the concentrations of Benzene and Toluene were higher than those reported in Germany (15.0, 42.1 μg m-3), Austria (4.5, 9.4 μg m-3) and Brazil (1.1, 4.8 μg m-3); whereas lower than those reported in China (34.9, 85.9 μg m-3), Greece (49.8, 105.4 μg m-3), Algeria (27.0, 39.0 μg m-3) and Thailand (73.0, 62.0 μg m-3). It also indicates that, the levels of ethylbenzene and xylene were lower than those reported in China (24.1, 95.6 μg m-3) and Thailand (16.0, 32.0 μg m-3).
Conclusion
Numerous auto vehicles are the major cause for the high roadside BTEX levels along the busy roads at Gorakhpur. The monitoring of BTEX was performed at two Locations, NTJ and GTJ with the help of SKC low volume pumps and charcoal tubes. The samples were extracted using CS2 and analysed by GC. The total mean concentration of BTEX for the entire samples collected was found to be 27.4 μg m-3 and the median was 22.2 μg m-3. The total mean concentrations of BTEX were 36.6, 31.2, 22.6 and 16.5 μg m-3 at 3 m, 10 m, 20 m, and 30 m respectively. Levels of toluene, ethylbenzene and xylene (TEX) reduced significantly with the distance from the road but benzene remained high even at 20 m away from traffic lanes implying a high exposure for people living along the main roads. T/B ratios were found to be 2.7 and 1.9 whereas X/E ratios were 1.3 and 1.1 at GTJ and NTJ sites respectively. Higher levels of BTEX were observed on weekdays as compared to the respective levels on weekends/holidays. As benzene and its compounds are supposed to be carcinogenic and mutagenic, so it is hoped that the results from this study (though preliminary) will provide a baseline reference for a national database.
Acknowledge:
Financial support from Department of Science and Technology, Government of India, in Project No. SR/FTP/ES-77/2013 is duly acknowledged. Authors gratefully acknowledge Dr. S. D. Sharma, Head, Chemistry Department, St Andrew’s College, Gorakhpur, UP, India, for providing necessary facilities. We are also thankful to Mr. Jay Patel, ERT, USEPA for providing technical support during the analysis of samples.
References
- 1. American Society of Safety Engineers (ASSE). Use of a Portable Photo-Ionization Detector (PID) in Determining Occupational Exposure to Volatile Organic Compounds (VOCs) in a Print Shop. Proceeding of the ASSE Professional Development Conference and Exposition, June 25 – 28. (2000). Orlando, Florida, USA.
- 2. Amodio, M., de Gennaro, G., Marzocca, A., et al. Assessment of impacts produced by anthropogenic sources in a little city near an important industrial area (Modugno, Southern Italy). (2013) The Sci World J 2013: 1-10.
Pubmed || Crossref || Others - 3. Balanay, J.A.G, Lungu, C.T. Exposure of Jeepney drivers in Manila, Philippines, to selected volatile organic compounds (VOCs). (2008) Ind Health 47(1): 33-42.
Pubmed || Crossref || Others - 4. Buczynska, A.J., Krata, A., Stranger, A., et al. Atmospheric BTEX-concentrations in an area with intensive street traffic. (2009) Atmospheric Environ 43(2): 311–318.
Pubmed || Crossref || Others - 5. Buters, J.T., Schober, W., Gutermuth, J., et al. Toxicity of parked motor vehicle indoor air. (2007) Environ Sci Technol 41(7): 2622–2629.
Pubmed || Crossref || Others - 6. de Gennaro, G., Dambruoso, P. R., Di Gilio, L., et al. Indoor and outdoor volatile organic compounds monitoring in a multi-storey car park. (2015) Environ Eng Manag J 14(7): 1563-1570.
Pubmed || Crossref || Others - 7. Fernandez-Villarrenaga, V., Lopez-Mahia, P., Muniategui-Lorenzo, S., et al. C1 to C9 volatile organic compound measurements in urban air. (2004) Sci Total Environ 334-335: 167–176.
Pubmed || Crossref || Others - 8. Gauri, G.P., Sanjay, K.S., Vijay, D.P. Distribution and source apportionment of atmospheric non-methane hydrocarbons in Mumbai, India. (2011) Atmospheric Poll Res 2(2): 231-236
Pubmed || Crossref || Others - 9. Giang, N.T., Onah, N.T.K. Roadside levels and traffic emission rates of PM2.5 and BTEX in Ho Chi Minh City, Vietnam. (2014) Atmospheric Environ 94: 806-816.
Pubmed || Crossref || Others - 10. Hsieh, L.T., Wang, Y.F., Yang, H.H., et al. Measurements and Correlations of MTBE and BETX in Traffic Tunnels. (2011) Aerosol and Air Quality Res 11: 763–775.
Pubmed || Crossref || Others - 11. Kerbachi, R., Boughedaoui, M., Bounoua, L., et al. Ambient air pollution by aromatic hydrocarbons in Algiers. (2006) Atmospheric Environ 40(21): 3995-4003.
Pubmed || Crossref || Others - 12. Khillare, P.S., Hoque, R.R., Shridhar, V., et al. Temporal variability of benzene concentration in the ambient air of Delhi: A comparative assessment of pre-and post-CNG periods. (2008) J Hazard Mater 154(1-3): 1013-1018.
Pubmed || Crossref || Others - 13. Khoder, M.I. Ambient levels of volatile organic compounds in the atmosphere of greater Cairo. (2007) Atmospheric Environ 41(3): 554-566.
Pubmed || Crossref || Others - 14. Kumar, A., Singh, D., Singh, B.P., et al. Spatial and temporal variability of VOCs and its source estimation during rush/non-rush hours in ambient air of Delhi, India. (2016) Air Quality, Atmosphere & Health, 9 (5): 483-493.
Pubmed || Crossref || Others - 15. Kumar, K., Jain, V.K., Bauri, N., et al. Evaluation of seasonal variations in abundance of BTXE hydrocarbons and their ozone forming potential in ambient urban atmosphere of Dehradun, India. (2016) Air Quality, Atmosphere & Health 9(1): 95-106.
Pubmed || Crossref || Others - 16. Lan, T.T.N., Binh, N.T.T. Daily roadside BTEX concentrations in East Asia measured by the Lanwatsu, Radiello and Ultra I SKS passive samplers. (2012) Sci Total Environ 441: 248–257.
Pubmed || Crossref || Others - 17. Lee, S.C., Chiu, M.Y., Ho, K.F., et al. Volatile Organic Compounds (VOCs) in Urban Atmosphere of Hong Kong. (2002) Chemosphere 48(3): 375–382.
Pubmed || Crossref || Others - 18. Liu, J., Mu, Y., Zhang, Y., et al. Atmospheric levels of BTEX compounds during the 2008 Olympic Games in the urban area of Beijing. (2009) Sci Total Environ 408(1): 109–116.
Pubmed || Crossref || Others - 19. Martins, E.M., Arbilla, G., Bauerfeldt, G.F., et al. Atmospheric levels of aldehydes and BTEX and their relationship with vehicular fleet changes in Rio de Janeiro urban area. (2007) Chemosphere 67(10): 2096-2103.
Pubmed || Crossref || Others - 20. Martins, E.M., Arbilla, G., Gatti, L.V. Volatile Organic Compounds in a Residential and Commercial Urban Area with a Diesel, Compressed Natural Gas and Oxygenated Gasoline Vehicular Fleet. (2010) Bull Environ Contam Toxicol 84(2): 175–179.
Pubmed || Crossref || Others - 21. Masih, A., Lall, A.S., Taneja, A., et al. Inhalation exposure and related health risks of BTEX in ambient air at different microenvironments of a terai zone in north India. (2016) Atmospheric Environ: 147: 55-66.
Pubmed || Crossref || Others - 22. Masih, A., Lall, A.S., Taneja, A., et al. Exposure profiles, seasonal variation and health risk assessment of BTEX in indoor air of homes at different microenvironments of a terai province of northern India. (2017) Chemosphere 176: 8-17.
Pubmed || Crossref || Others - 23. Miller, L., Xu, X., Wheeler, A., et al. Spatial variability and application of ratios between BTEX in two Canadian cities. (2011) Scientific World Journal 11: 2536-2549.
Pubmed || Crossref || Others - 24. Monod, A., Sive, B.C., Avino, P., et al. Monoaromatic compounds in ambient air of various cities: a focus on correlations between the xylenes and ethylbenzene. (2001) Atmospheric Environ 35(1): 135–149.
Pubmed || Crossref || Others - 25. NIOSH. Pocket guide to chemical hazards NIOSH publications. (1994) Cincinnati, OH.
- 26. NIOSH. Hydrocarbons, aromatic: method 1501. NIOSH Manual of Analytical Methods (2003), Cincinnati, OH.
- 27. Oanh, N.T.K., Kongpran J., Hang N.T., et al. Characterization of gaseous pollutants and PM2.5 at fixed roadsides and along vehicle traveling routes in Bangkok Metropolitan Region. (2013) Atmospheric Environ 77: 674-685.
Pubmed || Crossref || Others - 28. OUKA. A report on estimation of cancer risk by benzene emitted from vehicles prepared by the Osaka University Knowledge Archive, Department of Environmental Engineering, Osaka University. (2004) Osaka, Japan.
- 29. Pilidis, G. A., Karakitsios, S. P., Kassomenos, P.A. BTX measurements in a medium-sized European city. (2005) Atmospheric Environ 39(33): 6051-6065.
Pubmed || Crossref || Others - 30. Rommelt, H., Pfaller, A., Fruhmann, G., et al. Benzene exposures caused by traffic in Munich public transportation systems between 1993 and 1997. (1999) Sci Total Environ 241:197-203.
Pubmed || Crossref || Others - 31. Schmid, H., Pucher, E., Ellinger, R., et al. Decadal reductions of traffic emissions on a transit route in Austria-results of the Tauerntunnel experiment 1997. (2001) Atmospheric Environ 35(21): 3585-3593.
Pubmed || Crossref || Others - 32. Skov, H., Hansen, A.B., Lorenzen, G., et al. Benzene exposure and the effect of traffic pollution in Copenhagen, Denmark. (2001) Atmospheric Environ 35: 2463–2471.
Pubmed || Crossref || Others - 33. Srivastava, A., Joseph, A.E, More, A., et al. Emissions of VOCs at urban petrol retail distribution centres in India (Delhi and Mumbai). (2005) Environ Monit Assess 109(1-3): 227–242.
Pubmed || Crossref || Others - 34. Truc Vo Thi Quynh, Oanh Kim, Thi Nguyen. Roadside BTEX and other gaseous air pollutants in relation to emission sources. (2007) Atmospheric Environ 41: 7685–7697.
Pubmed || Crossref || Others - 35. USEPA. Benzene. United States Environmental Protection Agency. (2012), New Jersey, US.
Pubmed || Crossref || Others - 36. Vardoulakis, S., Gonzales-Flesca, N., Fisher, B.E.A. Assessment of traffic related air pollution in two street canyons in Paris: implications for exposure studies. (2002) Atmospheric Environ 36: 1025–1039.
Pubmed || Crossref || Others - 37. Wang, M., Zhu, T., Zheng, J., et al. Use of a mobile laboratory to evaluate changes in on-road air pollutants during the Beijing 2008 Summer Olympics. (2009) Atmospheric Chemistry and Physics, 9: 8247–8263.
Pubmed || Crossref || Others - 38. Wong, Y.C. Sin, D.W. Yeung, L.L. Assessment of the Air Quality in Indoor Car Parks. (2002) Indoor and Built Environ11: 134-145.
Pubmed || Crossref || Others - 39. Zhao, L., Wang, X., He, Q., et al. Exposure to hazardous volatile organic compounds, PM10 and CO while walking along streets in urban Guangzhou, China. (2004) Atmospheric Environ 38(36): 6177–6184.
Pubmed || Crossref || Others


