
Sorption of PAHs, PCBs, Phenols and BTEX Hydrocarbon by Groundwater Solid Media and Destruction in ClO2/UV Solution Systems
Roger Saint-Fort1*, Darcy Bye2
Affiliation
- 1Department of Environmental Science, Mount Royal University, Calgary, AB, Canada, T3E 6K6
- 2Trans Canada Corporation, Calgary, AB, Canada, T2P 5H1
Corresponding Author
Roger Saint-Fort, Department of Environmental Science, Faculty of Science & Technology, Mount Royal University, 4825 Mount Royal Gate SW, Calgary, AB T3E6K6, Canada; Tel: (403) 440-6683; E-mail: rsaintfort@mtroyal.ca
Citation
Roger, S.F, et al. Sorption of PAHs, PCBs, Phenols and BTEX Hydrocarbon by Ground Water Solid Media and Destruction in ClO2/ UV Solution Systems. (2015) J Environ Health Sci 1(3): 1-9.
Copy rights
© 2015 Roger, S.F. This is an Open access article distributed under the terms of Creative Commons Attribution 4.0 International License.
Keywords
DNAPL; Sorption; Chlorine dioxide; Isotherms; Hydrophobic compounds; UV; Transport; Destruction mechanism
Abstract
Concern over the behavior and remediation of dissolved hydrophobic organic contaminants in groundwater at oil and gas facilities has led to this research investigation. In this study, sorption of PAHs, PCBs, Phenols, benzene, ethylbenzene, toluene and xylenes (BTEX) hydrocarbon from groundwater onto a subsoil core sample was examined as well as their destruction in ClO2/UV solution systems whereby methanol was the carrier solvent. All sorbate-sorbent systems yielded the S-type isotherms indicating co-operative interactions among sorbed organic species. Sorption of the sorbates could be best represented mathematically by the Freundlich equation with 1/n values ranging from 0.4338 to 2.226. Empirical Kf values ranged from 0.89 to 3.049. It is postulated that sorption of sorbates occurs through a combination of hydrogen bonding, dipole-dipole and hydrophobic interactions. Off site travel time for the sorbates ranged from 145 to 80,817 years. Destruction of solutes in UV/ClO2 solution systems is believed to occur through UV quantum vibration enhancement in molecules and free radical processes. Under the most efficient treatment system, 76 to 98% of the chemicals of concern were destroyed. No dioxins or furans were formed as by-products in any of the treatment systems investigated.This highly effective ClO2/UV destructive method has the potential to be applied as a new risk management approach for remediating recalcitrant organic contaminants in impacted groundwater.
Introduction
The groundwater environment at many petroleum industry facilities in Alberta, gasworks and around the world has been impacted by the management of hydrophobic organic contaminants. It has been recognized at such sites, the contaminated groundwater will consist of two contamination zones: a non-aqueous phase zone (NAPZ), and a dissolved contamination zone (DCZ). The zone of dissolved contamination is formed by moving groundwater that comes into contact with the NAPZ which is predominantly originated from anthropogenic sources. The composition of a NAP matrix will contain benzene, ethylbenzene, toluene, xylenes (commonly referred to as BTEX ), polycyclic aromatic hydrocarbons (PAHs), polychlorinated biphenyls (PCBs), phenols, alcohols, aldehydes, ketones, gasoline,heavy metals, polymers, acids, bases, and other type of inorganic chemicals commonly detected at oil and gas facilities[1].
Sorption is one of the key processes which determine the mobility and bioavailability of hydrophobic organic contaminants[2-4]. At many sites, DNAP contamination source will consist of intermixing compounds having intrinsically different physicochemical and toxicity properties. As such, co-solvation may affect their advective transport by groundwater.
Some dense non-aqueous organic compounds are sorbed little; they can give rise to substantial aqueous phase plumes. Others are relatively immobile in groundwater and, therefore highly retarded relative to groundwater flow. Several studies have been reported on the sorption of hydrophobic organic compounds in solutions[2,4]. In most of these studies, sorption was limited to a single type of NAP constituent. While those studies are
DNAPL organic constituents are hazardous compounds which have been shown to be persistent and, even at very low concentrations, are highly toxic, mutagenic, and / or carcinogenic. As ubiquitous contaminants at oil and gas facilities, their increased occurrence in the groundwater is of significant environmental concern to the public and regulators because they can pose an unacceptable risk to human health, or the environment. An additional issue is the potential migration of the soluble plume off site, yielding significant environmental and financial liabilities as well as public pressure on the site proponent.
Various risk management strategies aimed at reducing the concentration level of the NAP dissolved-phase constituents in contaminated groundwater and other matrices have been examined. These studies have included biodegradation using microorganisms[5-7]), chemical and physico-chemical degradation using TiO2[8], O3-UV combined system[9], ultrasonication[10], UV radiation[11], hydro dechlorination by palladium on activated carbon system (Pd-C)[12], and microwave radiation[13]. In light of these studies, many questions remain concerning the ability to achieve cost-effective destruction of dissolved NAP compounds at contaminated sites.
The toxicity of DNAPL constituents together with their respective ability to bio-accumulate and persist in the environment makes it imperative that their aqueous partitioning behavior be understood and cost-effective risk management be explored. Thus, the main purposes of this study are to quantify sorption behavior of representative NAP chemical constituents in intermixing solution systems on an aquifer media. The second purpose is to ascertain destruction efficiency of selected chemicals by ClO2/UV systems with methanol as the carrier solvent.The findings can be used in designing cost effective and environmental sensitive risk management options at similarly contaminated sites.
Materials and Methods
Sorbent collection and characterization
Representative groundwater and subsoil cores were collected from a compressor station located east of Calgary. A truck-mounted drill equipped with a solid stem auger having the dimensions of 13.5 cm O.D. with sections length of 1.50 m was used for the sampling program. Clean soil cores were retrieved above the contaminated groundwater zone at a depth interval of 4.25- 4.50 m from the auger of each corresponding bore hole. Field textural classification according to Unified Soil Classification System (USCS) indicated a silty clay of liquid limit greater than 50% for all three soil samples.
One representative core sample was air-dried at room temperature, homogenized, and analyzed for its physical and chemical properties[14]. Soil sample soluble salts analyses were performed on a soil: water ratio (1:5) following centrifugation of the suspension at 5000 rpm. EC was determined on the aliquot. Analysis of calcium, magnesium, and sodium in the aliquot was performed by means of atomic absorption spectrometry. Soil sample pH was determined in 1:1 soil: 0.01M CaCl2 while total organic carbon (TOC) by dichromate digestion. Analysis of particle size was by hydrometer, particle density by water displacement, bulk density based on dry volume, and laboratory hydraulic conductivity was determined by the falling-head method at room temperature and corrected for groundwater temperature at 10°C. The results are presented in Table 1. The clean core sample was used for carrying out the isotherm study.
Table 1. Selected physical and chemical parameters for core sample.
| Parameters | |||||||||||||||||
|---|---|---|---|---|---|---|---|---|---|---|---|---|---|---|---|---|---|
| B.D.a | P.D.b | Θc | Sand | Silt | Clay | TOMd | TOCe | CECf | Na | Ca | Mg | ECg | Cμ* | Cc** | pH | SARh | Ki |
| g/cc | --------------%------------------(meq/100g) -------(mg/kg)-------μS/cm--- | ||||||||||||||||
| 1.23 | 3.3 | 63 | 34 | 44 | 22 | 0.58 | 0.34 | 19 | 18 | 42 | 92 | 608 | 4.53 | 0.003 | 8.1 | 0.67 | 1.42x10⁻⁶ |
a Bulk density = Mass of dry soil/Bulk volume
b Particle density = Mass of dry soil/Volume of liquid displaced
c Θ = Porosity, 100 -% solid space
d TOM = Total Organic matter
e TOC = Total organic carbon (i.e., TOM/1.724).
f CEC = Cation exchange capacity, Σ of soil exchangeable cations/100 g
*Coefficient of uniformity = D60/D10
**Coefficient of gradation = (D30)2/(D10/D60)
g EC = Electrical conductivity
h SAR = Sodium adsorption ratio, Na/{(Ca+Mg)1/2/2}
i K = {aL/At} ln(h1/h2) where a = cross-sectional area of standpipe; A = cross-sectional area of soil sample; L =length of sample; t = elapsed time of test; h1 = hydraulic head across sample at beginning of test (t = 0); h2 = hydraulic head across sample at end of test (t = ttest)
Clean representative groundwater sample was collected from an upgradient groundwater monitoring well at the site. The collected groundwater sample was used as the source of water in the study. Selected physical and chemical parameters are reported inTable 2.
Table 2. Selected physical and chemical parameters of groundwater sample.
| Parameters | ||||||||
|---|---|---|---|---|---|---|---|---|
| pH | EC | Turbidity | TDS | Alkalinity* | HCO3 | CO3 | SO4-2 | Cl- |
| (mS) | (NTU)** | --------------(mg/L)---------------------- | ||||||
| 7.9 | 3.09 | 2.50 | 2210 | 920 | 1100 | 0.50 | 47 | 10 |
*Alkalinity (total, as CaCO3)
** Nephelometric
Chemicals
All the chemicals were reagent grade and were purchased from Maxxam Analytics. Mixture of solutions of DNAPL constituents were prepared by initially dissolving them in a small volume of ethanol. Then, the final volume adjusted with clean groundwater from the site to achieve the desired concentrations.
ClO2 is considered as a paramagnetic radical. Reagents to generate ClO2 was supplied by Twin Oxide Canada Corporation. It involves using a two component method of acid and chlorite combination: 5NaClO2+ 4 HCl→ 4ClO2+ 2H2O + 5NaCl. The ClO2 stock solution for the study was prepared in deionized water, protected from light and used after an hour of preparation. The TwinOxide system is expected to generate a ClO2 solution with a purity of 99.90%.
Batch mode sorption systems
Sorption isotherms were obtained at 6°C using batch equilibration technique. Because of the low water solubility of the investigated chemicals, the desired volume of the standards was initially dissolved in methanol and then added to the experimental solution. Clean groundwater sample collected from the site was used in the preparation of the experimental solutions. It was assumed that the carrier solvent methanol has no effect on solutes equilibrium behavior due its relatively low concentration (< 0.3% v/v) in the final experimental solution thereby minimizing co-solvent effects[15]. Sorption capacity of the sorbent exposed to various concentrations of a solution of sorbate is depicted in Table 3. Equilibrium isotherms were developed in a 250 mL wide mouth jar. Batching mixtures was conducted by gently mixing 79 g of clean subsoil substrate with 30 mL of experimental solutions. The solid-to-liquid ratio was maintained at 2.6 to 1 in order to achieve maximum equilibrium sorption. The mixture system was sealed with a screw cap coated with Teflon and allowed to equilibrate for 72 hours in a dark cool room at 6°C. Kinetic experiments revealed that apparent equilibrium for such chemicals is reached in 72 hours or less for the range of concentrations used in the study[16,17]. Following equilibration, supernatant was removed with a glass pipette from each respective sorbent: sorbate system, transferred into a labeled glass vial, and then sealed with a Teflon-lined screw cap. The vials were stored at 6°C prior to analysis.
Table 3. Experimental design for the batch isotherm study.
| Items | Standards Concentration | Treatment 1 | Treatment 2 | Treatment 3 | Treatment 4 | Treatment 5 |
|---|---|---|---|---|---|---|
| Glass jar (g) | - | 183.30 | 183.13 | 185.19 | 185.19 | 188.25 |
| Sorbent (g) | - | 79.92 | 79.65 | 80.15 | 80.09 | 79.95 |
| -----μg/mL---- | --------μL----- | --------μL----- | --------μL----- | --------μL----- | --------μL----- | |
| PAHs | 20 | 0 | 250 | 500 | 1000 | 2000 |
| PCBs | 10 | 0 | 50 | 100 | 200 | 400 |
| SVPHENs | 20 | 0 | 100 | 200 | 400 | 800 |
| F2FIDEs* | 70,000 | 0 | 500 | 1000 | 2000 | 4000 |
| BTEXHSABs** | 500,000 | 0 | 10 | 20 | 40 | 80 |
| Total Volume (mL) | - | 30 | 30.91 | 31.82 | 33.64 | 37.28 |
*Diesel motor oil concentration
**Gasoline concentration
The extent of sorption was estimated as the difference between initial and final analyte concentration. No correction was required for any chemical constituent detected in the initial sorbent or groundwater samples. Experimental controls were prepared the same way but in the absence of soil and groundwater materials.
Destruction in UV/ClO2 solution systems
Destruction of solutes mixtures of DNAPL constituents was conducted at room temperature in 2L Erlenmeyer flasks wrapped in brown paper. Various solution systems were prepared with methanol as the carrier solvent for the solution. The experimental design is depicted in Table 4. Final volume of the reaction solution was 1.91L.
An 11 inch long UV lamp 254 nm, 0.4mWcm-2, 6 W 100V, was used. Each reaction flask was capped with tin foil and wrapped with brown paper. The reaction mixtures were treated for five minutes.The flasks were capped with tin foil, parafilmed, and secured in a cooler filled with ice prior to be parametized.
Table 4.Experimental design for the ClO2/UV degradation study.
| Chemicals | ||||||||
|---|---|---|---|---|---|---|---|---|
| Treatment | SVPHENs (μL) | PCBs (μL) | PAHs(mL) | BTEXHSABs(μL) | UV Exposure | ClO2(mg) | H2SO4 (mL) | System pH |
| 1 | 90 | 24 | 1.2 | 48 | no | no | no | 7.1 |
| 2 | 90 | 24 | 1.2 | 48 | yes | no | no | 6.7 |
| 3 | 90 | 24 | 1.2 | 48 | yes | 300 | no | 6.6 |
| 4 | 90 | 24 | 1.2 | 48 | yes | 300 | no | 3.5 |
| 5 | 0 | 0 | 0 | 0 | no | no | no | 7 |
Chemical analysis
Chemical analysis of sorbates was performed by Maxxam Analytics, a licensed and accredited commercial laboratory located in Calgary. CCME, EPA 8260C method was used for BTEX analysis, PAHs quantifying by EPA 3540C/8270D method, EPA 3550B and EPA 8082A methods for PCBS analysis, Phenols analysis according to EPA method 3510C and 8270D and Benzo(a) pyrene using EPA method 8270D.
Results and Discussion
Isotherm study
The equilibrium sorption model was used to ascertain the sorption of the sorbents. Sorption of hydrophobic organic chemicals on solid groundwater fabric is one of the key processes which dictate their fate in groundwater systems. Their sorption is often described by the linear, Freundlich or Langmuir equation. The Freundlich equations is expressed as Eq. (1)
X/M = KCeq (1)
And by taking the log on both sides, Eq (2) can be obtained as the linear form
X/M = KfCeq n ; n < 1 or n > 1 (2)
Where X/M is the amount of sorbate sorbed per unit of mass of sorbent (mg/Kg), Ceq is the concentration of sorbate in equilibrium solution (mg/L). The values of K and Freundlich Kf are apparent sorption coefficient {(mg/kg)/(mg/L)-1} that provides an index of sorption capacity. They can be defined as the sorption or distribution coefficient and the isotherm parameter n is an indication of site energy heterogeneity. Note that for n = 1, the Freundlich equation reduces to the linear form. Both Freundlich and Langmuir models were used to describe the sorption isotherms for the data.
The Langmuirisotherm relationship is of a hyperbolic form as Eq. (3)
X/M = abCeq/(1+bCeq) (3)
where X/M and Ceq are the same units as described above, bis a constant related to the affinity or binding energy between the sorbent and sorbate (L/kg), and constant are presents the maximum contaminant uptake by the sorbent under the given conditions (mg/kg).
The linearization of Langmuir is given by Eq.(4)
[Ceq]/[X/M] = 1/[ab] + [Ceq]/[a] (4)
The linear regression of the plot of [Ceq]/[X/M] as a function of Ceq yields a best-fit line with a slope of 1/a and 1/ab as the intercept. The Langmuir relationship can also be linearized by plotting 1/X/M versus Ceq. The maximum amount of contaminant sorbed onto the sorbent under the experimental conditions can be calculated from the Langmuir linear equation.
The characteristic of the sorbate-sorbent system yielded total sorption of polychlorinated biphenyls constituents. There was no data available to construct equilibrium isotherms
All the sorbate-sorbent systems yielded the S-type[18] isotherms (Figure 1). The S type sorption curves occur when the sorbent has a very strong affinity for the solvent, therefore, competes strongly with sorbate for sorption sites. Giles et al[18] postulated that the S-type isotherm is due to co-operative interactions among sorbed organic species directly stabilizing the sorbate and thereby enhancing the affinity of the surface matrix for the sorbate. In so doing, may lead to clustering of the sorbate in lieu of random surface mixing. Similar S-type isotherms were reported[19-21].
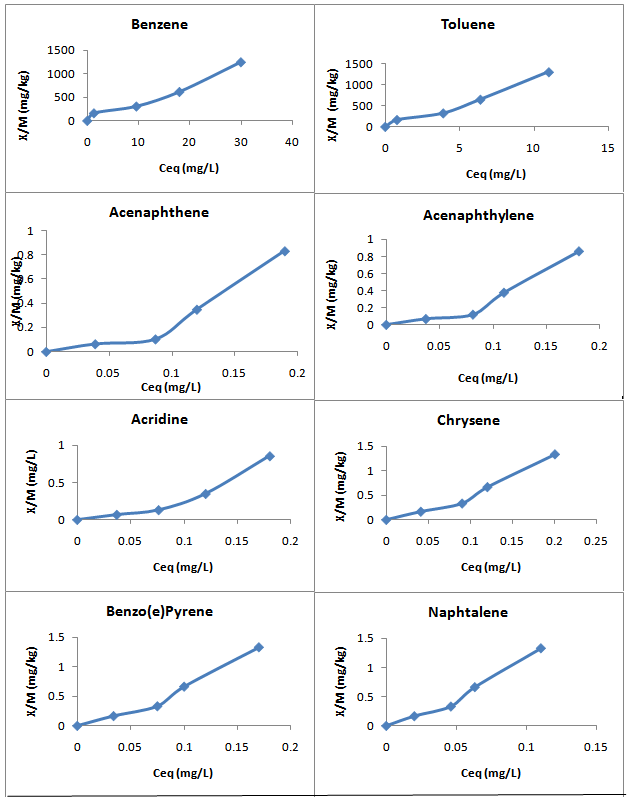
Figure 1: Selected examples of the S type sorption isotherms.
The linear regression equations and the corresponding coefficient (R²) for the fitted Freundlich and Langmuir are reported in Table 5. All the sorption isotherms could be best fitted to the Freundlich model except PHE-2, 6-Dichlorophenol. As shown in Table 5, PHE-2, 6-Dichlorophenol could be best fitted to the Langmuir linear model. The values of R² for Freundlich ranged from 0.76 to 0.98 demonstrating sorption nonlinearity to some extent for some chemicals. R² values were all significant at 5% level of significance. Langmuir value of R² for PHE-2, 6-Dichlorophenol was 0.88 which was significant at at 5% level of significance.
The Freundlich equation parameters Kf and 1/n is a function of the strength of sorption during the sorption process respectively. Both parameters are characteristics of a sorbent-sorbate system. It has been reported[23] that the 1/n value in the Freundlich equation can serve as an index of site energy distribution. They concluded the smaller 1/n, more heterogeneous are the sorption sites. The coefficient values 1/n determined on the log-log practical linear portion of the Freundlich isotherm curves are shown in Table 5. From the data in Table 5, 77% of the sorbates have a 1/n value less than 1 while 23% have a value greater than 1. The coefficient values 1/n ranged from 0.4338 to 2.226 while Kf values ranged from 0.89 to 3.049. This suggests that the sorption sites are distributed heterogeneously throughout the sorbent matrix. In this way, the strong intermolecular forces between their hydrophobic residues provide more hydrophobic sites for accommodation of sorbates. Selected physical properties of the sorbates[23] are reported in Table 6. Relationship between log of Kf and log Kow is shown in Figure 2. Polarity is an important parameter affecting sorption activity of organic contaminants. However, the hydrophobicity of sorbents was not found to be strongly correlated to their sorption coefficients, Kf. Furthermore, the R2 = 0.48 was not found significant at 5% of significance. Such lack of correlation provides evidence for a complex sorption process dominated by several mechanisms.
Table 5. Freundlich and Langmuir linear regression model coefficients.
| Freundlich | Langmuir | |||||||
|---|---|---|---|---|---|---|---|---|
| Linear Regression | Kf | 1/n* | R² | Linear Regression | R² | a (mg/Kg) | b (mL/g) | |
| Analytes | ||||||||
| BENZENE | y = 38.969x + 9.8344 | 2.0759 | 1.673 | 0.9688 | y = -0.0057x + 49.433 | 0.003 | -175.4385965 | -0.00012 |
| TOLUENE | y = 113.47x - 13.293 | 2.2267 | 1.3380 | 0.9736 | y = -0.005x + 50.378 | 0.003 | -200 | -0.00010 |
| ETHYLBENZENE | y = 473.54x - 46.407 | 2.6529 | 1.126 | 0.9786 | y = -0.0048x + 51 | 0.002 | -208.3333333 | -0.00009 |
| m & p- XYLENE | y = 115.86x - 40.364 | 2.0786 | 1.092 | 0.9729 | y = -0.0047x + 50.095 | 0.002 | -212.7659574 | -0.00009 |
| o-XYLENE | y = 312.89x - 34.513 | 2.471 | 1.061 | 0.9775 | y = -0.0048x + 50.824 | 0.002 | -208.3333333 | -0.00009 |
| F1 (C6-C10) | y = 3.2528x + 90.15 | 2.0252 | 2.226 | 0.8325 | y = -0.0087x + 184.19 | 0.003 | -114.9425287 | -0.00005 |
| PAH-ACENAPHTENE | y = 4.3599x - 0.1101 | 0.892 | 0.642 | 0.8784 | y = 0.0113x + 0.0184 | 0.043 | 88.49557522 | 0.61413 |
| PAH-ACENAPHTYLENE | y = 4.8059x - 0.1076 | 1.0766 | 0.614 | 0.8983 | y = 0.0098x + 0.0202 | 0.029 | 102.0408163 | 0.48515 |
| PAH-ACRIDINE | y = 4.6739x - 0.104 | 1.037 | 0.628 | 0.8949 | y = 0.0092x + 0.0204 | 0.026 | 108.6956522 | 0.45980 |
| PAH-ANTHRACENE | y = 4.7797x - 0.1056 | 1.0172 | 0.6377 | 0.8929 | y = 0.0092x + 0.0207 | 0.024 | 108.6956522 | 0.44444 |
| PAH-BENZO(a)ANTHRACENE | y = 4.6154x - 0.1021 | 0.9978 | 0.6490 | 0.8913 | y = 0.0085x + 0.0206 | 0.019 | 117.6470588 | 0.41262 |
| PAH-BENZO(k)FLUORANTHRACENE | y = 4.904x - 0.1025 | 1.0114 | 0.6554 | 0.9072 | y = 0.007x + 0.023 | 0.013 | 142.8571429 | 0.30435 |
| PAH-BENZO(C)PHENANTHRENE | y = 4.6398x - 0.097 | 0.9588 | 0.6649 | 0.8999 | y = 0.0068x + 0.0222 | 0.010 | 147.0588235 | 0.30631 |
| PAH-BENZO(e)PYRENE | y = 4.9427x - 0.1035 | 1.0245 | 0.6484 | 0.9045 | y = 0.0077x + 0.0227 | 0.016 | 129.8701299 | 0.33921 |
| PAH-BENZO(a)PYRENE | y = 5.0572x - 0.1039 | 0.9917 | 0.6709 | 0.9053 | y = 0.006x + 0.0248 | 0.008 | 166.6666667 | 0.24194 |
| PAH-CHRYSENE | y = 4.5006x - 0.1054 | 1.0607 | 0.6000 | 0.8843 | y = 0.0125x + 0.017 | 0.058 | 80 | 0.73529 |
| PAH-FLUORANTHENE | y = 4.6268x - 0.1063 | 1.0163 | 0.6270 | 0.8853 | y = 0.0105x + 0.019 | 0.034 | 95.23809524 | 0.55263 |
| PAH-FLUORENE | y = 4.3412x - 0.1055 | 1.0659 | 0.5886 | 0.8775 | y = 0.0137x + 0.0154 | 0.078 | 72.99270073 | 0.88961 |
| PAH-2-METHYLNAPHTALENE | y = 5.8116x - 0.1004 | 0.9971 | 0.7188 | 0.9311 | y = 0.0006x + 0.0342 | 7E-05 | 1666.666667 | 0.01745 |
| PAH-NAPHTALENE | y = 6.0662x - 0.0985 | 0.9852 | 0.7422 | 0.9372 | y = -0.0015x + 0.0382 | 0.003 | -666.6666667 | -0.03927 |
| PAH-PHENANTHRENE | y = 4.2044x - 0.1118 | 1.2091 | 0.5243 | 0.8633 | y = 0.0189x + 0.0111 | 0.242 | 52.91005291 | 1.70270 |
| PAH-PERYLENE | y = 4.482x - 0.1133 | 1.1139 | 0.5706 | 0.8694 | y = 0.0153x + 0.0146 | 0.112 | 65.35947712 | 1.04795 |
| PAH-PYRENE | y = 4.3472x - 0.1091 | 1.0857 | 0.7163 | 0.8685 | y = 0.0152x + 0.0144 | 0.103 | 65.78947368 | 1.05556 |
| PHE-CRESOLS | y = 13.064x - 0.067 | 3.0488 | 0.4338 | 0.8169 | y = 0.0079x + 0.0113 | 0.021 | 126.5822785 | 0.69912 |
| PHE-2,3,5,6-TETRACHLOROPHENOL | y = 9.2898x - 0.0408 | 2.2951 | 0.5243 | 0.8483 | y = -0.0043x + 0.0121 | 0.002 | -232.5581395 | -0.35537 |
| PHE-2,3,4,6-TETRACHLOROPHENOL | y = 8.5963x - 0.038 | 2.5427 | 0.4807 | 0.8781 | y = 9E-05x + 0.0097 | 2E-06 | 11111.11111 | 0.00928 |
| PHE-2,4-DICHLOROPHENOL | y = 7.5086x - 0.0395 | 2.3928 | 0.4862 | 0.7629 | y = 0.0031x + 0.0081 | 0.001 | 322.5806452 | 0.38272 |
| PHE-2,6-DICHLOROPHENOL | y = 2.0592x + 0.1705 | 1.5799 | -2.1195 | 0.0102 | y = 0.7926x - 0.0618 | 0.881 | 1.261670452 | 12.82524 |
| PHE-2-CHLOROPHENOL | y=11.131x - 0.0489 | 2.3212 | 0.5332 | 0.8412 | y = -0.005x + 0.0149 | 0.002 | -200 | -0.33557 |
| PHE-3 & 4-METHYLPHENOL | y = 13.064x - 0.067 | 3.0488 | 0.4338 | 0.8169 | y = 0.0079x + 0.0113 | 0.0216 | 126.5822785 | 0.69915 |
*1/n as determined on log-log practical linear portion of the Freundlich isotherm curve
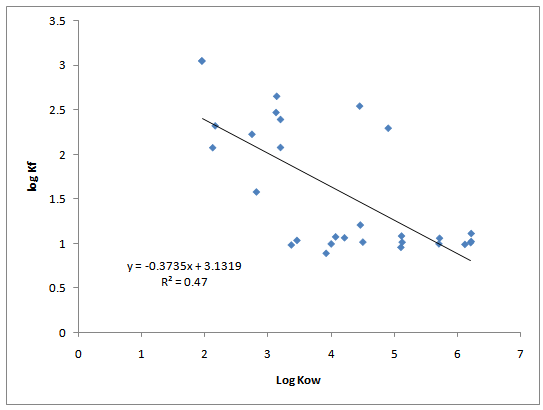
Figure 2: Correlation of sorption coefficients, Kf,with octanol-water partition, Kow.
Table 6.Selected physical properties of sorbates.
| Analytes | Molecular Weight | Aqueous Solubility | Log KOW |
|---|---|---|---|
| -----(g/mole)---------------(mg/L, 25°C)----- | |||
| Benzene | 78.11 | 1780 | 2.13 |
| Toluene | 92.14 | 535 | 2.75 |
| Ethylbenzene | 106.16 | 152 | 3.14 |
| m& p-Xylene | 106.16 | 198 | 3.20 |
| o-xylene | 106.16 | 175 | 3.13 |
| PAH-Acenaphtene | 154.2 | 3.47 | 3.98 |
| PAH-Acenaphtylene | 152.2 | 3420 | 4.07 |
| PAH-Acridine | 179.2 | 22.40 | 3.46 |
| PAH-Antrhacene | 178.2 | 59 | 4.5 |
| PAH-Benzo(a)anthracene | 228.3 | 11 | 5.7 |
| PAH-Benzo(k)fluorantharcene | 252.31 | 0.00055 | 6.2 |
| PAH-Benzo(c)phenanthrene | 228.29 | 0.02635 | 5.71 |
| PAH-Benzo(e)pyrene | 252.3 | 2.40 | 6.21 |
| PAH-Benzo(a)pyrene | 252.3 | 3.80 | 6.11 |
| PAH-Chrysene | 228.3 | 1.90 | 5.7 |
| PAH-Fluoranthene | 202.3 | 260 | 5.12 |
| PAH-Fluorene | 166.2 | 800 | 4.21 |
| PAH-2-Methylnaphtalene | 142.2 | 24.6 | 4 |
| PAH-Naphtalene | 128.2 | 34,000 | 3.37 |
| PAH-Phenanthrene | 178.2 | 435 | 4.46 |
| PAH-Perylene | 252.3 | 2.4 | 6.21 |
| PAH-Pyrene | 202.1 | 133 | 5.11 |
| PHE-Cresols | 108.14 | 25,950 | 1.96 |
| PHE-2,3,5,6-Tetrachlorophenol | 231.89 | 100 | 4.9 |
| PHE-2,3,4,6- Tetrachlorophenol | 231.89 | 183 | 4.45 |
| PHE-2,4-Dichlorophenol | 163 | 4,500 | 3.2 |
| PHE-2,6-Dichlorophenol | 163 | 1,900 | 2.82 |
| PHE-2-Chlorophenol | 128.56 | 20,000 | 2.17 |
| PHE-3&4-Methylphenol | 108.14 | 25,950 | 1.96 |
The notably higher sorption coefficients 1/n for phenolic sorbates further suggests a sorption mechanism that their polar functional groupsmay also attach to the sorbent by forming hydrogen bonds. As a result, polar functional groups prevent the sorbent from forming hydrogen bonds with water. The dominant mechanism for sorption of the sorbates may have been through a combination of hydrogen bonding, dipole-dipole and hydrophobic interactions with the sorbent. Dipole-dipole form of sorption tends to be weaker and less specific when sorption occurs through hydrophobic interactions, hydrogen bonding, or through a true chemical reaction such as in chemisorptions.
Sorption coefficients, Kf, were found to be poorly correlated, R²=0.47 and not significant at 5% level of significance, with octanol-water partition, Kow (Figure 2). This tends to indicate that sorption activity is influenced by co-solvation effects as well as by polarity.
The partition coefficient, Kf, allows for a rapid determination of the relative affinity and bioavailability of sorbates for solid substrates without concern for the cause or controlling processes involved. In many contaminants modeling, Kf is used to evaluate mass of solute transport of chemical species in groundwater systems. As a retardation factor in contaminants transport equations, the higher the Kf, the more retarded a contaminant will be by being advectively transported.
It should be pointed out that Darcy’s law applies to laminar flow in porous media and is valid for Reynolds number (R = рVd/μ) less than 1 and perhaps as high as 10. This represents an upper limit to the validity of Darcy’s law, which turns out to be applicable in most groundwater systems. Deviations occur near pumped wells and in fractured groundwater systems with large openings.
The governing equation to ascertain off site contaminants migration is expressed as Eq. (5)
![]() (5)
(5)
Where V is advective velocity of the contaminant, K is hydraulic conductivity, dh/dl is hydraulic gradient, Ø groundwater fabric porosity, BD is bulk density and R is retardation factor. Subsequently, travel time is calculated by dividing the linear flow path length by the sorbent advective velocity.
In the above equation, the retardation factor for Freundlich can be expressed as Eq. (6)
R = 1 + {[Pb/Φ] Kf} (6)
and Langmuir retardation factor is expressed as Eq. (7)
R = 1 + [Pb/Φ] {a b / (1 + a Ceq)2} (7)
Contaminants transport calculations were performed using a conservative approach and no distinction was made between horizontal and vertical flow. The linear flow path length for any contaminant to travel off property boundary is estimated at 100 m. The head loss in September 2008 for BH-20 was (97.70-97.10) m = 0.60 m; for BH-21 = (97.50 – 97.10) m = 0.40 m; and for BH-23 = (97.20-97.10) m = 0.1m, respectively. Using July 2008 groundwater information, it was calculated that the head loss for BH-20 was 0.40 m; for BH-21, the head loss was equal to 0.30; and for BH-23, the head loss was estimated to be 0.10 m. The contaminants transport calculations will assume the occurrence of an isotropic and homogeneous porous medium. Table 7 contains the travel time calculations under the site hydrogeological conditions evaluated. Calculated travel time ranged from 145 to 80,817 years. Although travel time for PCBs sorbates could not be calculated since 100% sorption occurred, it is logical to stipulate that travel will be greater than 80,817 years.
Table 7. Estimated travel time for contaminants to migrate off site in detected boreholes.
| Contaminant Isotherm | Freundlich Kf | Travel Time (years) | |||||
|---|---|---|---|---|---|---|---|
| July 24 2008 | September 23 2008 | ||||||
| Borehole-20 | Borehole-21 | Borehole-23 | Borehole-20 | Borehole-21 | Borehole-23 | ||
| BENZENE | 2.0759 | 17245.33 | 2328.68 | 288.56 | 11487.40 | 1744.91 | 288.56 |
| TOLUENE | 2.2267 | 18254.92 | 2469.42 | 306.78 | 12159.91 | 1850.36 | 306.78 |
| ETHYLBENZENE | 2.6529 | 21108.28 | 2867.17 | 358.27 | 14060.57 | 2148.40 | 358.27 |
| m & p- XYLENE | 2.0786 | 17263.41 | 2331.20 | 288.89 | 11499.44 | 1746.80 | 288.89 |
| o-XYLENE | 2.471 | 19890.48 | 2697.41 | 336.30 | 13249.38 | 2021.20 | 336.30 |
| F1 (C6-C10) | 2.0252 | 16905.90 | 2281.37 | 282.44 | 11261.30 | 1709.46 | 282.44 |
| PAH-ACENAPHTENE | 0.892 | 9319.27 | 1223.81 | 145.53 | 6207.72 | 917.02 | 145.53 |
| PAH-ACENAPHTYLENE | 1.0766 | 10555.14 | 1396.09 | 167.83 | 7030.96 | 1046.11 | 167.83 |
| PAH-ACRIDINE | 1.037 | 10290.03 | 1359.14 | 163.04 | 6854.36 | 1018.42 | 163.04 |
| PAH-ANTHRACENE | 1.0172 | 10157.47 | 1340.66 | 160.65 | 6766.06 | 1004.57 | 160.65 |
| PAH-BENZO(a)ANTHRACENE | 0.9978 | 10027.59 | 1322.55 | 158.31 | 6679.54 | 991.00 | 158.31 |
| PAH-BENZO(k)FLUORANTHRACENE | 1.0114 | 10118.64 | 1335.24 | 159.95 | 6740.19 | 1000.51 | 159.95 |
| PAH-BENZO(C)PHENANTHRENE | 0.9588 | 9766.49 | 1286.16 | 153.60 | 6505.62 | 963.73 | 153.60 |
| PAH-BENZO(e)PYRENE | 1.0245 | 10206.34 | 1347.47 | 161.53 | 6798.61 | 1009.68 | 161.53 |
| PAH-BENZO(a)PYRENE | 0.9917 | 9986.75 | 1316.86 | 157.57 | 6652.34 | 986.74 | 157.57 |
| PAH-CHRYSENE | 1.0607 | 10448.69 | 1381.25 | 165.91 | 6960.05 | 1034.99 | 165.91 |
| PAH-FLUORANTHENE | 1.0163 | 10151.44 | 1339.82 | 160.54 | 6762.04 | 1003.94 | 160.54 |
| PAH-FLUORENE | 1.0659 | 10483.51 | 1386.11 | 166.54 | 6983.24 | 1038.63 | 166.54 |
| PAH-2-METHYLNAPHTALENE | 0.9971 | 10022.90 | 1321.90 | 158.22 | 6676.42 | 990.51 | 158.22 |
| PAH-NAPHTALENE | 0.9852 | 9943.23 | 1310.79 | 156.79 | 6623.35 | 982.19 | 156.79 |
| PAH-PHENANTHRENE | 1.2091 | 11442.21 | 1519.75 | 183.84 | 7621.85 | 1138.76 | 183.84 |
| PAH-PERYLENE | 1.1139 | 10804.86 | 1430.90 | 172.34 | 7197.30 | 1072.19 | 172.34 |
| PAH-PYRENE | 1.0857 | 10616.07 | 1404.58 | 168.93 | 7071.54 | 1052.47 | 168.93 |
| PHE-CRESOLS | 3.0488 | 23758.78 | 3236.64 | 406.11 | 15826.12 | 2425.25 | 406.11 |
| PHE-2,3,5,6-TETRACHLOROPHENOL | 2.2951 | 18712.85 | 2533.25 | 315.05 | 12464.94 | 1898.19 | 315.05 |
| PHE-2,3,4,6-TETRACHLOROPHENOL | 2.5427 | 20370.50 | 2764.32 | 344.96 | 13569.13 | 2071.34 | 344.96 |
| PHE-2,4-DICHLOROPHENOL | 2.3928 | 19366.94 | 2624.43 | 326.85 | 12900.64 | 1966.52 | 326.85 |
| PHE-2,6-DICHLOROPHENOL* | 1.5799 | 13924.67 | 1865.79 | 228.64 | 9275.46 | 1398.06 | 228.64 |
| PHE-2-CHLOROPHENOL | 2.3212 | 18887.59 | 2557.61 | 318.20 | 12581.34 | 1916.45 | 318.20 |
| PHE-3 & 4-METHYLPHENOL | 3.0488 | 23758.78 | 3236.64 | 406.11 | 15826.12 | 2425.25 | 406.11 |
* Using Langmuir
Chemicals destruction in ClO2/UV solution systems
ClO2 chemical is a relatively strong, water soluble oxidant, works at a broad pH-range from 4- 10, and does not hydrolyze in water. ClO2 is approximately ten times more soluble in water than chlorine. Unlike chlorine, ClO2 does not appear to react with natural humic material to produce trihalo methane’s and other harmful carcinogenic chemical by-products[24]. However, important considerations must be given to potential nonchlorinated by-products that may be formed through reaction with ClO2. By-products that have been reported to be formed include aldehydes, quinones, acids, disulfides, sulfonic acids, oxalic acids, and epoxides[24]. The relative amounts of by-product species formed in a system may be a function of the type and concentration of humic material, and its macromolecular structure as well the amount of ClO2 residual maintained in the system. Oxidant ClO2 demand for sorbates degradation was determined based on recommended concentration of 3000 ppm solution and a typical dosing rate between 0.05- 2 ppm. Destruction efficiency of chemicals of concern in the various ClO2/UV solution systems is reported in Table 8. Control system validates that the design chemical mass was achieved, and any mass loss adjustment from a system other than via UV/ClO2 destruction for the response was measured and calculated. Treatment 3 (ClO2/UV) yielded overall the highest % destruction efficiency ranging from 76 to 98%. For practical considerations, addition of H2SO4 to treatment 4 will tend to make such treatment systems less attractive. No dioxins or furans were formed as by-products in any of the treatment systems investigated. A proposed general destruction equation:
{ClO2+ solution ↔ ClO2(g) + CO2 + solution + non-toxic oxidized species + salts} + UV
Table 8. Destruction of chemicals by batch UV/ClO2 systems.
| UV/ClO2 system | % chemical destruction* |
|---|---|
| Treatment 1 (control) | 0 |
| Treatment 2 | 50-75% PCBs; 60-75% PAHs; 50-80% BETEX; 74% Phenol |
| Treatment 3 | 97-100% PCBs; 76-93% PAHs; 82-86% BETEX; 98% Phenol |
| Treatment 4 | 97-100% PCBs; 76-93% PAHs; 82-86% BETEX; 98% Phenol |
% chemical destruction = {(Initial mass sorbate – Final mass sorbate) / Initial mass sorbate}100
UV enhances quantum vibration in molecules and thereby catalyzes their destruction by ClO2(g) dissolved in solution as the active radical. As ClO2 disproportionate in aqueous systems, both chlorite (ClO2-) and chlorate (ClO3-) anions have the potential to be formed as by-products to potentially decrease effectiveness of ClO2(g)[24]. Chemicals destruction rate and % destroyed in the five minutes period represent achieved system effectiveness under the experimental conditions. Hence, higher or lower values will represent a more or a less effective system. Destruction of the chemicals in the ClO2/UV solution systems is postulated to occur primarily through free radical processes with marginal chemicals oxidation occurring through direct electron transfer. The reactions are expected to be second-order, temperature dependent, and not significantly affected by pH in a range of 4-10. The paramount features of this highly effective destruction method are that ClO2 is relatively inexpensive chemical, very water soluble, easy to handle, and store safely on site. Furthermore, under optimum environmental conditions, the time required for chemicals destruction is short.
Conclusion
This study indicates that all the sorbate-sorbent systems yielded the S-type isotherms due to co-operative interactions among sorbed organic species. Sorption behavior of PAHs, PCBs, Phenols, and BTEX hydrocarbon in an intermixing aqueous solution onto a solid groundwater sample could be best represented mathematically by the Freundlich equation. The coefficient values 1/n ranged from 0.4338 to 2.226 while Kf values ranged from 0.89 to 3.049. Dominant mechanism for sorption of the sorbates is postulated to be through a combination of hydrogen bonding, dipole-dipole, and hydrophobic interactions with the sorbent. Contaminants transport calculations under various sites hydrogeological scenarios for potential off site migration ranged from 145 to 80,817 years. UV radiation through quantum enhancement in sorbate molecules enhances their destruction efficiency by ClO2. Destruction of the solutes in the UV/ClO2 solution systems is believed to occur through a combination of quantum vibration and free radical processes.
Funding: Funding for this project was provided by Trans Canada Corporation.
Conflicts of Interest: The author acknowledges that the preparation of this paper was free of any conflicts of interest.
References
- 1. Carls, E.G., Dennis, B.F., Scott, A.C. Soil contamination by oil and gas drilling and production operations in Padre Island National Shore, Texas, U.S.A. (1995) Journal of Environmental Management 45(3): 273- 286.
- 2. Jonker, M. T. Absorption of polycyclic aromatic hydrocarbons to cellulose. (2008) Chemosphere 70(5): 778- 782.
- 3. Pan, B., Ning, P., Xing, B. Part IV-sorption of hydrophobic organic contaminants. (2008) Environ Sci Pollut Res Int 15(7): 554-564.
- 4. Xuanyi, T., Yanbo, Z., Yanxiao, X., et al. Sorption of polycyclic aromatic hydrocarbons from aqueous solution by hexadecyltrimethylammonium bromide modified by fibric peat. (2010) J Cheml Technol Biotechnol 85(8): 1084- 1091.
- 5. Rodrigues, J. L., Maltseva, O.V., Tsoi, T.V., et al. Development of a Rhodococcus recombinant strain for degradation of products from anaerobic dechlorination of PCBs. (2001) Environ Sci Technol 35(4): 663- 668.
- 6. Fuse, H., Takimura, O., Murakami, K., et al. Degradation of chlorinated biphenyl, dibenzofuran, and dibenzo-p-dioxin by marine bacteria that degrade biphenyl, carbazole, or dibenzofuran. (2003) Biosci Biotechnol Biochem 67(5): 1121- 1125.
- 7. Sietman, R., Gesell, M., Hammer, E., et al. Oxidative ring cleavage of low chlorinated biphenyl derivatives by fungi leads to the formation of chlorinated lactose derivatives. (2006) Chemosphere 64(4): 672- 685.
- 8. Huang, I., Hong, C.S., Bush, B. Photocatalytic degradation of PCBs in TiO2 aqueous suspensions. (1996) Chemosphere 32(9): 1869-1881.
- 9. Vollmuth, S., Niessner, R. Degradation of PCDD, PCDF, PAH, PCB and chlorinated phenols during the destruction-treatment of landfill seepage water in laboratory model reactor (UV, ozone, and UV/ozone). (1995) Chemosphere 30(12): 2317-2331.
- 10. Zhang, G., Hua, I. Cavitation chemistry of polychlorinated biphenyls: Decomposition mechanisms and rates. (2000) Environ Sci Technol 34(8): 1529- 1534.
- 11. Chang, F.C., Chiu, T. C., Yen, J. H., et al. Dechlorination pathways of ortho-substituted PCBs by UV radiation in n-hexane and their correlation to the charge distribution on carbon atom. (2003) Chemosphere 51(8): 775- 784.
- 12. Kume, A., Monguchi, Y., Hattori, K., et al. Pd/C-catalyzed practical degradation of PCBs at room temperature. (2008) Applied Catalysis B: Environmental 81(3-4): 274- 282.
- 13. Liu, X., Yu, G. Combined effect of microwave and activated carbon on the remediation of polychlorinated biphenyl-contaminated soil. (2006) Chemosphere 63(2): 228- 235.
- 14. Klute, A. Chemical and microbial properties. In Methods of Soil Analysis, 2nd Edition. (1996) American Society of Agronomy: Madison, WI 167- 693.
- 15. Chefetz, B., Desmukh, A.P., Guthrie, A. Pyrene sorption by natural organic matter. (2000) Environ Sci Technol 34(14): 2925- 2930.
- 16. Walters R., Luthy, G. Equilibrium adsorption of polycyclic aromatic hydrocarbons from water onto activated carbon. (1984) Environ Sci Technol 18(6): 395- 4¬¬03.
- 17. Huang, Y., Boving, B., Xing, S. Sorption of PAHs by aspen wood fibers as affected by chemical alterations. (2006) Environ Sci Technol 40(10): 3279- 3284.
- 18. Giles, H., MacEwan, H., Nakhawa, S.N., et al. Studies in adsorption. Part XI. A system of classification of solution adsorption isotherms, and its use in diagnosis of adsorption mechanisms and in measurement of specific surface areas of solids. (1960) J Chem Soc 3973- 3993.
- 19. Carmo, A.M., Hundal, L.S., Thompson, M.L. Sorption of hydrophobic organic compounds by soil materials: application of unit equivalent Freundlich coefficients. Environ Sci Technol 34(20): 4363- 4369
- 20. Liang, C., Dang, Z., Xiao, B., et al. Equilibrium sorption of phenanthrene by soil humic acids. (2006) Chemosphere 63(11): 1961- 1968.
- 21. Wang, L., Xing, B. Sorption of organic contaminants by biopolymer-derived chars. (2007) Environ Sci Technol 41(24): 8342-8348.
- 22. Weber, W., McGinley, M., Katz, I. A distributed reactivity model for sorption by soils and sediments. 1. Conceptual basis and equilibrium assessments. (1992) Environ Sci Technol 26(10): 1955- 1962.
- 23. LogKOW: A databank of evaluated octonal-water partition coefficients (Log P). (2014) Sangster Research Laboratories.
- 24. Stevens, A.A. Reaction products of chlorine dioxide. (1982) Environ Health Perspect 46: 101- 110.


