
Structural, Optical and Magnetic properties of Ni-doped ZnO synthesized by Co-precipitation method
A.A.Gadalla1, Israa Abood1*, M.M.Elokr2
Affiliation
- 1Physics Department, Faculty of Science, Assuit University, Assuit, Egypt
- 2Physics Department, Faculty of Science, Al-Azhar University, Cairo, Egypt
Corresponding Author
Israa Abood, Physics Department, Faculty of Science, Assuit University, Assuit, Egypt, Tel: +201090030242; E-mail: Israa_abood@yahoo.com
Citation
Abood, I., et al. Structural, Optical and Magnetic Properties of Ni-Doped ZnO Synthesized by Co-Precipitation Method. (2017) J Nanotechnol Material Sci 4(1): 19- 26.
Copy rights
© 2017 Abood, I. This is an Open access article distributed under the terms of Creative
Commons Attribution 4.0 International License.
Keywords
Co-precipitation method; Optical properties; XRD; EDX; PL spectra; VSM.
Abstract
Dilute magnetic semiconductors of Ni-doped ZnO nanoparticles (Zn1-xNixO, where x = 0.00, 0.02, 0.04, 0.05, 0.06 and 0.08) were synthesized by the chemical co-precipitation method. The effects of Ni concentration on the structure, optical and magnetic properties of the obtained samples were investigated using X-ray diffraction (XRD), energy dispersive X-ray spectroscopic analysis (EDX), UV–visible absorption (UV–V) , photoluminescence spectroscopy (PL) and vibrating sample magnetometry(VSM).
XRD patterns of the prepared samples display that the lattice constants of Zn1-xNixO, of x > 0.0 are slightly larger than the ones of pure ZnO. However, XRD reveals that both pure and doped ZnO samples exhibit hexagonal wurtzite structure. The energy band gap has also been estimated using UV-Vis optical absorption spectra. EDX spectroscopy was used to identify the elemental constituents of a material in samples. Also, vibrating sample magnetometry (VSM) data of Ni-doped ZnO show distinctly hysteresis loops at room temperature indicating the ferromagnetic behavior of the samples.
Introduction
Dilute Magnetic Semiconductors (DMS) materials perform ferromagnetic behavior for spin-based light-emitting diodes, sensors, and transistors[1-3]. DMS materials are formed when some fractions of the atoms in a non-magnetic semiconductor host like ZnO are replaced by magnetic ions of Transition Metal (TM), like (Mn, Cr and Ni),or rare earth ions. Both types of ions have partially filled 3d and 4f shells, respectively, increasing unpaired electrons. The magnetic behavior of such materials depends upon the concentration of the TM ions in the crystal, the carrier density, and the crystal quality[4]. Nickel (II) can act upon by octahedral, square-planar and tetrahedral symmetries depending on the composition. The presence of a number of absorption bands and their position not handiest depend on crystal structure but also on the chemical composition and the particle morphology. Furthermore, ionic radii of Ni2+ (ionic radius: 0.69 Å) has the same valence as Zn2+ and its radius is close to that of Zn2+ (0.74 Å), so it is possible for Ni2+ to replace Zn2+ in ZnO lattice[5].
Recently, Ferromagnetism (FM) had been observed in undoped ZnO, which opened an extensive debate on the source of FM[6,7]. Therefore, some researchers propose that FM is related to oxygen defects in ZnO, not due to secondary phases or TM ions. Although the source of FM in TM doped and undoped ZnO has not been fully understood so far, oxygen (or Zn) defects are broadly recognized as an important reason for the FM behavior of doped and undoped ZnO[8]. ZnO nanoparticles can be prepared on a huge scale at low cost by simple solution based method, such as chemical precipitation, sol-gel synthesis, and hydrothermal reaction[9,10]. Co-precipitation is the name given by analytical chemists to a phenomenon whereby the fractional precipitation of a specified ion in a solution results in the precipitation not only of the target ion but also of other ions existing side by side in the solution[11]. Still, more studies on fabrication incontrollable manner and magnetic properties of ZnO-based DMSs are required to implement semiconductor-based spintronic devices.
In this study, an effective method for produces a Ni doped ZnO NPs is applied. These NPs are synthesized by chemical precipitation method. A comparative evaluation of the average particle size of the Ni-doped ZnO nanoparticles is calculated by XRD pattern. The strain due to lattice deformation associated with the ZnO nanoparticles will be calculated by a modified form of W-H, namely Uniform Deformation Model (UDM). The structural and optical properties of these samples reflect that the Ni2+ ions have substituted the Zn2+ ion without changing the wurtzite structure of ZnO. The magnetic studies are performed by VSM at room temperature. So, in-depth studies on fabrication in a controllable manner and magnetic properties of ZnO-based DMSs are important to develop semiconductor - based spintronic devices.
Experimental: Samples preparation
The DMS Samples of (Zn1-xNixO) have been prepared by using the chemical precipitation method. Ni-doped ZnO samples are prepared by varying Ni concentration where x = 0.00, 0.02, 0.04, 0.05, 0.06 and 0.08. The starting materials Zn (CH3COO)22H2O and Ni(CH3COO)24H2O had been blended then Poly-Vinylpyrrolidone (PVP) introduced with a constant value. A required amount of zinc acetate dihydrate was completely dissolved in distilled water also a required amount of Nickel acetate tetrahydrate was completely dissolved in distilled water. Two solutions were added drop by drop to the mixture with the addition of constant amount (1gram of PVP). Then they were mixed under a magnetic vigorous stirring for five hours. The experiment was performed at room temperature. The final ingots have been dried at 70ºC for one day and annealed at 300°C for six hours. To evaluate the crystalline structure and lattice parameter of the synthesized nanoparticles, XRD measurements were performed using Philips PW1710 control unit using anode material CuKα of (λ = 1.54060 Å), radiation operated at 40 KV and 20 mA in the range 10° to 80°. Energy Dispersion X-ray (EDX) detector linked to the scanning electron microscope (JEOL SEM 5400) is one of the most used analytical techniques for elemental analysis. The UV–Vis absorption spectra were recorded with a (LAMBDA 35) UV-Vis spectrophotometer. The Photoluminescence (PL) spectra were performed at room temperature with a (JASCO) FP-6300 spectrofluorometer. Magnetic measurements were performed on Vibrating Sample Magnetometer (VSM) (Lake Shore) of the 7410 series with fields to 3.1 Tesla.
Results and Discussion
Structural determination:
XRD analysis
Ni-doped ZnO and ZnO nanoparticles are characterized using XRD. The d-spacing of the peaks are well matched with standard data (JCPDS: 01-079-0208) for (x = 0.00) and (JCPDS: 01-075-2820) for (x = 0.02, 0.04, 0.05, 0.06, 0.08). In Figure 1, it has been observed that all of peaks of XRD pattern belong to the hexagonal lattice of ZnO that matching with (100), (002), (101), (102), (110) and (103) planes. From the 2θ value the inter- planner spacing of the peaks is calculated and listed in Table 1. There are good agreement between the observed and calculated (d) value indicating a suitability of unit cell parameters and the crystal structure. All of the XRD peaks were attributed to ZnO and no other undesired peaks were obtained due to the smaller ionic radii of the Ni2+ ions (ionic radius: 0.69 Å) are easily substituted within the internal of Zn2+ ions (ionic radius 0.74 Å). It is observed from XRD spectra that there is no existence for any peaks corresponding to Ni, oxides of Ni, Zn or Ni related secondary and impurity phases. Despite the fact that, there aren’t any secondary phases detected with the aid of XRD analysis; substantially the doping of Ni does not change the wurtzite structure of ZnO and hence Ni2+ substitutes Zn2+ site into the crystal lattice.
According to Bragg’s law[12],
nλ = 2d sinθ
Where n is the order of diffraction (usually n = 1), λ is the X-ray wavelength and d is the spacing between planes of given Miller indices h, k and l. The plane spacing is related to the lattice constants (a, c) and the cell volume by the following relations:
1/(dhkl2 ) = 4/3 (h2 + hk + k2 / a2 ) + l2/c2 (1)
ν = √3/2 a2 c = 0.866a2 c (2)
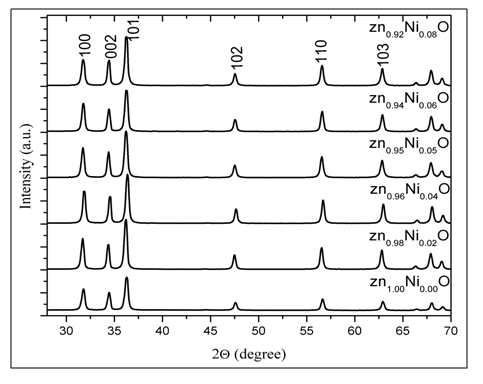
Figure 1: XRD pattern of Zn1-xNixO.
The calculated data are given in the Table. 1
The lattice parameters ‘a’ and ‘c’ are almost composition in dependent. This can easily be accounted for the small difference between the ionic radius of Ni2+ and Zn2+ ions. Debye–Scherrer and Williamson – Hall are harnessed to study X-ray results.
Table 1: The lattice constants, ratio of lattice parameters, interplanar spacing from XRD and calculate, cell volume and band gap energy of different Zn1-xNixO samples.
| Samples | a = b101 nm | C002 nm | c/a | dXRD (Å) | dcalculate (Å) | Cell volume (ν) nm | Eg(eV) |
|---|---|---|---|---|---|---|---|
| Zn1.00Ni0.00O | 0.324995 | 0.520423 | 1.60132 | 2.475 | 2.474 | 0.047602 | 3.07 |
| Zn0.98Ni0.02O | 0.325791 | 0.521708 | 1.60135 | 2.481 | 2.480 | 0.047954 | 2.74 |
| Zn0.96Ni0.04O | 0.324105 | 0.519214 | 1.60201 | 2.469 | 2.469 | 0.047231 | 2.69 |
| Zn0.95Ni0.05O | 0.325481 | 0.521193 | 1.6013 | 2.479 | 2.479 | 0.047816 | 2.64 |
| Zn0.94Ni0.06O | 0.325066 | 0.520641 | 1.60164 | 2.476 | 2.476 | 0.047643 | 2.56 |
| Zn0.92Ni0.08O | 0.325218 | 0.520768 | 1.60128 | 2.475 | 2.477 | 0.04770 | 2.49 |
Scherrer method
XRD peak profile analysis is a simple and powerful method to evaluate the peak broadening with crystallite size and lattice strain due to dislocation. Bragg peak width is summation of instrument and sample dependent effects. For an accurate analysis for size and strain effects, the instrumental broadening must be accounted. The instrumental corrected broadening[13] βhkl corresponding to each diffraction peak of ZnO was calculated using the relation,
βhkl = [(βhkl) measured - (βhkl) instrument]1/2 (3)
In particular, the ZnO ‹101› diffraction peak is much stronger than the ZnO ‹002› peak. This indicates that the formed ZnO nanocrystals have a preferential crystallographic ‹101› orientation. The average crystallite size (Dhkl) was calculated from XRD peak width of ‹100›, ‹002›, ‹101›, ‹102›, ‹110› and ‹103› based on the Debye–Scherrer equation[14]:
(Dhkl) = (Kλ) / (βhkl cosθ) (4)
Where βhkl is the integral half width, K is a constant equal to 0.94, λ is the wave length of the incident X-ray (λ = 0.1540 nm), D is the crystallite size, and θ is the Bragg angle. The average crystallite size calculated for synthesized ZnO nanoparticles were 27.16 nm. The dislocation density (δ), which represents the amount of defects in the sample is defined as the length of dislocation lines per unit volume of the crystal and is calculated using the Equation[14]:
δ = 1/D2 (5)
Where, D is the crystallite size. The dislocation density (δ) is 13.55 × 10⁻⁴ (nm)-2 calculated for synthesized ZnO.
Williamson-Hall method
Crystal imperfections and distortion of strain-induced peak broadening are related by ≈βs/ tanθ . There is an extraordinary property of Equation (4) which has the dependency on the diffraction angle θ. Debye–Scherrer equation follows a 1/cosθ dependency but not tan θ as W-H method. This basic difference was that both micro structural cause’s small crystallite size and micro strain occur together from the reflection broadening. Depending on different θ positions the separation of size and strain broadening analysis is performed according to Williamson - Hall. The following results are the addition of the Debye–Scherrer equation and ε ≈ βhkl / (4 tanθ ).
βhkl = Kλ /(D cosθ) + 4ε tanθ (6)
βhkl cosθ = Kλ / D + 4ε sinθ (7)
The Equation (7) is Williamson–Hall (W-H) modified,which represents the uniform deformation model (UDM)[15], where the strain was assumed to be uniform in all crystallographic directions. The term (βhkl cosθ) was plotted with respect to (4 sinθ) for the preferred orientation peaks of Zn1-xNixO with the wurtzite hexagonal phase. Accordingly, the slope and y-intersect of the fitted line represent strain and particle size, respectively. The plots showed a negative strain for the Zn1-xNixO. This strain may be due to the lattice shrinkage that was observed in the calculation of lattice parameters. The UDM for Zn1-xNixO samples are shown in Figure 2. The results obtained from the Scherrer method and UDM model are summarized in Table 2. It was observed that the strain value increased and the average crystallite size of the Ni doped ZnO samples have decreased with, increasing in the Ni concentration. From the UDM model strain has very little effect on the average crystallite size. However, a variation in the average crystallite size obtained from Scherrer’s formula and W–H analysis was due to the difference in averaging the particle size distribution. By inspection of the plots, it appears that the result of the UDM model was more accurate as the data were almost fitted in this method.
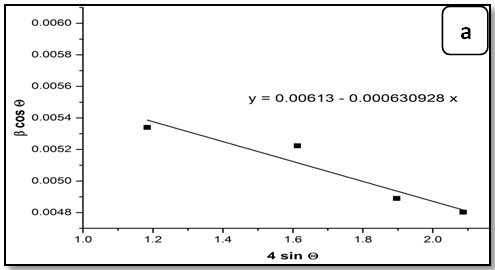
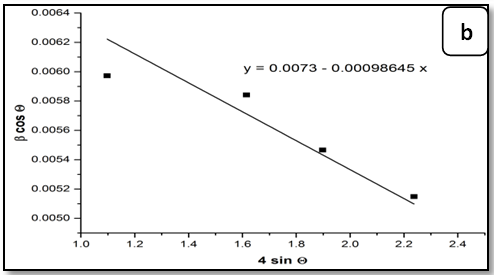
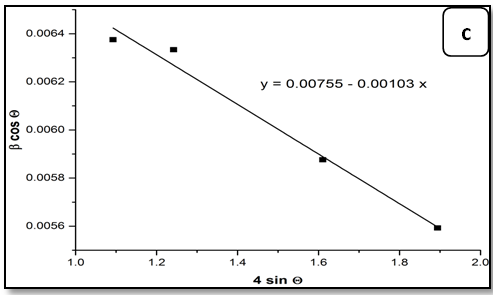
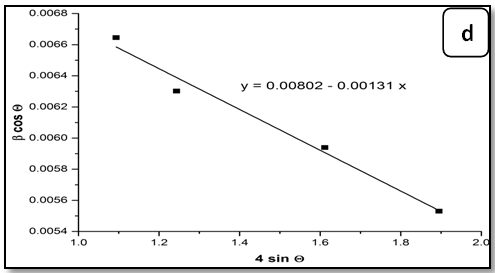
Figure 2: The W-H analysis of Ni-doped ZnO samples. a) Undoped, b) 0.04 Ni, c) 0.05 Ni and d) 0.08 Ni, assuming UDM.
Table 2: X-ray analysis of undoped and Ni-doped ZnO nanoparticles by Scherrer and Williamson-Hall.
| Samples | Scherrer method | Williamson-Hall method | ||
|---|---|---|---|---|
| D (nm) | δ × 10-4(nm)-2 | D (nm) | ε × 10-4 (no unit) | |
| Zn1.00Ni0.00O | 27.16 | 13.55 | 23.62 | 6.30 |
| Zn0.98Ni0.02O | 25.97 | 14.81 | 21.64 | 6.48 |
| Zn0.96Ni0.04O | 25.71 | 15.11 | 19.83 | 9.86 |
| Zn0.95Ni0.05O | 24.88 | 16.15 | 19.18 | 10.3 |
| Zn0.94Ni0.06O | 24.77 | 16.29 | 18.54 | 12.0 |
| Zn0.92Ni0.08O | 24.68 | 16.40 | 18.05 | 13.1 |
The energy dispersive X-ray spectroscopic analysis (EDX):
To confirm the presence of Ni ions in the synthesized nanoparticle ZnO, EDX measurements were done for all samples Zn1-xNixO as shown in Figure 3. It is observed that there is two peaks belong to Zn and Ni, through growing Ni concentration in samples heights of its peak increase. The data of EDX spectroscopy are presented in Table 3. EDX spectra show good agreement with the experimental concentration used for Zn1-xNixO samples.
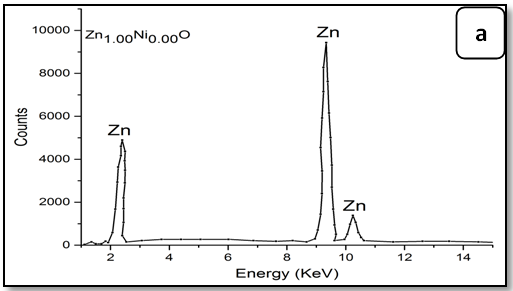
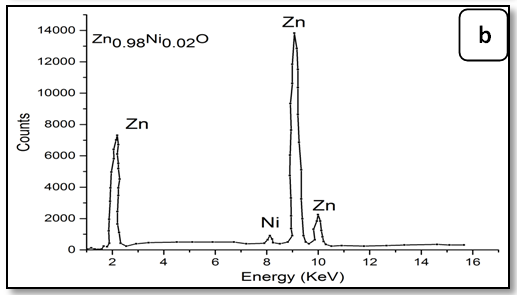
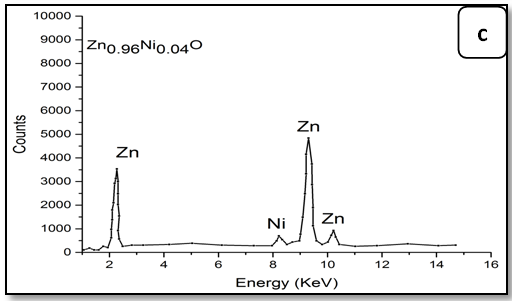
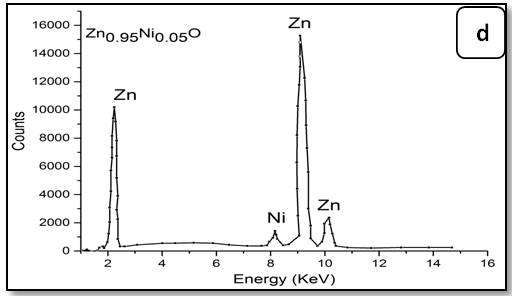
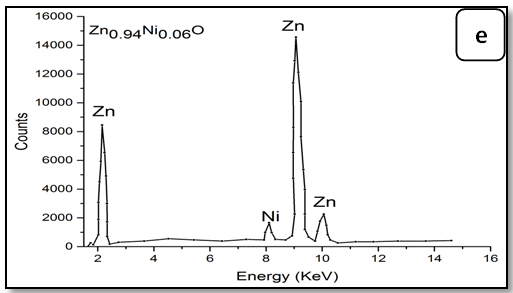
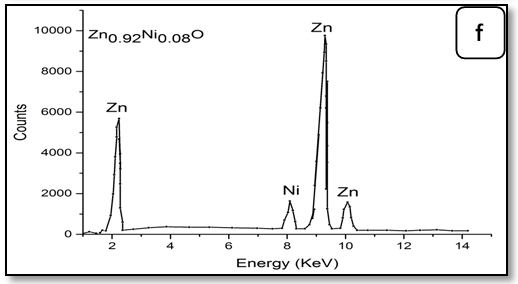
Figure 3: EDX pattern (a) ZnO undoped, (b) 0.02 Ni; (c) 0.04Ni, (d) 0.05Ni, (e) 0.06 Ni and (f) 0.08 Ni
Table 3: EDX data of Ni-doped ZnO nanoparticles.
| Samples | Percentage of the elements % Atomic (%) | ||
|---|---|---|---|
| Zn | Ni | Ni/Zn ratio | |
| Zn1.00Ni0.00O | 100.0 | - | - |
| Zn0.98Ni0.02O | 98.13 | 1.87 | 0.019 |
| Zn0.96Ni0.04O | 96.32 | 3.86 | 0.038 |
| Zn0.95Ni0.05O | 95.40 | 4.60 | 0.048 |
| Zn0.94Ni0.06O | 94.55 | 5.5 | 0.058 |
| Zn0.92Ni0.08O | 93.40 | 6.89 | 0.073 |
Optical Properties:
UV-Visible spectroscopy
Variance of the absorbance for undoped and Ni-doped ZnO with wavelength that change from 300 to 800 nm is illustrated in Figure 4. The absorption band edge of undoped ZnO is observed at 375 nm. Within the present study, the optical absorption of Ni-doped ZnO shows absorption peak around 378 - 381 nm (3.77 x 10⁻⁵ - 3.81 x 10⁻⁵ cm) correspond to the d-d transition bonds, which are characteristic of Ni2+ with octahedral symmetry. These electronic transitions suggest that Ni2+ ions are substituting Zn2+ ions in the octahedral ZnO. A sharp decrease in absorbance at around 375 nm indicates dominant band gap excitations in the UV region. Commonly, divalent Ni ions in an octahedral symmetry show three main bands at about 8300, 14080, 24995 cm-1[16]. Those bands are usually assigned due to the spin-allowed triplet-triplet transitions:
3A2g(F) → 3T2g(F), 3A2g(F) → 3T1g(F) and 3A2g(F) → 3T1g(P)
The obtained data reveal that the single observed absorption peak is most likely due to 3A2g(F) → 3T1g(P), electronic transitions occur between split ‘d’ levels of the central atom giving rise to so called d-d transition or ligand field spectra. Where this absorption bands corresponding to d–d transition is localized at 26525 cm-1.
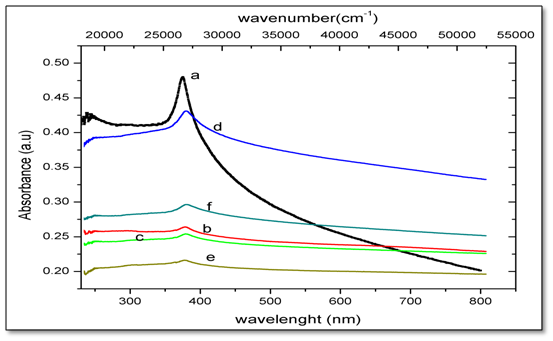
Figure 4: UV-Vis absorbance spectra of Zn1-xNixO, nanoparticles for x = (a) 0.00; (b) 0.02; (c) 0.04; (d) 0.05; (e) 0.06 and (f) 0.08.
The optical absorption coefficient (α) has been evaluated from the measured spectral, using Beer-Lambert law:
α =2.303 A/T (8)
Where A is the absorbance and T is the thickness of the sample.
The optical band gap was calculated using Tauc’s relation
(αhν)1/n = A(hν - Eg) (9)
Where, hν is the photon energy, Eg is the optical band gap of the film, α is the absorption co-efficient, A is a constant, and the exponent n is corresponding to the type of transition. The exponent n is equal to 1/2 and 2 according to the allowed direct and indirect band gaps, respectively. The energy band gap of undoped and Ni-doped ZnO can be obtained by plotting (αhν)² versus hν and extrapolating the linear portion of absorption edge to find the intercept with energy axis as shown in Figure 5. The observed linear relation suggests that the direct optical transition is the dominant absorption mechanism. It has been observed from Figure 6. That band gap decreases on increasing the Ni concentration. The decrease in the band gap may be due to the sp-d exchange interactions between the band electrons and the localized d electrons of the substituted divalent ions[17,18] i.e., manifestation of strong exchange interaction present between d electron of Ni, and the s and p electrons of host matrix. Ni2+ ions exist in an octahedral crystal field in the divalent valency state without changing the wurtzite crystal structure of ZnO.
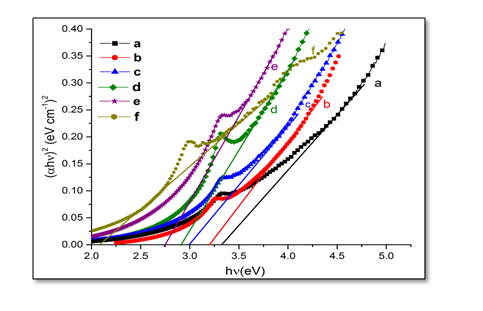
Figure 5: Band gap spectra of Zn1-xNixO, samples for x = (a) 0.00; (b) 0.02; (c) 0.04; (d) 0.05; (e) 0.06 and (f) 0.08
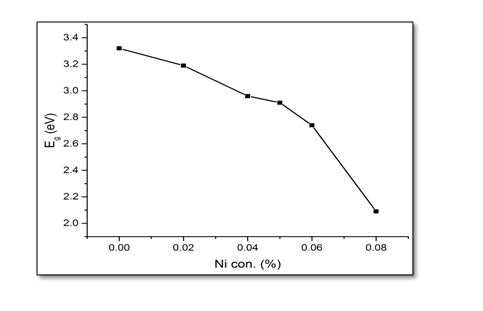
Figure 6: The variation of UV emission energy gap of undoped and Ni-doped ZnO.
Photoluminescence Properties
Photoluminescence spectra of Ni doped ZnO were measured using UV (325 nm) as exciting wavelength. PL spectra samples with different percentage of Ni doping Zn1-xNixO are shown in Figure 7. The PL spectra of shown samples display ultraviolet (UV) near-band-edge (NBE) emission. It is notice that ZnO exhibits UV band-edge emission and broad visible emission at green spectral band. It is observed that PL spectra of pure ZnO, Figure (7a) show a wide wave peak at 394 nm, and more broad bands are observed that located at 369.5, 465, 491 and 554 nm. The UV band-edge emission is attributed to free excitonic emission through an exciton-exciton collision. It is shown that the present PL spectra is the same for all investigated Ni doped ZnO samples. The addition of Ni oxides reduces the PL range with only one broad band. The PL spectrum of the doped samples has UV near-band-edge emission peak centered around 395 - 415 nm. The position of emission peak is shifted slightly to red shifts. The observed red shift in the absorption band edge with Ni-doping in ZnO may be due to the sp-d exchange interactions between the band electrons and the localized d-electrons of the Ni2+ ions.
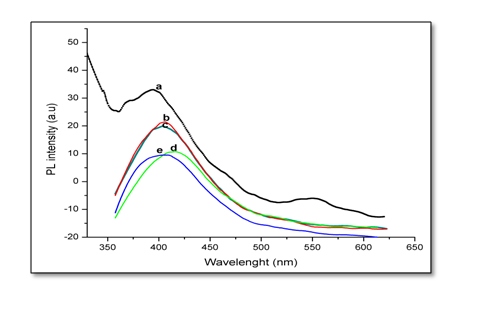
Figure 7: PL spectra of Zn1-xNixO, samples as a function of wavelength for x = (a) 0.00; (b) 0.02; (c) 0.04; (d) 0.05 and (e) 0.06.
Magnetic Measurements
The magnetic hysteresis of the prepared samples was investigated by Vibrating Sample Magnetometry (VSM) method for Ni-doped ZnO, (where x = 0.00, 0.02, 0.05, 0.06, 0.08). All samples show distinctly hysteresis loops at room temperature, indicating the ferromagnetic behavior of the samples at room-temperature. It is necessary to illustrate that the ZnO samples prepared with this batch show the signature of ferromagnetic behavior Figure 8. The presence of defect states of ZnO is responsible for magnetic properties of ZnO. The hysteresis behavior (M–H) in Ni-doped ZnO samples at room temperature is shown in Figure 9. The observed magnetic hysteresis loop and the saturation magnetization value shown clearly prove the existence of ferromagnetic. Room-temperature ferromagnetism (RTFM) in Ni-doped ZnO, (where x = 0.02, 0.05, 0.06, 0.08) samples whereas the saturation magnetization increases by increasing Ni concentration. It is also observed from the results obtained for M–H curve that the hysteresis is more prominent for x = 0.06. Figure 10 shows that the saturation magnetization (Ms) increases as in with increase in Ni doping and the origin of the observed room temperature ferromagnetism is most likely due to the intrinsic defects. The magnetic properties of transition metal doped ZnO nanoparticles are mediated by the ferromagnetic exchange between the dopant ion and defect states available in the ZnO. Moreover, the empty 3d states of Ni2+ ions hybridizes with the donor electron states at the Fermi level which set up a platform to manipulate the ferromagnetic characteristics of ZnO nanoparticles as well and give rise to long-range ferromagnetic order in the sample. Similar kinds of results have been reported earlier with Mn, Co and Ni-doped ZnO[19,20] and support the results of increase in the defects states with Ni2+ doping. At the same time M-H curves area shows no linear dependence on x. This can be accounted for on the basis of the microstructure. In Zn1-xNixO, (where x = 0.02, 0.05, 0.08) the grains are identical in shape and uniformly distributed. However at x = 0.06, the grains are well connected for which indirect exchange interaction in between grains increases, thereby increasing the size of the hysteresis loop[21]. The presents of ferromagnetism in Ni-doped ZnO have a number of possibilities. The first possibility is the formation of the secondary phase such as NiO, but this possibility can be easily excluded, which is most likely due to anti-ferromagnetic with a Neel temperature of 520K[22]. Another possibility in which Ni metal is the reason of ferromagnetism. However, the obtained XRD pattern analysis do not display any Ni peaks other than NiO. According to Rudderman–Kittel–Kasuya–Yoshida (RKKY) theory, the exchange interaction between local-spin polarized electrons and conduction electrons cause the magnetism. This interaction leads to the spin polarizations of conduction electrons. Subsequently, the spin polarization conductive electrons perform an exchange interaction with spin-polarized electrons of other Ni ions.
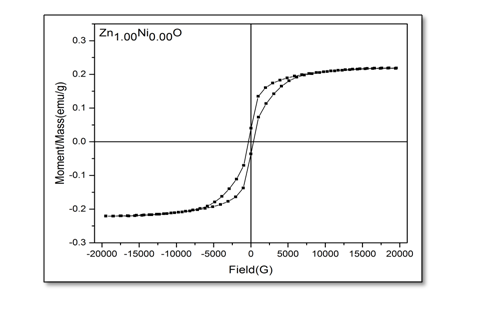
Figure 8: Hysteresis curve of undoped ZnO.
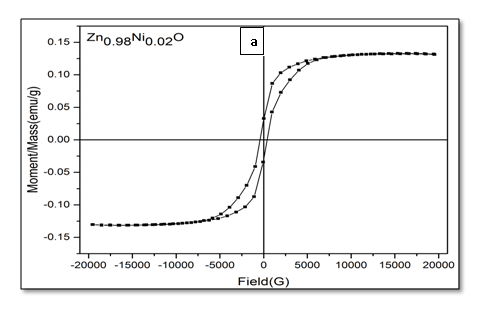
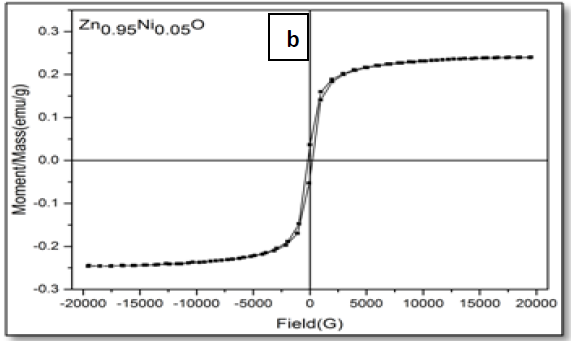
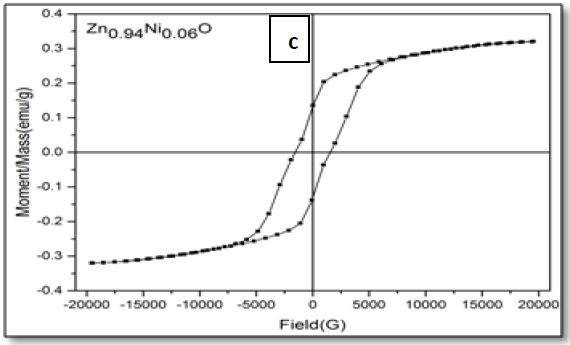
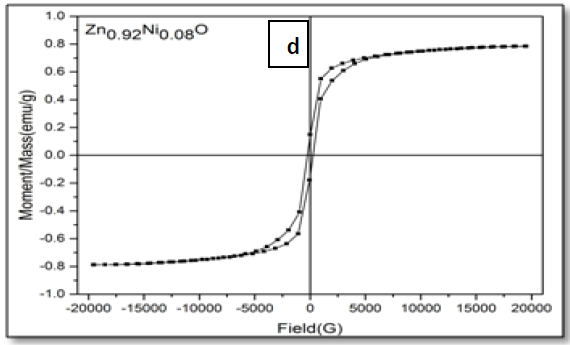
Figure 9: Hysteresis curve of Zn1–xNixO, samples for x = (a) 0.02; (b) 0.05; (c) 0.06 and (d) 0.08.
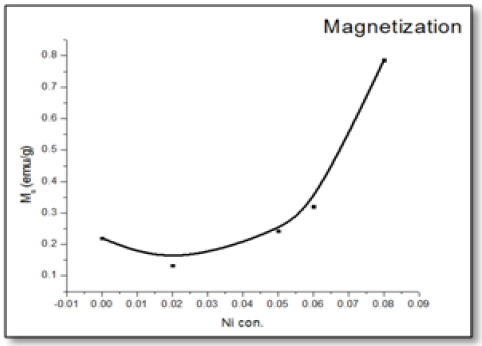
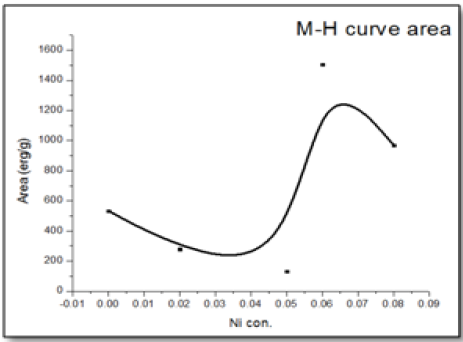
Figure 10: 10: Saturation magnetization (Ms), and M-H curves area of Zn1–xNixO, (where x = 0.00, 0.02, 0.05, 0.06 and 0.08) as a function of Ni concentrations.
Conclusion
The undoped and Ni-doped ZnO samples were synthesized by the chemical co-precipitation method. XRD exhibits that there is no additional peak corresponding to secondary phases of Ni in ZnO. EDX data confirmed the presence of Ni in prepared samples of Zn1–xNixO, (where x = 0.00, 0.02, 0.04, 0.05, 0.06, 0.08). UV-Vis spectroscopy reveals that Ni ions exist in octahedral crystal field in the divalent valence state without changing the wurtzite crystal structure of ZnO. The observed red shift in the optical absorption band edge and PL spectra with Ni-doping in ZnO may be due to the sp-d exchange interactions between the band electrons and the localized d-electrons of the Ni2+ ions, thus Ni2+ ions substitute Zn2+ ions in the crystal lattice. (VSM) results for Ni-doped ZnO show distinctly hysteresis loops at room temperature, indicating the ferromagnetic behavior of the samples at room-temperature. The presence of defect states of ZnO is responsible for magnetic properties of ZnO. Finally, it could be concluded that nickel doped ZnO nanostructures could be an efficient material for spintronics applications.
References
- 1. Kacman, P. Spin interactions in DMS and magnetic semiconductor structures. (2001) Semicond Sci Technol 16(4): S25–S39.
Pubmed || Crossref || Others - 2. Wolf, S.A., Awschalom, D.D., Buhrman, R.A., et al. Spintronics: A spin-based electronics vision for the future. (2001) Science 294(5546): S1488–S1495.
Pubmed || Crossref || Others - 3. Pearton, S.J., Abernathy, C.R., Overberg, M.E., et al. Wide band gap ferromagnetic semiconductors and oxides. (2003) J Appl Phy 93(1): S1–S21.
Pubmed || Crossref || Others - 4. Pearton, S.J., Norton, D.P., Ivill, M.P., et al. ZnO Doped With Transition Metal Ions. (2007) IEEE Transactions on Electron Devices 54(5): S1040-S1048.
Pubmed || Crossref || Others - 5. Sajid Husain, Rahman, F., Nasir Ali, et al. Nickel Sub-lattice Effects on the Optical Properties of ZnO Nanocrystals. (2013) J Optoelectron Eng 1(1): S28-S32.
Pubmed || Crossref || Others - 6. Gao, D.Q., Zhang, Z.H., Fu, J.L., et al. Room temperature ferromagnetism of pure ZnO nanoparticles. (2009) J Appl Phy 105(11).
Pubmed || Crossref || Others - 7. 7. Straumal, B.B., Mazilkin, A.A., Protasova, S.G., et al. Magnetization study of nanograined pure and Mn-doped ZnO films: formation of a ferromagnetic grain-boundary foam. (2009) Phy Rev B 79(20).
Pubmed || Crossref || Others - 8. Liu, W., Li, W., Hu, Z., et al. Effect of oxygen defects on ferromagnetic of undoped ZnO. (2011) J Appl Phy 110(1).
Pubmed || Crossref || Others - 9. Hui, Z., Deren, Y., Xiangyang, M., et al. Synthesis of flower-like ZnO nanostructures by an organic-free hydrothermal process. (2004) Nanotechnology 15(5): S622.
Pubmed || Crossref || Others - 10. Zhang, J., Sun, L.D., Yin, J.L., et al. Control of ZnO Morphology via a Simple Solution Route. (2002) Chem Mater 14(10): S4172-S4177.
Pubmed || Crossref || Others - 11. Gopalakrishnan, R., Muthukumaran, S. Nanostructure, optical and photoluminescence properties of Zn1−xNixO nanoclusters by co-precipitation method. (2013) J Mater Sci: Mater Electron 24(4): S1069–S1080.
Pubmed || Crossref || Others - 12. Cullity, B.D., Stock, S.R. Elements of X-ray diffraction, 3rd edition. (2001) Prentice Hall, New Jersey.
Pubmed || Crossref || Others - 13. Rogers, K.D., Daniels, P. An X-ray diffraction study of the effects of heat treatment on bone mineral microstructure. (2002) Biomaterials 23(12): S2577–S2585.
Pubmed || Crossref || Others - 14. Saleem, M., Fang, L., Ruan, H.B., et al. Effect of zinc acetate concentration on the structural and optical properties of ZnO thin films deposited by sol-gel method. (2012) Intl J Phy Sci 7(23): S2971–S2979.
Pubmed || Crossref || Others - 15. Suryanarayana, C., Norton, M.G. X-ray diffraction: a practical approach. (1998) Plenum Press Publishing, New York.
Pubmed || Crossref || Others - 16. Lakshmana Rao, J., Narendra, G.L., Lakshman, S.V.J. Optical Absorptlon Spectra of Cobalt(Π) and Nickel Ions in Lead Acetate Glasses. (1990) Pdyhedron 9(12): S1475-S1477.
Pubmed || Crossref || Others - 17. Khatoon, S., Ahmad, T. Synthesis, Optical and Magnetic Properties of Ni-Doped ZnO Nanoparticles. (2012) Journal of Materials Science and Engineering B 2(6): S325-S333.
Pubmed || Crossref || Others - 18. Zhao, Z.W., Tay, B.K., Chen, J.S., et al. Large Magnetic Moment Observed in Co-Doped ZnO Nanoclusters-Assembled Thin Films at Room Temperature. (2007) Appl Phys Lett 90(15).
Pubmed || Crossref || Others - 19. Koch, U., Fojtik, A., Henglein, A., et al. Photochemistry of semiconductor colloids. Preparation of extremely small ZnO particles, fluorescence phenomena and size quantization effects. (1985) Chem Phys Lett 122(5): S507-S510.
Pubmed || Crossref || Others - 20. Spanhel, L., Anderson, M.A. Semiconductor clusters in the sol-gel process: quantized aggregation, gelation, and crystal growth in concentrated zinc oxide colloids. (1991) J Am Chem Soc 113(8): S2826-S2833.
Pubmed || Crossref || Others - 21. Mohapatra, J., Mishra, D.K., Kamilla, S.K., et al. Ni-doped ZnO: Studies on structural and magnetic properties. (2011) Phys Status Solidi B 248(6): S1352–S1359.
Pubmed || Crossref || Others - 22. Schwartz, D.A., Kittilstved, K.R., Gamelin, D.R. Above-room-temperature ferromagnetic Ni2+-doped ZnO thin films prepared from colloidal diluted magnetic semiconductor quantum dots. (2004) Appl Phys Lett 85(8): S1395. https://doi.org/10.1063/1.1785872
Pubmed || Crossref || Others


