
Systolic & Diastolic Blood Pressure Determinants of Shock Patients
Rabindra Das
Affiliation
Department of Statistics, The University of Burdwan, Burdwan, West Bengal, India; E-mail: rabin.bwn@gmail.com
Corresponding Author
Rabindra Nath Das, Department of Statistics, The University of Burdwan, Burdwan, West Bengal, India; E-mail: rabin.bwn@gmail.com
Citation
Rabindra N.D., Systolic & Diastolic Blood Pressure Determinants of Shock Patients. (2017) J Heart Cardiol 3(2): 44- 50.
Copy rights
© 2017 Rabindra N.D. This is an Open access article distributed under the terms of Creative Commons Attribution 4.0 International License.
Keywords
Cardiac index; Diastolic blood pressure; Hemoglobin; Joint gamma models; Plasma volume index; Systolic blood pressure
Abstract
Objectives: Hypertension or blood pressure is highly correlated with stroke. The explanatory factors or the determinants of the systolic and diastolic blood pressure of some shock patients are examined in the current report.
Background: Previous research reports have discussed a little about the determinants of the systolic and diastolic blood pressure of shock patients. There is not any detailed discussion about the determinants of the systolic and diastolic blood pressure of shock patients.
Materials and Methods: The Shock Research Unit, The University of Southern California, Los Angeles, California has collected the shock data set on 113 shock patients with 20 variables / factors. The considered study responses namely, systolic and diastolic blood pressure are positive with non-constant variances, and they belong to exponential family. These type of responses should be analyzed using joint generalized linear gamma or Log-normal models.
Results: For the shock patients, mean Systolic Blood Pressure (SBP) is lower for taller patients (P < 0.001) than shorter. Mean SBP is higher for female shock patients (P = 0.013) than male, or survived shock patients (P = 0.024) than who are close to death. Mean SBP increases if Mean Arterial Blood Pressure (MAP) (P < 0.001), or heart rate (HR) (P = 0.004), or Body Surface Index (BSI) (P = 0.003), or Appearance Time (AT) (P = 0.004) increases. Mean SBP increases if Diastolic Blood Pressure (DBP) (P < 0.001), or Hemo Globin (HG) (P = 0.005) decreases. Variance of SBP increases if age (P = 0.069), or height (P = 0.022), or HR (P = 0.052), or Mean Central Venous Pressure (MCVP) (P = 0.001) increases. Also the SBP variance increases if the shock type is at hypovolemic = 2 (P < 0.001), or at other (cardiogenic, or bacterial, or neurogenic, or other) (P < 0.001). In addition, SBP variance increases if MAP (P < 0.001), or BSI (P = 0.086), or Cardiac Index (CI) (P = 0.080) decreases. Again, the mean diastolic blood pressure increases if height (P = 0.081), or MAP (P < 0.001), or HR (P < 0.001), or AT (P = 0.043), or HG (P = 0.077) increases. Also the mean DBP increases if SBP (P < 0.001), or Plasma Volume Index (PVI) (P = 0.069) decreases. The DBP variance increases if age (P < 0.001), or height (P < 0.001), or PVI (P < 0.001) increases. Moreover, the DBP variance increases if CI (P < 0.001), or Mean Circulation Time (MCT) (P = 0.012) decreases.
Conclusion: The explanatory factors of SBP & DBP have been derived for some shock patients, and it is noted herein that SBP & DBP are inversely correlated, but they are generally directly correlated for normal and cardiac patients. The reported results are completely new inputs in the shock patients study literature.
Introduction
In the present world, more than 30% of the adult individuals are suffered from hypertension[1], which is correlated with ischaemic heart disease for 47%, and 54% of stroke[2]. In practice, pharmacotherapy is mainly used for the management of hypertension. There is lot of hypertension drugs available in the market, but for a given drug, the rate of responses are nearly 50%. It is observed in practice that out of three hypertension patients, the blood pressure is controlled to the target only for one patient[3]. Some research reports have pointed that approximately 53% uncontrolled hypertension patients were nonadherent to treatments[4,5]. Several factors such as biochemical parameters, lifestyle and sleep apnoea have some effects on uncontrolled blood pressure. Note that the genetic effects[6], and intra-individual blood pressure variation[7] have a strong effect on the drug responses.
The European Hypertension Society[8], and the American Heart Association[9] independently described the self-monitoring of blood pressure guidelines by patients at home in 2008. The above two guidelines have suggested that the self-monitoring of blood pressure by patients at home is essential for initial diagnostic phase of patients with variability Blood Pressure (BP), and for monitoring of long-term hypertension patients[8,9]. Some research articles have examined the performance of these two guidelines for hypertension phenotypes (masked hypertension, white-coat, sustained) diagnosis in the treated and untreated patients, by using ambulatory blood pressure monitoring[10-15].
Hypertension is strongly correlated with ischaemic heart disease and stroke, while stroke is correlated with the BP. The present report aims to determine the explanatory factors of SBP and DBP for some shock patients[16,17]. A short description of the explanatory variables of SBP & DBP for some shock patients is given in[16]. The report has observed that the responses SBP & DBP are positive, continuous and with non-constant variances. Therefore, these two responses have been modeled using both the joint generalized linear gamma and Log-normal models[18-23].
The explanatory variables of SBP & DBP of 113 shock patients with 20 variables/ factors[16] have been derived in the report. The basic hypotheses in the report are as follows. What are the statistical significant explanatory factors/ variables of SBP & DBP of the shock patients given in[16]. How are the explanatory variables correlated with SBP & DBP? What are the role of the explanatory variables on SBP & DBP? These hypotheses have been evaluated based on a real data set of the shock patients given in[16].
Materials & Methodology
Materials: The considered hypotheses in the report have been examined based on data of 113 shock patients[16] with 20 variables / factors which are available in the site: http://www.umass.edu/statdata/statdata/data/shock.txt. The covariates, factors, and the data collection method have been described in[16]. The shock data set has been collected by the Shock Research Unit, The University of Southern California, Los Angeles, California. Measurements on 113 shock patients with 20 variables / factors have been repeated twice (one at the admission time, and the other at the discharge time). The included factors / variables in the shock data set are sex (male = 0, female = 1), height, Body Surface Index (BSI), age, Heart Rate (HR), shock type (non-shock = 1, hypovolemic = 2, cardiogenic, or bacterial, or neurogenic or other = 3), Diastolic Blood Pressure (DBP), Mean Arterial Blood Pressure (MABP), Systolic Blood Pressure (SBP), Mean Central Venous Pressure (MCVP), Plasma Volume Index (PVI), mean circulation time (MCT), Urinary Output (UO), Hemo Globin (HG), Appearance Time (AT), Red Cell Index (RCI), Cardiac Index (CI), survival stage (survived = 1, death = 2), Hematocrit (HCT), order of card record (initial = 1, final = 2) (OCR).
Statistical Methods
It is observed in practice that some positive continuous random responses have exponential family distributions. In general, they are analyzed by generalized class linear models, and they may have non-constant variance as their variances may have some relationship with their means. Under these situations, Joint Generalized Linear Models (JGLMs) (Log-normal or gamma) are used[24]. A detailed discussion of JGLMs are given in[18,22-24]. Interested readers are requested to go through the articles[22,24]. In the present report, the interested responses are systolic and diastolic blood pressures. It is identified herein that both the responses are hetero scedastic and gamma distributed. For ready references, the joint generalized linear gamma models are described here in shortly.
For the positive data yi ’s, E(yi) = μi and Var (Yi) = σi² μi²
Where σi² is the dispersion parameter. Note that V(.) is generally used as the variance function which has two parts in GLMs. One part is σi² which is independent of mean changes, and the other is V(μi) which depends on mean adjustment. In addition, the variance function (V (.)) identifies the GLM family distribution. For example, if V(μ) = 1, the distribution is normal. Similarly, the distribution is gamma if V(μ) = μ², and Poisson if V(μ) = μ etc.
The joint generalized linear models for the mean and dispersion parameters are
νi = g(μi ) = xit β And εi = h(σi²) = witγ,
where g(.) and h(.) are GLM link functions (a relationship between the mean or the variance with the linear predictors) for the mean and the dispersion, respectively, and xit , wit are the row vectors of explanatory variables / factors for regression models. The mean parameters (β) are estimated by Maximum Likelihood (ML) method, while the dispersion parameters (γ) are estimated by restricted ML method[18-23].
Systolic blood pressure analysis, results & interpretations
SBP Analysis: Systolic blood pressure of the shock patients is treated as the dependent variable, and the remaining others (factors / variables) are consider as the independent variables. Here SBP has been identified as heteroscedastic, so it has been modeled based on both the joint generalized linear gamma and Log-normal models[18,22,23]. It is observed herein that the joint gamma models give better results. Therefore, we have only reported the results of joint gamma models. The final fitted models have been selected based on the smallest Akaike Information Criterion (AIC) value in each class. Note that the AIC selects a model which minimizes the predicted additive errors and squared error loss[25] The joint gamma fitted SBP models are given in Table 1 with smallest AIC =1683.083. All the selected effects of the SBP models (Table 1) are almost significant, except only the shock type in the mean model. Note that, the included statistical insignificant factors in the models are known as confounders in epidemiology. For the gamma fitted models (Table 1), the diagnostic plots, namely, absolute residuals plot and normal plot have been examined in Figure 1.
Table 1: Joint Gamma fitted model results of SBP for Shock patients.
| Model | Covariate | estimate | standard error | t-vale | P-value |
|---|---|---|---|---|---|
| Mean model |
Constant | 3.9459 | 0.0739 | 53.331 | < 0.001 |
| Age (x1) | -0.0005 | 0.00037 | -1.404 | 0.162 | |
| Height (x2) | -0.0016 | 0.00015 | -10.513 | < 0.001 | |
| Sex (Fx3 2) | 0.0272 | 0.01086 | 2.508 | 0.013 | |
| Survival stage (Fx4 2) | -0.0308 | 0.01342 | -2.295 | 0.024 | |
| Shock type (Fx5 2) | 0.0192 | 0.01463 | 1.315 | 0.190 | |
| Shock type (Fx5 3) | -0.0166 | 0.01409 | -1.175 | 0.241 | |
| Mean arterial pressure (MAP) (x7) | 0.0202 | 0.00095 | 21.194 | < 0.001 | |
| Heart rate (x8) | 0.0006 | 0.00022 | 2.887 | 0.004 | |
| Diastolic blood pressure (DBP) (x9) | -0.0115 | 0.00115 | -9.986 | < 0.001 | |
| Body surface index (BSI) (x11) | 0.0827 | 0.02720 | 3.040 | 0.003 | |
| Appearance time (x13) | 0.0045 | 0.00157 | 2.874 | 0.004 | |
| Hemoglobin (x18) | -0.0080 | 0.00281 | -2.829 | 0.005 | |
| Dispersion Model |
Constant | -6.826 | 2.5401 | -2.687 | 0.008 |
| Age (x1) | 0.013 | 0.0073 | 1.828 | 0.069 | |
| Height (x2) | 0.044 | 0.0192 | 2.308 | 0.022 | |
| Shock type (Fx5 2) | -1.106 | 0.3145 | -3.518 | < 0.001 | |
| Shock type (Fx5 3) | -1.268 | 0.3104 | -4.085 | < 0.001 | |
| Mean arterial pressure (MAP) (x7) | -0.044 | 0.0047 | -9.393 | < 0.001 | |
| Heart rate (x8) | 0.007 | 0.0036 | 1.951 | 0.052 | |
| Mean central venous pressure (MCVP) (x10) | 0.063 | 0.0191 | 3.303 | 0.001 | |
| Body surface index (BSI) (x11) | -1.543 | 0.8941 | -1.725 | 0.086 | |
| Cardiac index (CI)s (x12) | -0.145 | 0.0821 | -1.762 | 0.080 |
The normal probability plot of the SBP gamma fitted mean model (Table 1) is displayed in Figure 1(a). It does not show any systematic departure. The absolute residuals plot of the gamma fitted models (Table 1), with respect to fitted values is shown in Figure 1(b), which is almost a flat diagram, implying that the variance is constant with the running means. No lack of fit is observed in both the figures.
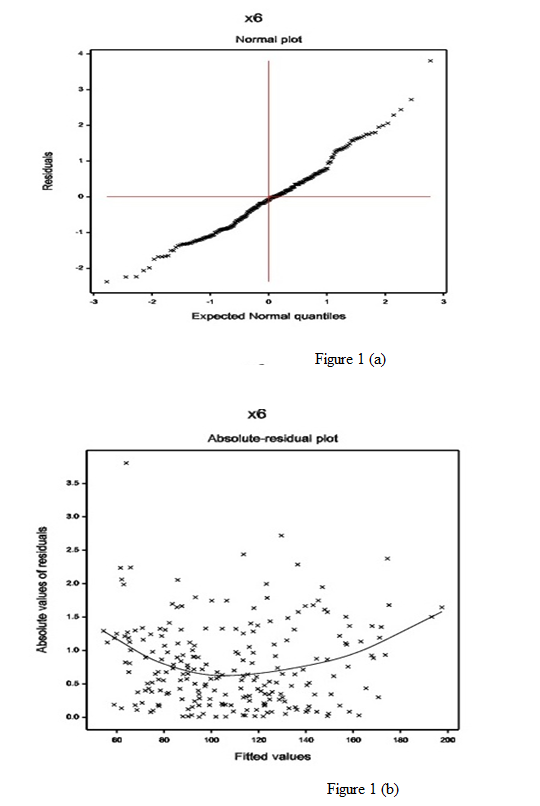
Figure 1: For the gamma fitted SBP models (Table 1), the (a) normal probability plot of the mean model, and the (b) absolute residuals plot with respect to fitted values.
SBP Results: Summarized results of the systolic blood pressure analysis are given in Table 1. The mean systolic blood pressure of shock patients is negatively associated with the height (P < 0.001), or age (P = 0.162), or survival status (P = 0.024), or diastolic blood pressure (P < 0.001), or hemoglobin (P = 0.005), while it is positively associated with the sex (P = 0.013), mean arterial blood pressure (P < 0.001), or heart rate (P = 0.004), or body surface index (P = 0.003), or appearance time (P = 0.004).
The SBP variance of shock patients is positively associated with the age (P = 0.069), or height (P = 0.022), or heart rate (P = 0.052), or mean central venous pressure (P = 0.001), while it is negatively associated with the shock type at hypovolemic = 2 (P < 0.001), or at other (cardiogenic, or bacterial, or neurogenic, or other) (P < 0.001), or mean arterial blood pressure (P < 0.001) or body surface index (P = 0.086), or cardiac index (P = 0.080).
Interpretations of systolic blood pressure analysis
The SBP data analysis results are given in above, and their summarized form is shown in Table 1, which interprets the followings.
The mean model of SBP (Table 1) presents the following
• For the shock patients, the mean SBP is inversely partially associated with the age (P = 0.162), implying that the SBP is higher for younger shock patients than older. But for general cardiac patients, the scenario is completely reverse[26,27].
• The mean SBP is inversely significantly correlated with the height (P < 0.001) of shock patients, implying that SBP is higher for shorter shock patients than taller.
• The mean SBP is directly correlated with the sex (male = 0, female = 1) (P = 0.013), implying that SBP is higher for female shock patients than male. But for cardiac patients, who underwent dobutamine stress echocardiography, the scenario is completely opposite[27].
• The SBP mean is reciprocally correlated with the survival stage (survived = 1, death = 2) (P = 0.024), implying that SBP is higher for living shock patients than who are close to death.
• The SBP mean is directly correlated with the MAP (P < 0.001) of shock patients, implying that SBP increases as the MAP increases.
• The SBP mean is directly correlated with the HR (P = 0.004) of shock patients, implying that SBP increases as the HR increases. Note that for cardiac patients, who underwent dobutamine stress echocardiography, the mean SBP is inversely correlated with the basal heart rate & peak heart rate, and it is directly correlated with the maximum heart rate[27]. Also for Worcester Heart Attack Study (WHAS) data set, mean SBP is inversely correlated with the HR[28]. For shock patients, the scenario is completely reverse.
• The SBP mean is inversely correlated with the DBP (P < 0.001) of shock patients, implying that SBP increases as the DBP decreases. For WHAS data set, SBP is directly correlated with the DBP[28].
• The SBP mean is directly correlated with the BSI (P = 0.003) of shock patients, implying that SBP increases as the BSI increases.
• The SBP mean is directly correlated with the appearance time (P = 0.004) of shock patients, implying that SBP increases as the appearance time increases.
• The SBP mean is inversely correlated with the hemoglobin (P = 0.005) of shock patients, implying that SBP increases as the hemoglobin decreases.
The variance model of SBP (Table 1) presents the following
• The SBP variance is directly correlated with the age (P = 0.069) of shock patients, implying that SBP is highly scattered among the older shock patients.
• The SBP variance is directly correlated with the height (P = 0.022) of shock patients, implying that SBP is highly scattered for the taller shock patients.
• The SBP variance is inversely correlated with the shock type at hypovolemic = 2 (P < 0.001), or at other = 3 (cardiogenic, or bacterial, or neurogenic, or other) (P < 0.001) of shock patients, implying that SBP is highly scattered among the non-shock patients.
• The SBP variance is inversely correlated with the MAP (P < 0.001) of shock patients, implying that SBP variance increases as the MAP decreases.
• The SBP variance is directly correlated with the HR (P = 0.052) of shock patients, implying that SBP variance increases as the HR increases.
• The SBP variance is directly correlated with the mean central venous pressure (MCVP) (P = 0.001) of shock patients, implying that SBP variance increases as the MCVP increases.
• The SBP variance is inversely partially correlated with the BSI (P = 0.086) of shock patients, implying that SBP variance increases as the BSI decreases.
• The SBP variance is inversely partially correlated with the Cardiac Index (CI) (P = 0.080) of shock patients, implying that SBP variance increases as the CI decreases.
Diastolic blood pressure analysis, results & interpretations
DBP Analysis: Diastolic blood pressure of the shock patients is treated as the dependent variable, and the remaining others (factors / variables) are consider as the independent variables. Here DBP has been identified as heteroscedastic, so it has been modeled based on both the joint generalized linear gamma and Log-normal models. It is observed herein that the joint gamma models give better results. Therefore, we have only reported the results of joint gamma models. The final fitted models have been selected based on smallest AIC value in each class. The joint gamma fitted DBP models are given in Table 2 with smallest AIC = 1372.834. All the selected effects of the DBP models (Table 2) are almost significant, except only the sex & shock type in the mean model. For the gamma fitted models (Table 2), the diagnostic plots, namely, absolute residuals plot and normal plot have been examined in Figure 2.
Table 2: Joint Gamma fitted model results of DBP for Shock patients.
| Model | Covariate | estimate | standard error | t-vale | P-value |
|---|---|---|---|---|---|
| Mean model |
Constant | 27558 | 0.07720 | 35.696 | < 0.001 |
| Height (x2) | 0.0004 | 0.00021 | 1.752 | 0.081 | |
| Sex (Fx3 2) | 0.0085 | 0.01230 | 0.689 | 0.492 | |
| Survival stage (Fx4 2) | -0.0412 | 0.01560 | -2.641 | 0.009 | |
| Shock type (Fx5 2) | 0.0163 | 0.01680 | 0.968 | 0.334 | |
| Shock type (Fx5 3) | 0.0180 | 0.01631 | 1.104 | 0.271 | |
| Systolic blood pressure (SBP) (x6) | -0.0029 | 0.00050 | -5.755 | < 0.001 | |
| Mean arterial pressure (MAP) (x7) | 0.0183 | 0.00073 | 25.161 | < 0.001 | |
| Heart rate (x8) | 0.0010 | 0.00021 | 4.851 | < 0.001 | |
| Appearance time (x13) | 0.0028 | 0.00136 | 2.040 | 0.043 | |
| Plasma volume index (PVI) (x16) | -0.0009 | 0.00049 | -1.825 | 0.069 | |
| Hemoglobin (x18) | 0.0061 | 0.00341 | 1.775 | 0.077 | |
| Card Seq. order (Fx20 2) | -0.0447 | 0.01226 | -3.648 | < 0.001 | |
| Dispersion Model |
Constant | -17.268 | 3.1618 | -5.461 | < 0.001 |
| Age (x1) | 0.022 | 0.0064 | 3.437 | < 0.001 | |
| Height (x2) | 0.069 | 0.0175 | 3.968 | < 0.001 | |
| Sex (Fx3 2) | 0.563 | 0.3328 | 1.690 | 0.092 | |
| Mean central venous pressure (MCVP) (x10) | 0.028 | 0.0199 | 1.382 | 0.168 | |
| Cardiac index (CI) (x12) | -0.527 | 0.1262 | -4.177 | < 0.001 | |
| Mean circulation time (MCT) (x14) | -0.042 | 0.0165 | -2.520 | 0.012 | |
| Plasma volume index (PVI) (x16) | 0.036 | 0.0087 | 4.089 | < 0.001 |
The normal probability plot of the DBP gamma fitted mean model (Table 2) is displayed in Figure 2(a). It does not show any systematic departure. The absolute residuals plot of the gamma fitted models (Table 2), with respect to fitted values is shown in Figure 2(b). It is almost a flat diagram, indicating that the variance is constant with the running means. Both the figures show that there is no lack of fit.
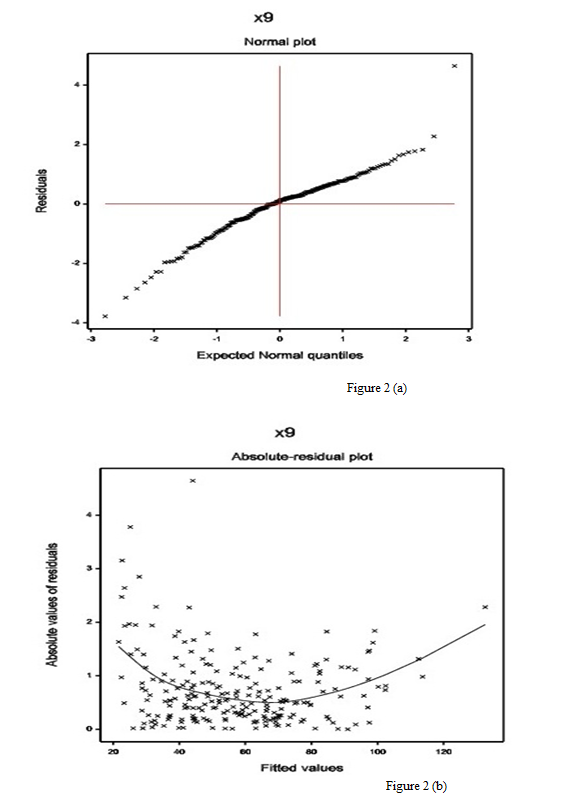
Figure 2: For the gamma fitted DBP models (Table 2), the (a) normal probability plot of the mean model, and the (b) absolute residuals plot with respect to fitted values.
DBP Results: Summarized results of the diastolic blood pressure analysis are given in Table 2. The mean diastolic blood pressure of shock patients is negatively associated with the survival stage (P = 0.009), or SBP (P < 0.001), or plasma volume index (P = 0.069), or order of card record (P < 0.001), while it is positively associated with the height (P = 0.081), mean arterial blood pressure (P < 0.001), or heart rate (P < 0.001), or appearance time (P = 0.043), or hemoglobin (P = 0.077).
The DBP variance of shock patients is positively associated with the age (P < 0.001), or height (P < 0.001), or sex (P = 0.092), or plasma volume index (P < 0.001), while it is negatively associated with the cardiac index (P < 0.001), or mean circulation time (P = 0.012).
Interpretations of diastolic blood pressure analysis
Results of DBP data analysis are given in above, and their summarized results are displayed in Table 2, which interprets the followings.
The mean model of DBP (Table 2) presents the following:
• For the shock patients, the mean DBP is directly partially correlated with the height (P = 0.081), implying that the DBP is higher for taller shock patients than shorter.
• The DBP mean is reciprocally correlated with the survival stage (survived = 1, death = 2) (P = 0.009), implying that DBP is higher for living shock patients than who are close to death.
• The DBP mean is inversely correlated with the SBP (P < 0.001) of shock patients, implying that DBP increases as the SBP decreases. For WHAS data set, DBP is directly correlated with the SBP[28].
• The DBP mean is directly correlated with the MAP (P < 0.001) of shock patients, implying that DBP increases as the MAP increases.
• The DBP mean is directly correlated with the HR (P < 0.001) of shock patients, implying that DBP increases as the HR increases. Also for WHAS data set, mean DBP is directly correlated with the HR[28].
• The DBP mean is directly correlated with the appearance time (P = 0.043) of shock patients, implying that DBP increases as the appearance time increases.
• The DBP mean is inversely correlated with the plasma volume index (P = 0.069) of shock patients, implying that DBP increases as the PVI decreases.
• The DBP mean is directly correlated with the hemoglobin (P = 0.077) of shock patients, implying that DBP increases as the hemoglobin increases.
• The DBP mean is inversely correlated with the order of the card record (initial = 1, final = 2) (P < 0.001) of shock patients, implying that DBP is higher at the initial stage of the patients than the final stage.
The variance model of DBP (Table 2) presents the following
• The DBP variance is directly correlated with the age (P < 0.001) of shock patients, implying that DBP is highly scattered among the older shock patients.
• The DBP variance is directly correlated with the height (P < 0.001) of shock patients, implying that DBP is highly scattered among the taller shock patients.
• The DBP variance is directly partially correlated with the sex (male = 0, female = 1) (P = 0.092) of shock patients, implying that DBP variance is higher for the female shock patients than male.
• The DBP variance is directly partially correlated with the MCVP (P = 0.168) of shock patients, implying that DBP variance increases as the MCVP increases.
• The DBP variance is inversely correlated with the CI (P < 0.001) of shock patients, implying that DBP variance increases as the CI decreases.
• The DBP variance is inversely correlated with the mean circulation time (MCT) (P = 0.012) of shock patients, implying that DBP variance increases as the MCT decreases.
• The DBP variance is directly correlated with the PVI (P < 0.001) of shock patients, implying that DBP variance increases as the PVI increases.
Conclusion
The current report has derived the determinants of SBP & DBP of the shock patients given in[16]. The derived results are given in Tables 1 & 2, which are obtained based on comparison of both the joint Log-normal & gamma models. The reported results can be verified by the data given in the site: http://www.umass.edu/statdata/statdata/data/shock.txt. Most of the results (in Tables 1 & 2) are almost new in the shock study literature. Specially, the determinants of the variances of SBP & DBP are new addition in the shock study literature.
For the shock patients, SBP and DBP are inversely associated (Tables 1 & 2), while they are directly associated for WHAS data set[28,29]. In Table 1, SBP is directly associated with the heart rate for shock patients, but they are inversely associated for WHAS data set[28]. Note that DBP & heart rate are directly associated for both the shock patients (Table 2) and WHAS data set[29]. The mean SBP is directly associated with the sex (male = 0, female = 1) for both the shock patients (Table 1) and WHAS data set[28,29]. Shock types are significantly associated with the variance of SBP, while they are insignificant with both the means of SBP & DBP, and variance of DBP (Tables 1, 2). Both the means of SBP & DBP are highly directly associated with the mean arterial blood pressure. The SBP mean is inversely associated, while the DBP mean is directly associated with the hemoglobin of shock patients. There are many more interesting findings in the report (Tables 1, 2).
The gamma fitted SBP & DBP models (Tables 1, 2) reflect the complex relationships between the response and the determinants. Note that an appropriate fitted stochastic model may open the truth which is hidden in a complex system. The reported models (Tables 1, 2) have been obtained by satisfying the following five criteria. Final model is selected based on (i) comparison of both the Log-normal and gamma models, (ii) smallest AIC, (iii) smaller standard deviation of the estimates, (iv) appropriate diagnostic plots, (v) identifying the appropriate response variable distribution. We have greater faith in the reported results.
The determinants of SBP & DBP, and their effects for shock patients have been derived in the report. The reported results may help the cardiac patients, researchers, and medical practitioners. It is noted herein that the determinant of shock patients may be different from normal cardiac patients, and the cardiac patients who under went dobutamine stress echocardiography[28,29]. Further research is required to compare the determinants of SBP & DBP between the shock patients and normal cardiac patients. Medical practitioners should care on mean arterial blood pressure, hemoglobin, and plasma volume index, shock types, mean central venous pressure of the shock patients to control the SBP & DBP.
Acknowledge:
The author is very much indebted to the referees who have provided valuable comments to improve the papers.
Conflict of interest:
The author confirms that this article content has no conflict of interest.
References
- 1. Kearney, P.M., Whelton, M., Reynolds, K., et al. Global burden of hypertension: analysis of worldwide data. (2005) Lancet 365(9455): 217-223.
Pubmed || Crossref || Others - 2. Micha, R., Wallace, S.K., Mozaffarian, D. Red and processed meat consumption and risk of incident coronary heart disease, stroke, and diabetes mellitus: a systematic review and meta-analysis. (2010) Circulation 121(21): 2271-2283.
Pubmed || Crossref || Others - 3. Falaschetti, E., Chaudhury, M., Mindell, J., et al. Continued improvement in hypertension management in England: results from the Health Survey for England 2006. (2009) Hypertension 53(3): 480-486.
Pubmed || Crossref || Others - 4. Tomaszewski, M., White, C., Patel, P., et al. High rates of non adherence to antihypertensive treatment revealed by high-performance liquid chromatography-tandem mass spectrometry (HP LC-MS/MS) urine analysis. (2014) Heart 100(11): 855-861.
Pubmed || Crossref || Others - 5. Jung, O., Gechter, J.L., Wunder, C. et al. Resistant hypertension? Assessment of adherence by toxicological urine analysis. (2013) J Hypertens 31(4): 766-774.
Pubmed || Crossref || Others - 6. Menni, C. Blood pressure pharmacogenomics: gazing into a misty crystal ball. (2015) J Hypertens 33(6): 1142-1143.
Pubmed || Crossref || Others - 7. Parati, G., Ochoa, J.E., Lombardi, C., et al. Assessment and management of blood-pressure variability. (2013) Nat Rev Cardiol 10(3): 143-155.
Pubmed || Crossref || Others - 8. Parati, G., Stergiou, G.S., Asmar, R., et al. European Society of Hypertension guidelines for blood pressure monitoring at home: a summary report of the Second International Consensus Conference on Home Blood Pressure Monitoring. (2008) J Hypertens 26(8): 1505-1526.
Pubmed || Crossref || Others - 9. Pickering, T.G., Miller, N.H., Ogedegbe, G., et al. Call to action on use and reimbursement for home blood pressure monitoring: a joint scientific statement from the American Heart Association, American Society of Hypertension, and Preventive Cardiovascular Nurses Association. (2008) Hypertension 52(1): 1-9.
Pubmed || Crossref || Others - 10. Stergiou, G.S., Bliziotis, I.A. Home blood pressure monitoring in the diagnosis and treatment of hypertension: a systematic review. (2011) Am J Hypertens 24(2): 123-134.
Pubmed || Crossref || Others - 11. Stergiou, G.S., Kollias, A., Zeniodi, M. et al. Home blood pressure monitoring: primary role in hypertension management. (2014) Curr Hypertens Rep 16(8): 462-469.
Pubmed || Crossref || Others - 12. Stergiou, G.S., Zourbaki, A.S., Skeva. I.I., et al. White coat effect detected using self-monitoring of blood pressure at home: comparison with ambulatory blood pressure. (1998) Am J Hypertens 11(7): 820-827.
Pubmed || Crossref || Others - 13. Stergiou, G.S., Skeva, I.I., Baibas, N.M., et al. Diagnosis of hypertension using home or ambulatory blood pressure monitoring: comparison with the conventional strategy based on repeated clinic blood pressure measurements. (2000) J Hypertens 18(12): 1745-1751.
Pubmed || Crossref || Others - 14. Masding, M.G., Jones, J.R., Bartley, E., et al. Assessment of blood pressure in patients with type 2 diabetes: comparison between home blood pressure monitoring, clinic blood pressure measurement and 24-h ambulatory blood pressure monitoring. (2001) Diabet Med 18(6): 431-437.
Pubmed || Crossref || Others - 15. Hond, E.D., Celis, H., Fagard, R., et al. Self-measured versus ambulatory blood pressure in the diagnosis of hypertension. (2003) J Hypertens 21(4): 717-722.
Pubmed || Crossref || Others - 16. Afifi, A.A, Azen, S.P. Statistical Analysis: A Computer Oriented Approach, 2nd ed. (1979) Academic Press New York.
Pubmed || Crossref || Others - 17. Das, R.N. Hypertension Risk Factors of Shock Patients. (2016) Health Care : Current Reviews 4(4): 1-3.
Pubmed || Crossref || Others - 18. Lee, Y., Nelder, J.A., Pawitan, Y. Generalized Linear Models with Random Effects (Unified Analysis via H-likelihood). (2006) Chapman & Hall, London.
Pubmed || Crossref || Others - 19. Myers, R.H., Montgomery, D.C., Vining, G.G., et al. Generalized Linear Models with Applications in Engineering and the Sciences. (2002) John Wiley & Sons, New York.
Pubmed || Crossref || Others - 20. Firth D. Multiplicative errors: log-normal or gamma?. (1988) J R Statist Soc B 50(2): 266-268.
Pubmed || Crossref || Others - 21. Das, R.N., Lee, Y. Analysis strategies for multiple responses in quality improvement experiments. (2010) Int J Qual Engineering Techno 1(4): 395-409.
Pubmed || Crossref || Others - 22. Das, R.N., Park, J.S. Discrepancy in regression estimates between log-normal and gamma: some case studies. (2012) J Applied Statistics 39(1): 97-111.
Pubmed || Crossref || Others - 23. Das, R.N., Lee, Y. Log normal versus gamma models for analyzing data from quality-improvement experiments. (2008) Qual Engineering 21(1): 79-87.
Pubmed || Crossref || Others - 24. Nelder, J.A., Lee, Y. Generalized linear models for the analysis of Taguchi-type experiments. (1991) Applied Stochastic Models and Data Analysis 7(1): 107-120.
Pubmed || Crossref || Others - 25. Hastie, T., Tibshirani, R., Friedman, J. The Elements of Statistical Learning. (2001) Springer-Verlag, New York.
Pubmed || Crossref || Others - 26. Das, R.N. Blood Pressure for Different Types of Patients. (2016) Interventional Cardiology J 2(2): e29.
Pubmed || Crossref || Others - 27. Das, R.N. Hypertension risk factors who underwent Dobutamine stress echocardiography. (2016) Interventional Cardiology 8(1): 595-605.
Pubmed || Crossref || Others - 28. Das, R.N. Systolic Blood Pressure Determinants. (2017) Annals of Clinical Hypertension 1: 032-038.
Pubmed || Crossref || Others - 29. Das, R.N. Determinants of acute myocardial infarction of Worcester heart attack study. (2016) J Heart and Cardiology 3(4): 1-7.
Pubmed || Crossref || Others


